Vor Kurzem aufgerufene Suchen
Keine vor kurzem aufgerufene Suchen
Embrace Support
Beigetreten 16. Okt. 2021
·
Letzte Aktivität 27. Dez. 2023
Folge ich
0
Follower
0
Gesamtaktivitäten
16
Stimmen
3
Abonnements
5
AKTIVITÄTSÜBERSICHT
BADGES
BEITRÄGE
POSTS
COMMUNITY-KOMMENTARE
BEITRAGSKOMMENTARE
AKTIVITÄTSÜBERSICHT
Neueste Aktivität von Embrace Support
Embrace Support hat einen Kommentar hinterlassen
Any update on this feature request?
Kommentar anzeigen · Gepostet 03. Okt. 2023 · Embrace Support
0
Follower
0
Stimmen
0
Kommentare
Embrace Support hat einen Kommentar hinterlassen
+1 I need this too!
Kommentar anzeigen · Gepostet 03. Okt. 2023 · Embrace Support
0
Follower
0
Stimmen
0
Kommentare
Embrace Support hat einen Post erstellt
Feature Request Summary:
Zendesk Explore with Beta dashboards should not only offer dashboard restrictions for Agents but also for end-users. This way, sharing a report with end-users becomes much easier to manage.
Description/Use Cases:
We work with around 250 clients who would like to receive an SLA reporting on resolved tickets. Currently, this is achievable in the old Explore by creating a dashboard and setting a filter (using bookmark to set the data for a specific organization). However, in that scenario, you would need 250 copies of the same dashboard. A dashboard restriction based on the user's organization would resolve this issue.
Business impact of limitation or missing feature:
The manual process of generating and sending reports currently consumes a significant amount of time. When end-users can access and export these reports themselves in Explore, it will save several hours per month. Dashboard restrictions for end-users are, therefore, a major requirement for us.
Gepostet 31. Juli 2023 · Embrace Support
5
Follower
5
Stimmen
3
Kommentare
Embrace Support hat einen Kommentar hinterlassen
@... thanks for your reply! Luckily (for us) not every organization submits a ticket every month. In this case we cannot use the DCOUNT_VALUES(Organization name) metric.
I'll take a look into creating those custom metrics, but it feels a bit like a lot of work and prone for errors.
Kommentar anzeigen · Gepostet 25. Okt. 2021 · Embrace Support
0
Follower
1
Stimme
0
Kommentare
Embrace Support hat einen Post erstellt
Hi all,
I'm breaking my head how to get a report like this:
- Number of total organizations until and including a certain month
- Number of total tickets in that month.
So, for example:
in 2021 we've started with 90 organizations in Zendesk.
January 2021 we've added 10 new organizations, which brings the total organizations to 100. We've had also received 100 tickets, so the average tickets per organization for January is 1
In February 2021 we've added another 10 new organizations, which brings the total organizations to 110. We've received 95 tickets, so the average tickets per organization for February is 0.86
In march 2021 we've added 5 new organizations, which brings the total organizations to 115. We've received 105 tickets, so the average tickets per organization for February is 0.93
And so on.
With D_COUNT(Organisations) I can retrieve all organizations created in a certain month, but I'm having a hard time how to calculate this in relation to the total number of organizations. Any tips or advice would be appreciated
Any idea or suggestions on how to create such a report?
Gepostet 04. Okt. 2021 · Embrace Support
1
Follower
2
Stimmen
2
Kommentare
Embrace Support hat einen Kommentar hinterlassen
i've managed to solve this by keeping the Ticket-ID as a Row. Then i've added totals via Result Manipulation. This gives a correct calculation. This calculation is then used in a pie-chart.
Kommentar anzeigen · Gepostet 25. Mai 2021 · Embrace Support
0
Follower
0
Stimmen
0
Kommentare
Embrace Support hat einen Kommentar hinterlassen
Andrei,
Yes, sure. It consists of 3 parts. What you see in te above example is this one
IF (SUM(Opgelost binnen SLA) = 1) THEN 1 ELSE NULL ENDIF
Where "Opgelost binnen SLA" is calculated by a switch:
SWITCH ([Ticketprioriteit]) {
CASE "Urgent": IF (SUM(Netto oplostijd binnen werktijden) < 4) THEN
1
ELSE
0
ENDIF
CASE "High": IF (SUM(Netto oplostijd binnen werktijden) < 12) THEN
1
ELSE
0
ENDIF
CASE "Normal": IF (SUM(Netto oplostijd binnen werktijden) < 40) THEN
1
ELSE
0
ENDIF
CASE "Low": IF (SUM(Netto oplostijd binnen werktijden) < 160) THEN
1
ELSE
0
ENDIF
}
This switch uses another custom metric "Netto oplostijd binnen werktijden" which is a calculation of default metrics:
SUM(Full resolution time - Business hours (hrs)) -
        SUM(Agent wait time - Business hours (hrs)) -
        SUM(On-hold time - Business hours (hrs)) -
        SUM(First reply time - Business hours (hrs))
Kommentar anzeigen · Gepostet 24. Mai 2021 · Embrace Support
0
Follower
0
Stimmen
0
Kommentare
Embrace Support hat einen Post erstellt
Hi! I'm using a simple calculation which returns a 1 if true, and a 0 if false. Calculation is correct when using Ticket-ID as a row. When I remove this row to get a single calculation, the results aren't as expected. So, the below image is correct.
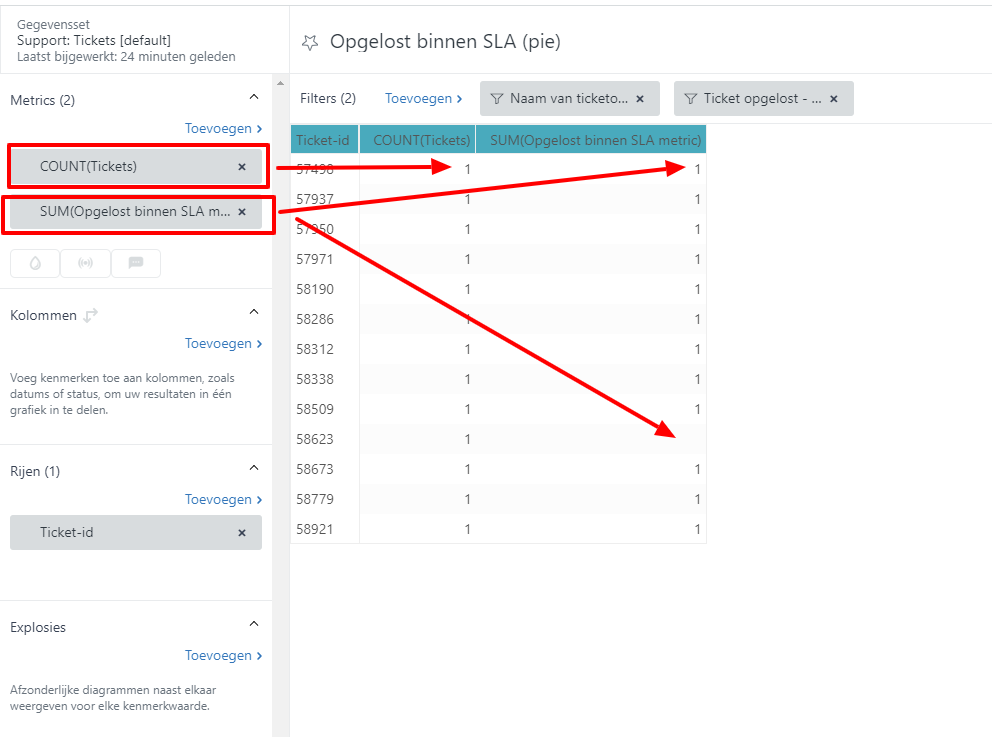
But, when I want to aggregate to one single row, I expect the second column to show 12 (I'm doing a SUM on that one), but in stead it shows 1.
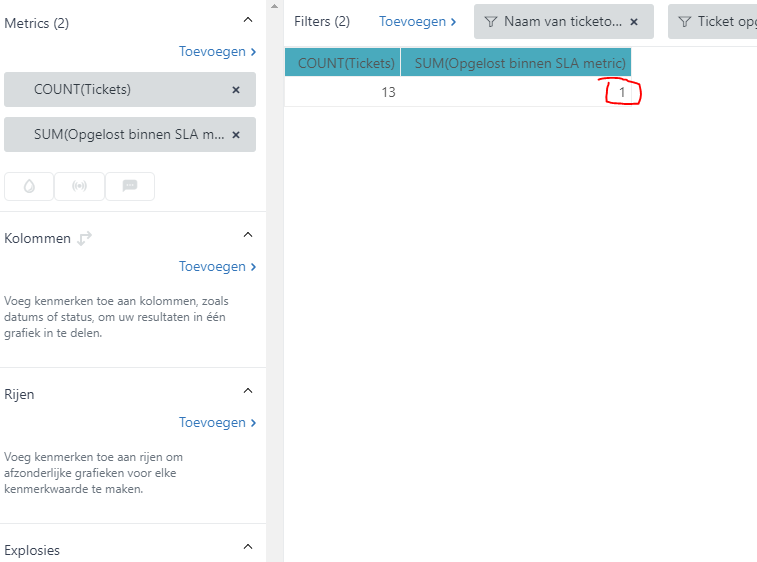
What am i'm missing here? I've did some testing with "compute separately" but that doesn't solve this..
Gepostet 24. Mai 2021 · Embrace Support
0
Follower
2
Stimmen
4
Kommentare