Summary: ◀▼
Use analyst copilot best practices to build relevant, reusable reports and dashboards. Start with prebuilt apps, organize projects and set access before sharing, and create focused datasets with clearly defined joins. Write prompts that specify metrics, dates, scope, and breakdowns; use memories to preserve shared definitions and findings. Tailor dashboards to their audiences and use interactive filters to explore trends.
Analyst copilot helps you explore data, save useful findings, and share insights with your team. The following best practices can help you set up your reports in ways that improve relevance, reuse, and collaboration.
Don't reinvent the wheel
Agentic analytics features prebuilt dashboards, reports, and datasets (collectively known as analytical apps) designed to get you the information you need as quickly as possible. Use these best practices in your analytics work:
- Start with prebuilt apps before building custom datasets, dashboards, or reports. Agentic analytics includes prebuilt projects for common support features. Each one comes with automatically installed datasets, dashboards, and reports designed for common service scenarios. This library of analytical apps will continue to expand over time. See what's available.
- Before you create a custom dataset or build a report from scratch, open a prebuilt app and explore it. This gives you a clear picture of what data is available and how the pieces connect, without the risk of missing something foundational. Once you understand the structure, clone any prebuilt content into your own project and customize it there. In order to clone content, fork your content and then save the cloned content. This creates a copy of the original element without altering the original.
Start with your project
Projects are where the reports, dashboards, and datasets you use for reporting are stored. Before you start creating your own reports, take some time to understand how projects work. Review these best practices to get started:
- Set up projects before you share anything. Projects are how you scope data, organize content, and control who sees what. Before sharing a dashboard or inviting teammates, take a few minutes to structure your projects intentionally.
- Organize your projects around how your teams actually work. Create separate
projects for Support, IT, HR, specific regions, or time-bound initiatives like a
product launch or QBR.
When a user asks a question within the project, Analyst Copilot surfaces the reports, dashboards, and memories they have access to, so the better you organize and name your assets, the more relevant the answers will be. A well-scoped "Support AMER" project or a "Q3 Launch" project will return more targeted results than a single catch-all project.
- Assign roles before distributing projects. Projects use three access roles:
- View: Users can see content but cannot make changes
- Edit: Users can modify reports and dashboards within the project
- Admin: Users have full control, including managing other users' access
Users need at least View access to a project to see data in any dashboard that lives in that project. If you share a dashboard before setting access, viewers will see errors instead of data. To avoid errors, make sure to give access before sharing.
Note: Viewers of a dashboard must have View access to every project the dashboard draws data from, not just the project the dashboard lives in.
Custom reporting
- When you need to go beyond prebuilt content, dataset builder lets you join
tables and shape a data model that reflects how your service operation
actually runs. Practices that make the process faster and more reliable
include:
- Select only the columns that are relevant to your analysis goal. A focused dataset runs faster reports and gives Analyst Copilot a cleaner signal when surfacing trends and comparisons. If you find yourself including fields "just in case," create a second dataset for that use case instead.
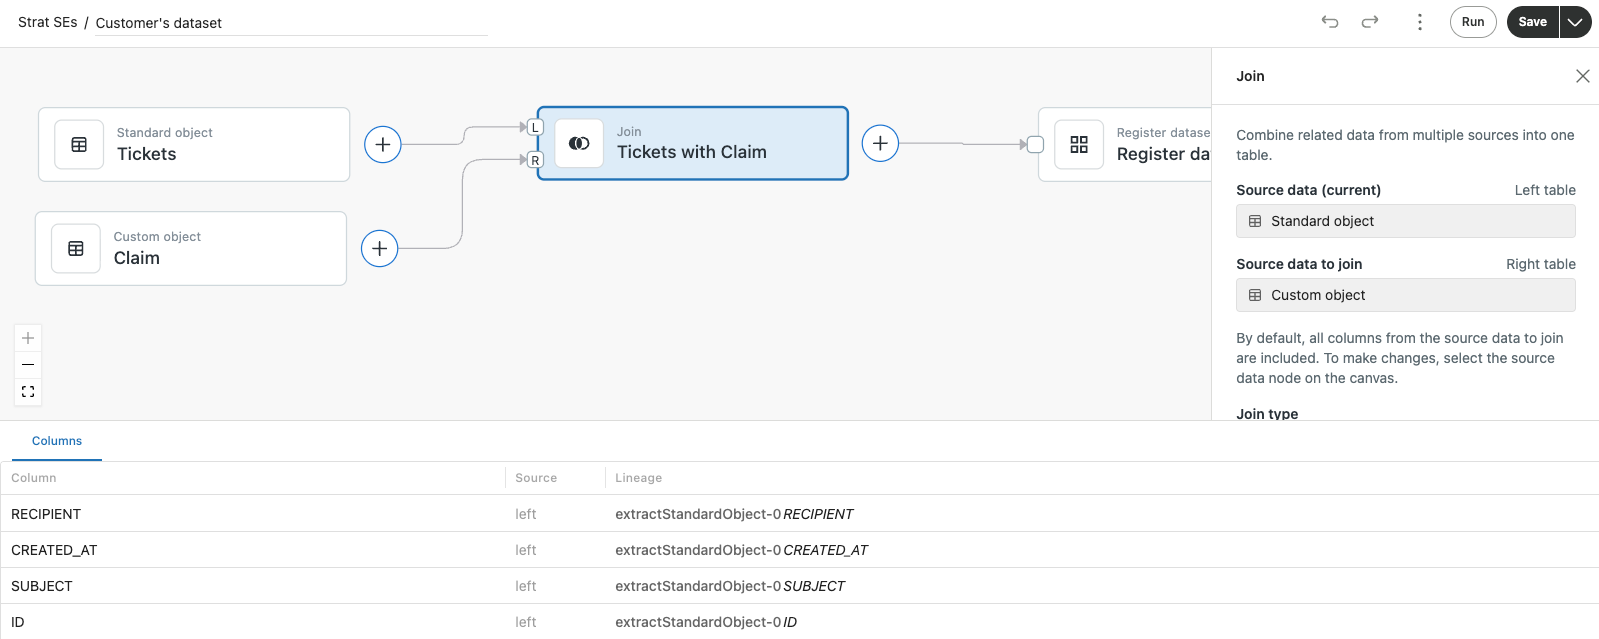
- When joining tables (for example, tickets and a returns custom object), be explicit about the relationship you are modeling. Poorly defined joins can produce inflated row counts or misleading aggregates that are hard to catch later.
Other best practices for building reports include:
- Build and iterate on reports. Use drag-and-drop to add fields, adjust filters, and change visualization types. Save versions frequently.
- Use memories to combine previous analyses, narrate business stories, and build dashboards that give holistic views to different stakeholder groups.
- Enhance dashboards with narrative text, images, and links, use filters and cross filters for interactive exploration, and tailor presentation for your audience.
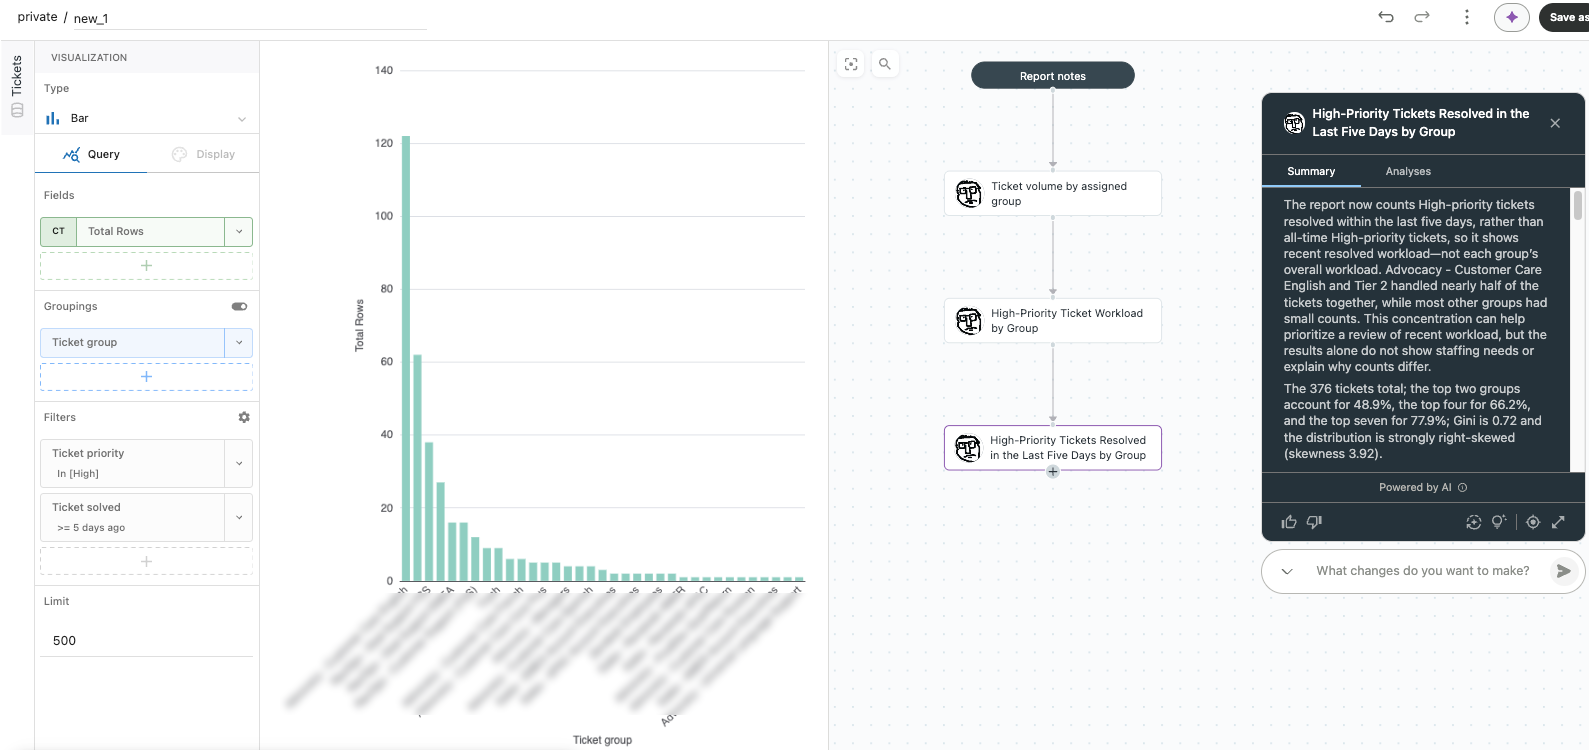
See Creating analyst copilot reports using report builder and Working with analyst copilot datasets.
Tips for effective prompting
The best prompts state what you want to measure, the time period, and how you want the results broken down. Here are some tips for more effective prompting:
- Name the metric: Say “Count solved tickets” rather than “Show team performance.”
- Specify dates: Use “last calendar month” or exact dates to avoid ambiguity.
- Define the scope: Include the groups, brands, channels, or ticket statuses you want.
- Choose a breakdown: Ask for results “by channel,” “by assignee,” or “by week.”
- Explain business terms: If “backlog” means tickets that are neither solved nor closed, say so.
- Request a useful format: For example, “Show a bar chart, highest to lowest.”
- Build on the answer: Start with one question, then ask for comparisons or a closer look.
- Check the interpretation: Check which data, filters, and calculation were used before relying on the result.
For example, "Show the number of solved tickets for the documentation group last calendar month, broken down by assignee. Display a bar chart sorted from highest to lowest".
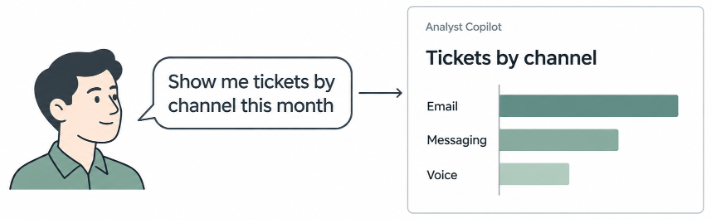
Then, you could follow up with "Compare those results with the previous month and highlight the largest changes."
When an investigation produces useful context, save it as a memory so you can build on it or reuse it later.
See Using natural language prompts to create reports in analyst copilot.
Viewing and creating dashboards
Dashboards are the primary means of arranging and sharing your reports. Use these best practices to help you get the most from dashboards:
- Organize dashboards around your audience. Group related reports on the same tab. Use separate tabs or dashboards for different audiences (for example, agents, supervisors, or leadership) rather than putting everything on one page.
- Use interactive features to find root causes, not just to display data.
Dashboard cross-filtering, drill-downs, and brush selection are designed for
exploration. When you click a data point to filter the entire dashboard, or use
brush selection to isolate a date range, that context carries into any deeper
analysis you run. Use these interactions to move from seeing what happened to
understanding why.
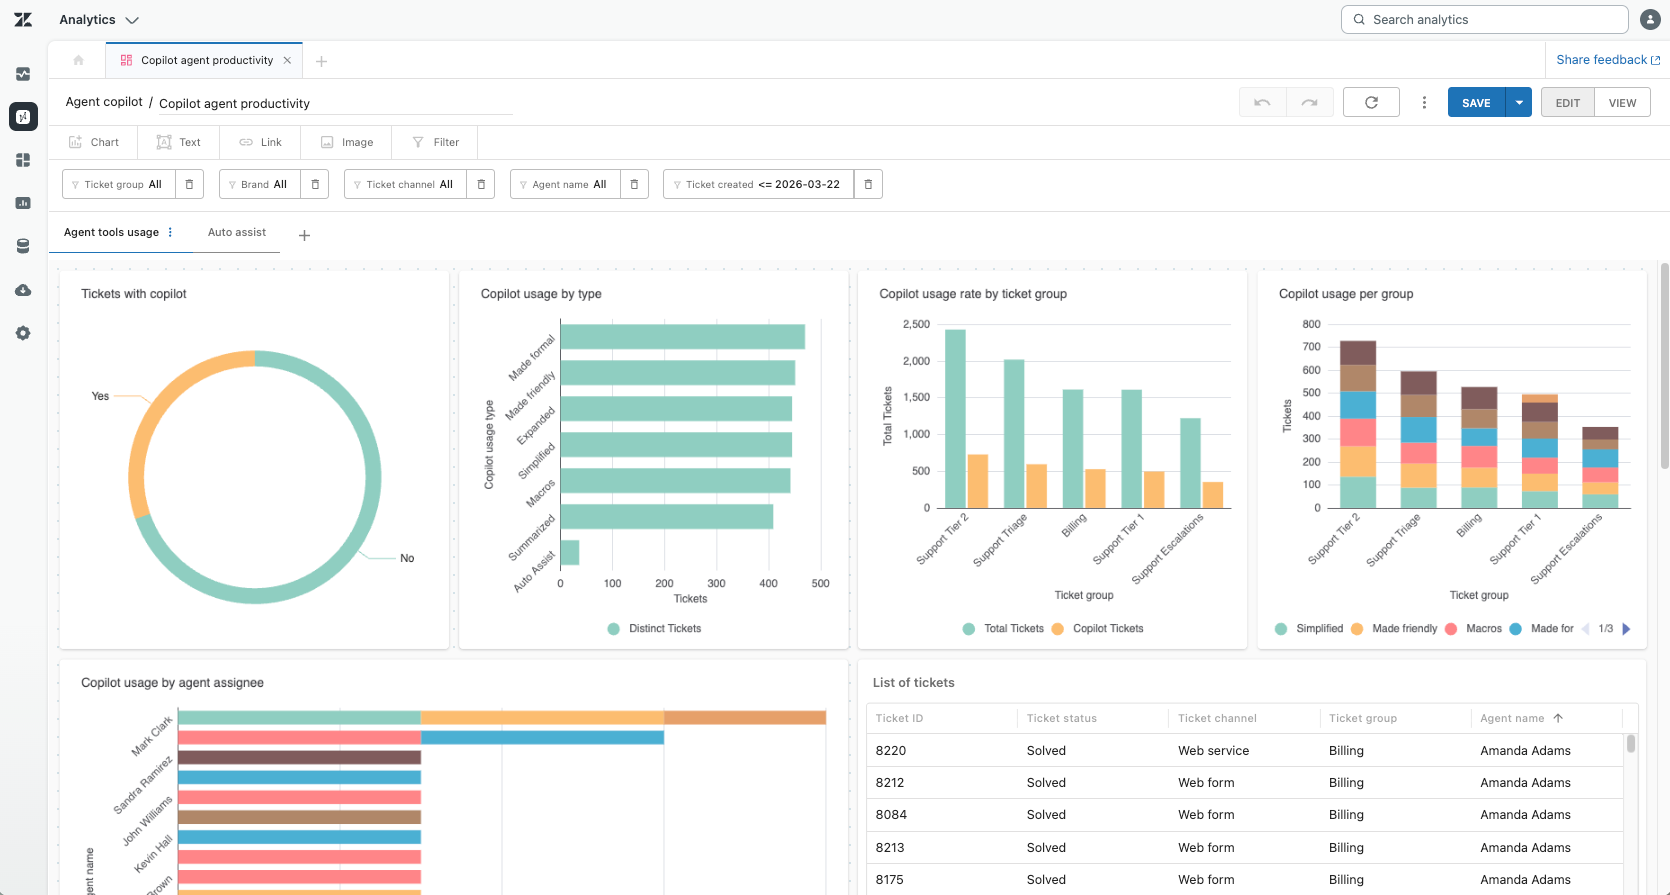 Note: If your dashboard references reports from multiple projects, every viewer needs at least View access to each of those projects. Check project permissions before sharing.
Getting the most from memories
Analyst copilot saves every logical step, business rule, or key term you use as a memory. This makes future reporting much faster and more reliable because everyone uses the same definitions and logic. Best practices for memories include:
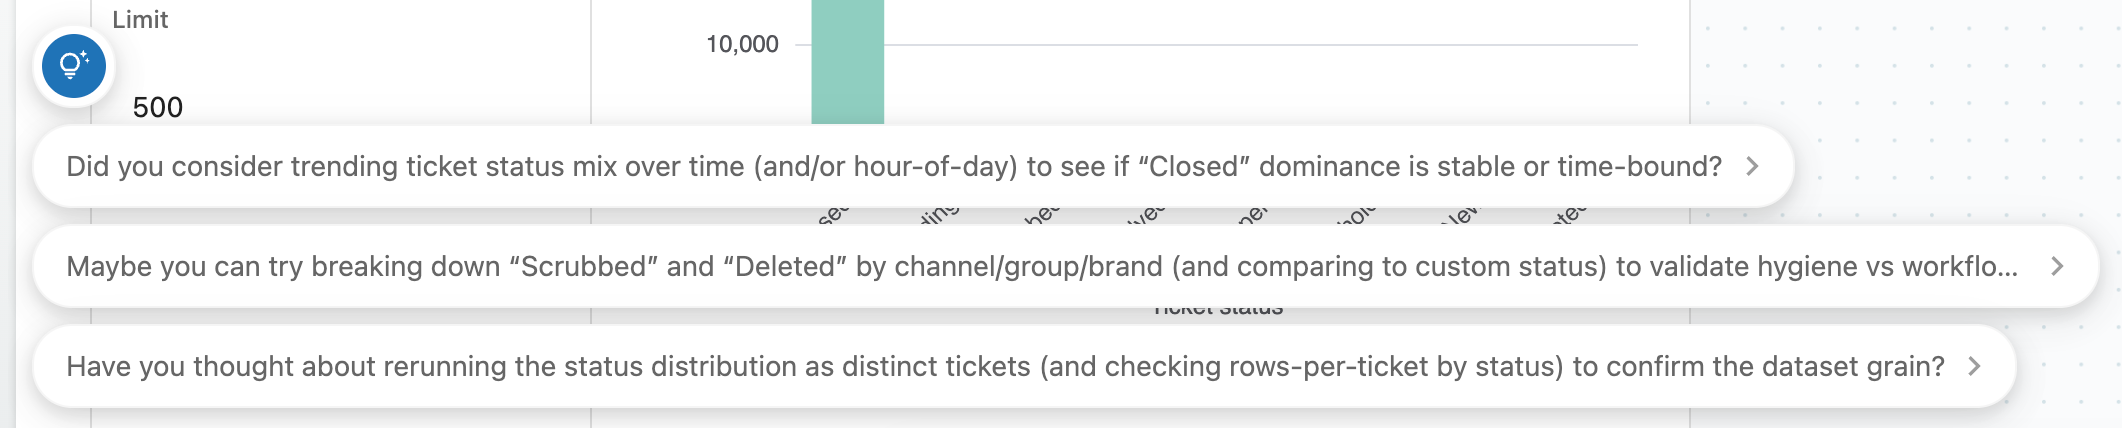
- Read memory summaries before drawing conclusions from the raw chart. A spike that looks alarming may be within normal variation; a small but consistent shift may be the more important signal.
- When you reach a report result worth keeping, save your report before moving on. This will preserve the report as a memory that will be surfaced as a suggested starting point for future analyses.
- Rate memories to help agentic analytics learn which memories are most relevant
for your organization. Over time, this shapes which suggestions appear
first.
- Save key metric definitions (how your team calculates resolution time, what counts as a reopen, and so on) as memories. This ensures that every analysis, report, and stakeholder conversation references the same numbers.
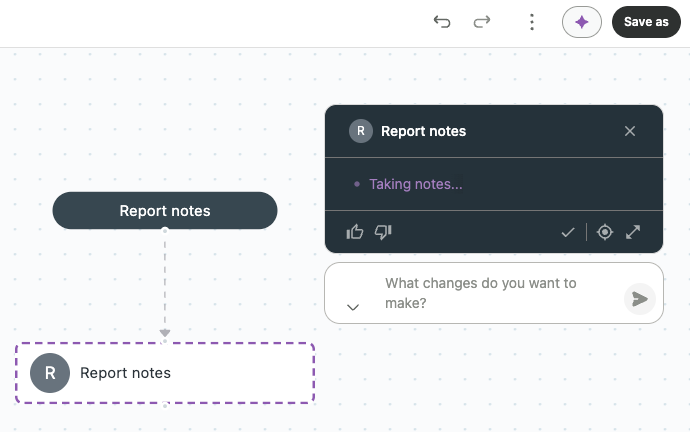
- When you have the reports and memories that tell your story, select them and click Narrate. Analyst copilot generates a plain-language summary of your findings that you can share with managers or leadership.
Creating datasets
Agentic analytics features several prebuilt datasets to cover many common business reporting needs. However, there might be occasions when you need to create a custom dataset containing information from multiple datasets. Best practices include:
- Select only the columns that are relevant to your analysis goal. A focused dataset runs reports more quickly and reduces errors when surfacing trends and comparisons. If you find yourself including fields "just in case," create a second dataset for that use case instead.
Article Q&A
Click to view
How do I organize analyst copilot projects and make sure teammates can view my dashboards?
Create separate, clearly named projects for teams, regions, or initiatives. Assign users View, Edit, or Admin access before sharing dashboards. Viewers need at least View access to every project the dashboard gets data from, not just the project containing the dashboard.
Should I start with a prebuilt dataset, and how can I build a custom one?
Explore the prebuilt Support, copilot, or ITAM apps before creating custom content. You can fork prebuilt content into your own project and customize the copy without changing the original. For custom datasets, define table joins carefully and include only fields relevant to your analysis.
How can I use analyst copilot to understand report results and find root causes?
Read the report’s memory summary to review significant trends and anomalies before drawing conclusions. Use cross-filtering, drill-downs, or brush selection to explore results; the selected context carries into deeper analysis. You can ask questions in plain language and follow suggested questions, or switch to manual report mode for advanced metrics and filters.
How do I save useful analysis so my team can reuse it?
Save a report when you find a result worth keeping; it becomes a memory and can be suggested as a starting point for future analyses. You can also save key metric definitions as memories to help keep definitions consistent across teams and sessions.
How can I share findings from reports and memories with managers or leadership?
Select the reports and memories you need, then click Narrate to generate a plain-language summary. To select multiple memories, hold Shift while selecting them. Rating memories also helps analyst copilot prioritize the memories most relevant to your organization.