The Backlog Evolution report is a standard report available in Zendesk Support. We include this report because it is a great way of seeing how you are handling your incoming ticket volume, which will allow you to allocate your resources more efficiently.
The simplest way to think of the backlog number is that it represents the number of unsolved tickets at the end of each day. There are two parts to the report, the graphical representation on top, and the numerical below.
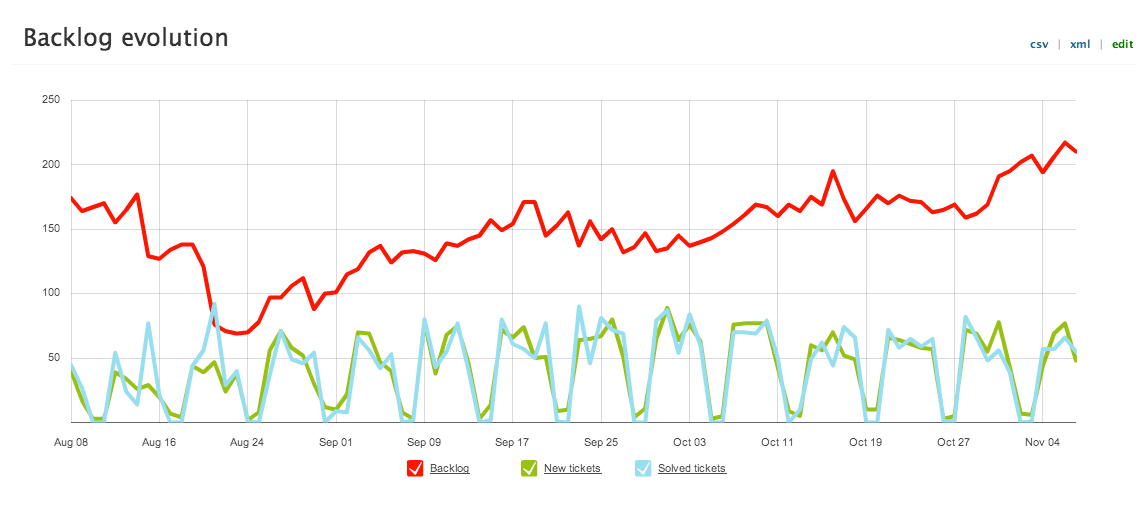
Graphical Representation
Let's make some sense of the sample below. The first thing to notice is the consistency of the New tickets and Solved tickets. This shows a pretty standard five day per week cycle where tickets do not get solved on the weekends, and there are very few new tickets on the weekends. The backlog is the red line along the top and it shows the trend in the number of unsolved tickets you have. Between Aug 16 and Aug 24, the red line dips to its lowest point, due to a huge spike in solved tickets while new tickets remained fairly steady. To see how it's calculated, you can take any given backlog number, add the new tickets from the next date, and subtract the solved tickets from the next date (there's an example of that calculation below).
The Numerical Report
The bottom section of the report contains the numbers that correspond to the graph above. This allows us to see the exact calculations, as well as retrieving specific numbers for any given day on the report.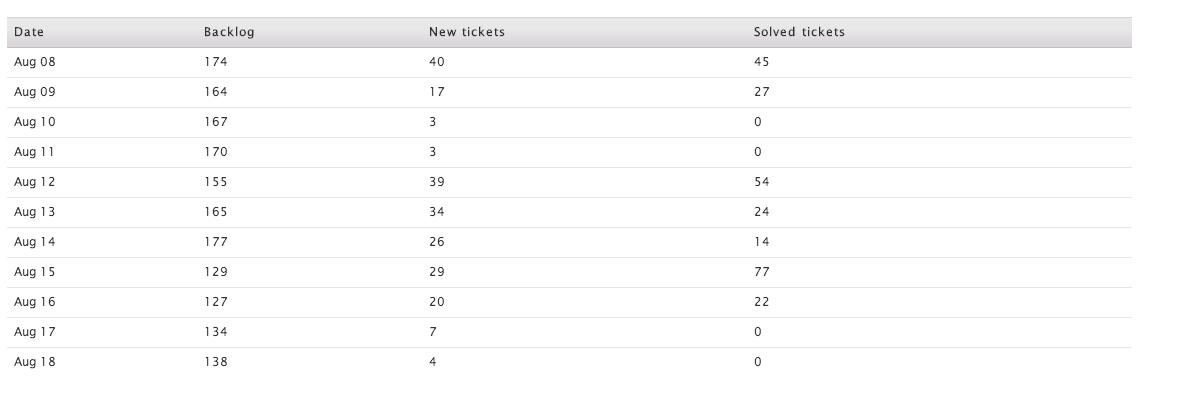
Let's take a look at a specific range of days from the example above.
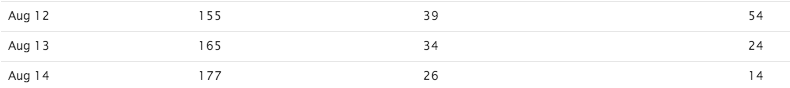

We'll take the backlog at the end of the 12th (155) add the new tickets from the 13th (34) and subtract the solved tickets from the 13th (24).
155 + 34 - 24 = 165
This gives us the backlog on the 13th. To calculate the backlog at the end of the 14th we do the same process.
165 + 26 - 14 = 177
What does Backlog Evolution tell me?
The best way to look at backlog evolution is to analyze the trend. If the red line is trending upwards, it means that your current resource allocation is not sufficiently getting through all of your incoming requests. This could mean you need more agents or a workflow adjustment to get through more tickets with the agents you already have. If the backlog is trending downwards, it means that your agents are consistently solving more tickets than come in each day and that your backlog should eventually fall to low levels.
Why do the numbers change?
To generate these reports, Zendesk Support checks the current status of all your tickets. This means that if you generate your report on Monday and a solved ticket is re-opened and solved again Wednesday, the report you generate that Friday will have different numbers because the date of the solve is considered to be the latest solve date for the ticket. This will change your backlog and your solved tickets. Your new tickets for a given date will never change unless you delete them.