The Reporting Overview gives you insight into how Zendesk Support is performing. It provides data about your ticket volume and management. It also enables you to compare key ticket metrics within Zendesk Support, and with your peers.
The Reporting Overview is not updated in real time. Except for Satisfaction data, which is updated daily, the data in the Reporting Overview is updated hourly. The Reporting Overview displays data in the timezone settings configured in the user's profile.
This article includes the following topics:
Accessing the Reporting Overview tab
The Reporting overview contains three sections for comparing key ticket metrics; viewing ticket metrics by channel, benchmark, and first reply; and viewing top articles, searches, and agents.
- Click the Reporting icon (
) in the sidebar.
The Reporting Overview opens by default.
- Select a Reporting period at the top.
You can select a predefined period or select Custom to set a specific range up to three months.
The custom date range is inclusive of both dates selected. The dates selected will include dates that are greater than or equal to the start date selected and less than or equal to the end date selected.
- Analyze the data that appears in the Overview tab.
For more information, refer to the sections below:
Comparing key ticket metrics
The top of the Reporting Overview contains options for viewing ticket metrics.

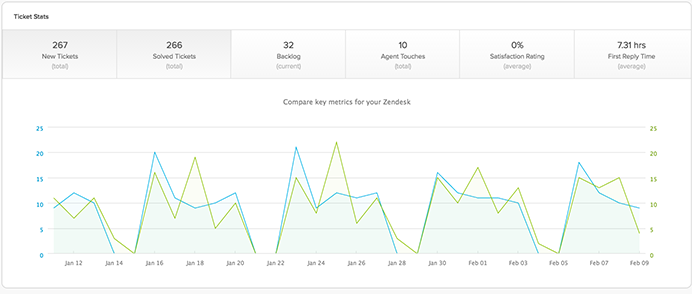
- New Tickets is the number of new tickets created during the reporting period.
- Solved Tickets is the number of solved tickets during the reporting period.
- Backlog is the total number of unsolved tickets in Zendesk Support at the present time.
- Agent Touches is number of agent updates to tickets during the reporting period.
- Satisfaction Rating is the average customer satisfaction rating given during the reporting period.
- First Reply Time is the average amount of time it took an agent to make the first public comment in a ticket (in calendar hours).
When you click one of the ticket stat options, you see a detailed graph that includes daily totals for each day of the reporting period. You can change the reporting period for any of the ticket stats. And you can view one ticket stat at a time or you can choose to compare two ticket stats.
- Click the Reporting icon (
) in the sidebar.
- Select a Reporting period at the top.
You can chose a predefined period or chose Custom to set a specific range up to three months.
The custom date range is inclusive of both dates selected. The dates selected will include dates that are greater than or equal to the start date selected and less than or equal to the end date selected.
- Click one of the ticket stats at the top to view that data.
- If you want to compare two stats, click a second ticket stat.
- Hover your mouse over the graph to see daily totals.
Viewing more ticket metrics
The middle section of the Reporting Overview contains three panels for viewing additional ticket metrics.

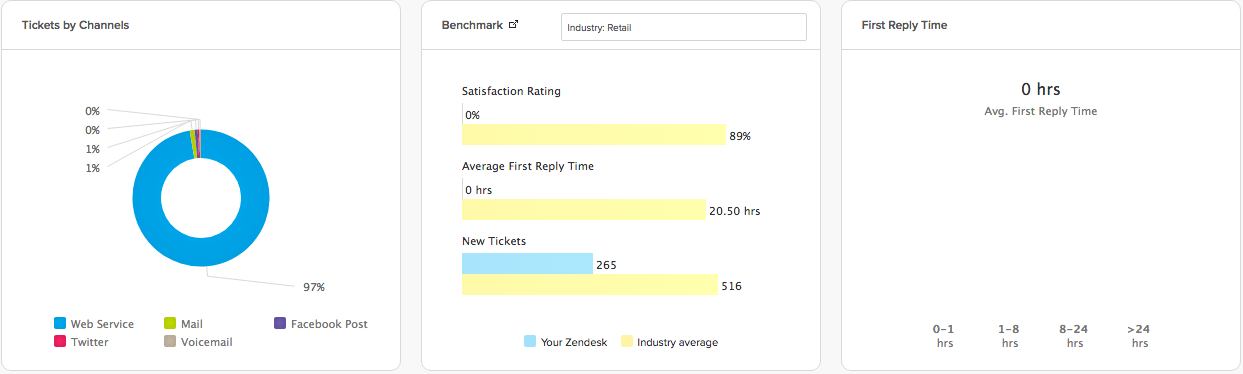
- Tickets by Channel shows the percentage of your tickets that come from each of your supported channels.
The graph shows a maximum of six channels. If you offer more than six support channels, you will see your five most used channels and a sixth category called Other that groups your remaining channels.
- Benchmark enables you to compare your key metrics to your peers. The benchmark shows your satisfaction rating, first reply time, and new ticket volume compared to your peers, by industry, company size, or target audience.
The benchmark is based on a 28-day rolling window of performance benchmarks for you to compare yourself against. The benchmark is calculated by first finding the mean (or average) for each individual Zendesk account, then taking the median over all accounts as the benchmark. By this definition, 50% of the accounts in the segment fall above that number, and 50% of the accounts in that segment fall below that number.
- First Reply Time shows the average amount of time it took an agent to make the first public comment after a ticket was created. The chart shows the distribution of tickets according to number of hours for first reply. This enables you to visualize the first reply time in a more robust way, rather than looking at an average, which might be skewed by outliers.
If an agent creates a ticket, it will not automatically be excluded from First Reply Time on the native overview. The first reply time for an agent-created ticket will not be calculated until any agent's next public reply.
The graph includes a breakdown by hours, showing what percentage of tickets were responded to within a specific number of hours (0-1, 1-8, 8-24, or >24). Tickets that do not have a public comment are not included. For example, if a ticket is closed without a public comment, it does not have a first response time, and is not included in the First Reply Time calculation.
Note: This metric is based off calendar hours, not any business hours or schedules you might have set.
To view your tickets by channel, benchmark, or first reply
- Click the Reporting icon (
) in the sidebar.
The Reporting Overview opens by default.
- Select a Reporting period at the top.
You can choose a predefined period or chose Custom to set a specific range up to three months.
The custom date range is inclusive of both dates selected. The dates selected will include dates that are greater than or equal to the start date selected and less than or equal to the end date selected.
- Refer to the appropriate reporting panel in the middle section of the overview: Tickets by Channels, Benchmark, or First Reply Time
Note: If the Benchmark report does not display data, you need to complete a brief survey to opt-in to the benchmark. To do so, click the Admin icon (
) in the sidebar, then select Settings > Benchmark survey. It might take some time for your Benchmark report to update.
You can also watch this short video about how to complete the benchmark survey for your Zendesk.
Viewing top content, searches, and agents
The bottom section of the Reporting Overview contains three panels for viewing data about your Help Center content, end-user searches, and agent performance.

- Help Center content shows your top articles or posts according to the number of views, votes, or comments during the reporting period. You can filter for knowledge base content or community content.
- Top Searches shows end-user search data during the reporting period, including top search strings used in your Help Center, searches that resulted in a user creating a ticket, and searches that did not return an article or a community post.
- Top Agents shows your top agents according to number of tickets solved, customer satisfaction ratings, and number of ticket updates during the reporting period.
- Click the Reporting icon (
) in the sidebar.
The Reporting Overview opens by default.
- Select a Reporting period at the top.
You can chose a predefined period or chose Custom to set a specific range up to three months.
The custom date range is inclusive of both dates selected. The dates selected will include dates that are greater than or equal to the start date selected and less than or equal to the end date selected.
- Refer to the reporting panels at the bottom of the Overview: Top Articles, Top Searches, or Top Agents.
- Click any of the tabs in the panels to change the data.
- (Support Professional and Enterprise only) Click See all at the bottom of the panel to expand the data.
Clicking See all opens the Knowledge Base, Community, or Search Reporting tab, depending on your selection. For more information on Help Center reporting, see Analyzing Help Center knowledge base and community activity and Analyzing Help Center search results.
87 Comments
Thanks @Travis Rider. Much appreciated.
Hi,
Is it possible to generate and download CSV report based on tickets tags in a week period? We want to know which problems are the most common among the customers we have.
Hello!
@VickyPo
If you are interested in reporting on the number of tags generated within a week period, you certainly can! It will require custom reports, which itself requires Professional or Enterprise Support.
I would recommend to start by reviewing our documentation on Reporting on Ticket Tags.
Once you get that set up as per our documentation, you will be able to create a fairly straightforward on the # of Tickets, with your Tags in the How Column. Some more explicit documentation on this can be found in our help center as well, right here: Reporting on Created and Solved Tickets
I hope these two documents, in tandem, help you get a report built!
As for generating a CSV of this particular report, you can do so from the Report UI. When viewing a report within Insights you will see an orange 'export' button near the bottom right of the report. You can click this and select the CSV file extension. This link will contain some screenshots to review: Sharing Reports in Insights
Thanks!
For the Search reporting, does it only track searches made by end users, or does it count searches made by logged in agents/managers/admins as well?
Hey Kelly,
The native search reporting will include both agent and end-user searches. If you want to exclude agent searches you'll most likely need to set up Google Analytics on your account as mentioned here: Enabling Google Analytics for your Help Center
Hope this helps!
If a user starts submitting a request, writes something into the "Subject" field, sees relevant Help Center articles and clicks one of the results, thereby solving his problem - where can I as an administrator see how often this happens and with which subjects?
Hello, does anyone know if there is a way to see first-time reply metrics based on my business hours and schedules we have set??
Because under the section titled "Viewing More Ticket Metrics" it states "Note; the metric is based off calendar hours, not any business hours or schedules you might have set."
I want to know what the true and accurate first-time response is based on when we're open. PLEASE HELP
Hey Nik,
The Reporting Overview will not take into account your business hours you've set up in Support. If you're looking to track first reply time in business hours, you'll need to use Insights or Explore to generate this report.
Both will have a First Reply Time metric available that will take into account the business hours you've configured.
Hope this helps!
Hi
Just curious is this overview Report still available, as I cannot see it...
The same goes for our company, we use Professional plan and have NO access to Reports. What can we do?
Celso Rodrigo Patricio Beck
This data can be analysed in Explore now. Here is the related article: https://support.zendesk.com/hc/en-us/articles/360002089888
Eugene Orman, thanks but it still doesnt work for me and my team. I receive this error message. Client https://moveniumsweden.zendesk.com/

Patricio Beck, Like any other product (Talk, Chat) you need to activate Explore under the user profile - https://support.zendesk.com/hc/en-us/articles/360034749053
Is there a way to see which tickets were created following a KB search? I see the total number of tickets in the dashboard, but no way to click through to review them. Thanks!
Hi Cayla,
The reporting overview doesn't have a feature to drill into to those tickets specifically. If you're looking for more in-depth information you may want to consider a tool like Pendo that is designed to pull more detailed analytics about individual tickets.
Hi, I use Support professional and explore professional, but I cannot find the pages you showed. Are you sure the interface is still available now? I think it is old version? For Explore now, there is no such interfaces.
Hey Bo_zhang,
I see this if your first community post so I wanted to say welcome! To answer your question, you should be able to see this tab after selecting the reporting icon on the left side of your Support interface. If you don't see this, can you provide a screenshot of what you do see?
Thanks!
Hi Brett,
Thanks for your response.
Please check the screenshot below,
Where can I find the interface you displayed?
Thanks.
Hi Brett,
Any feedback?
Thanks.
Hi Bo,
It looks like you are set up with Explore, and therefore the Overview, Leaderboard, and Satisfaction tabs are removed from the pre-built dashboards. You can use Explore to access pre-built dashboards containing this information. See Getting started with pre-built dashboards.
Those interfaces are being deprecated as we are nearing the EOL for Insights and shifting everyone over to using Explore for all reporting. Going forward, you'll want to use the pre-built dashboards in Explore.
Zendesk,
Guys. The whole dashboard reporting section is gone. All you got left is the Knowledge base and Community and Search sections left:
Please create a dashboard where those previous values were present. A lot of our higher ups use this and don't want to navigate to explore to create dashboard or look at those dashboards there.
Please bring those back - whilst adding where the tab "Insights was" "Explore" so that you can add dashboards from Explore there, but keeping the remaining ones there. I inquired about this a while ago and was told on your community forums that those existing reports and dashboards would be replicated and left as is.
Thanks for looking into this.
Hi Bart,
Thanks for your feedback! As of today, we're not going to bring these reports back into the Reporting overview as we're in the final stage of replacing Insights with our native analytics tool Explore. In Zendesk Explore, you'll find the same statistics and even more data in the default Zendesk Support dashboard: https://support.zendesk.com/hc/en-us/articles/360022367893.
I understand that opening a separate product to view these reports may be inconvenient at first, but we're collecting feedback and reviewing your comments. Make sure to subscribe to this article to not miss any updates.
Thanks for your understanding!
That's a shame Greg,
Because I was under the impression that these would remain as mentioned 9 months ago here.
Hopefully, these kinds of changes are thought through as Zendesk develops other core parts. Many of your users have been bringing this up in other parts of the community. I can see why my CEO is looking to move to systems like HubSpot or others when replacing dashboards that they have used for so long suddenly become unavailable. Explore is wonderful and a pleasure to work with, but not being able to add those core Dashboards which they use as an overview of how the business is doing with volume is an oversight.
Thanks for taking this into consideration!
Hi Bart,
Thank you for your feedback. My apologies that the move from Insights and the legacy reporting tabs wasn't communicated well enough.
I think there was a bit of miscommunication on the community post you mentioned. There was no 1:1 replacement of the legacy dashboards. Instead, the legacy reporting dashboards were deactivated and Explore prebuilt dashboards become available that include these same stats + more new reports and filters.
We can not bring the legacy dashboards back but we can improve the prebuilt Support dashboard. Please let us know what you are missing in the Support dashboard and we will investigate if this can be introduced to this Explore dashboard.
Eugene Orman,
No need to apologize. We all knew explore was replacing Insights came 5th of Feb.
But it's unfortunate that these were not replaced 1:1. The reporting Icon to the left of Zendesk now feels barren.
I'd like to; as I'm sure many in the community would like to; see an option to populate this area with the standard zendesk support dashboard embedded there.
Have permission settings built to adjust who can view it by admin or agent. Allow for the options to add tabs to add more Dashboards to this section with dashboards you yourself build within additional tabs. Otherwise I feel like this whole section will get abandoned and fulfil no function :(
Please do not remove the last 3 tabs which aren't possible to see in explore yet.
Thanks for your consideration
Bart,
Thank you for sharing your thoughts about how making the Support Reporting section useful again. We are currently working on populating it with the prebuilt Explore dashboards. The next step will be to allow adding custom dashboards to this section, but it is not on the immediate roadmap.
You can spin-up a feature request in the Feedback on Explore section about this topic. It will help to see the community's interest and will allow us to prioritise this feature.
Done and done Eugene Orman
Please sign in to leave a comment.