Question
My query displays the week of the year, but I want to see the date that the week starts with instead. How can I do that?
Answer
To change the way attributes display, create a custom attribute.
To accomplish this
- In Query Builder, click the calculations icon (
) on the right sidebar.
- Click Standard calculated attribute. You will be redirected to the Formula editor.
- Paste the following custom attribute into Formula editor.
DATE_FORMAT(START_OF_WEEK_MONDAY([Ticket created - Date]),"YYYY-MM-dd")
- Click Save.
- Add the newly created attribute to the query.
You can replace START_OF_WEEK_MONDAY with START_OF_WEEK_SUNDAY or START_OF_WEEK_SATURDAY whichever you want your week to start in.
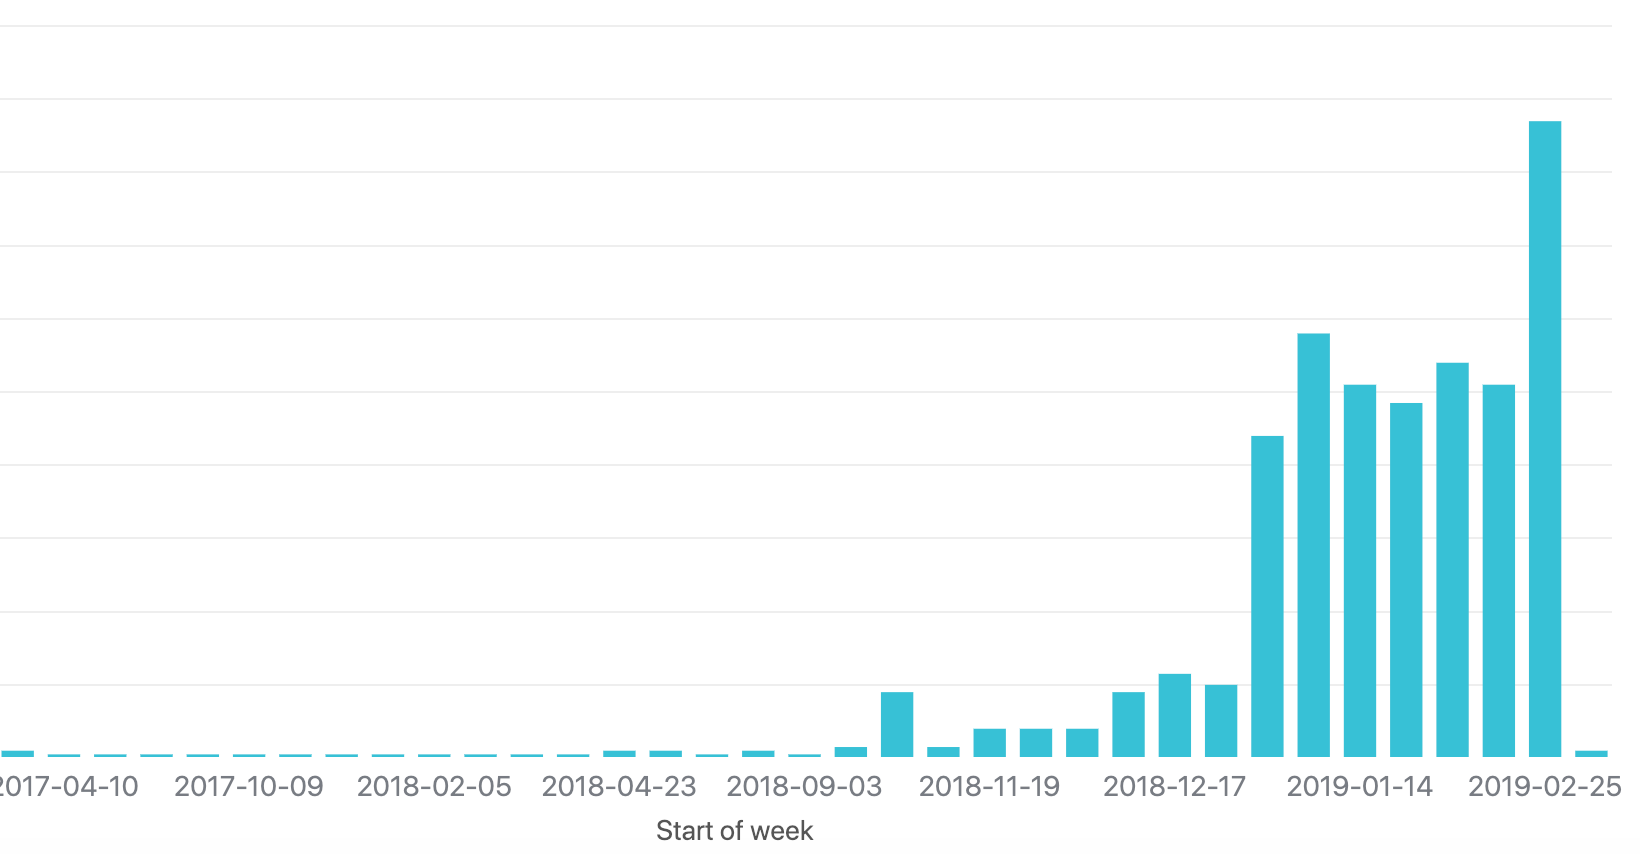
The calculations for the aggregator MED and AVG are skewed because they are calculated from the values for each day individually. This means seven data points (each for a day in the week), rather than from the values across all tickets throughout the week.
Warning: If your Explore account is not in English, copying and pasting this formula doesn’t work. For a workaround, follow the steps outlined in the article: How can I convert Explore formulas from English into another language?
40 Comments
I think your instructions meant to say click on "Standard calculated Attribute", not "standard calculated Metric", yes? However, it's not working for me. When I add it to a query, to replace "Ticket created - Week of year", I get an error.

Hello, Hillary,
Thanks for the heads-up. I have corrected the article. It is indeed Standard calculated attribute.
The formula was also updated to:
DATE_FORMAT(START_OF_WEEK_ISO([Ticket created - Date]),"YYYY-MM-dd ")
It is "Ticket created", not "Ticket Created".
Let me know if this helps!
Hi Ricardo,
Thank you for your reply. It doesn't look like the edit was saved correctly, as the article is still showing the errors mentioned.
When I try to apply this custom attribute to sort my results, the results themselves are affected, specifically % Satisfaction Score. This metric appears normally when sorted by Ticket created - Week of year, but if I replace it with Ticket created - Start of week the values are 6-7x their normal amount.
Why is this happening? I have toggled the Sort like time attribute box and tried various Computed from fields, none of which have changed my results.
Additionally, is it possible to select a date range for custom time attributes? It seems that I will always need a date filter along with a custom time attribute like this if I want to select a range/repeat pattern.
Thanks in advance for your help.
Attachments:
Hello, Scott,
Thanks a lot for the heads up. I have re-edited the article to display the right formula and the right text.
Regarding your issue, I was able to reproduce it in my test account. I will need to create a ticket to investigate further. You should have received an email in your inbox.
Hey Scott, looks like you're using SUM as your aggregator so what that is doing is aggregating the satisfaction scores from all seven days of the week and representing that sum on one day of the week. Perhaps you would want to use AVG instead of SUM. The week of year table configuration probably takes this into account because it is a default attribute so this may be why you should use a different aggregator in your custom calculated attribute.
Hi Samuel,

Thank you for your suggestion. However, SUM is the only available aggregator for the % Satisfaction Score metric.
If I try to create a different format - such at "dd MMM YY" it is displaying correctly but it is no longer sorting it according to the actual date, but first according to day (so the weeks starting on 1 July will be before the one starting on 3 May), and the same goes with other orders. How can I have a nicer looking format, but still have a logical sorting?
Added: I'm facing the same problem as Scott is and can indeed see that the limitation of the %Satisfaction Score being the SUM rather than the AVG is causing this.
Solution from Tier 2 Support to implement the AVG aggregator:

While SUM (% Satisfaction Score) will work harmoniously with Ticket created - Week of year (where weeks are displayed in week numbers), it will be skewed when Ticket created - Start of week (where weeks are displayed in start dates) is used, as observed in your screenshot.
This is caused by the SUM aggregator as it does not work well with custom formulas like
DATE_FORMAT(START_OF_WEEK_ISO([Ticket created - Date]),"YYYY-MM-dd ")
. And since SUM(% Satisfaction Score) is a default metric (and thus cannot be edited). We will need to create a new metric(essentially identical to % Satisfaction Score) and use the AVG aggregator instead:Note: we will also need to update the Display Format for the new metric to "%" for the percentages to appear properly
Thanks for sharing, Scott!
Hey,
I followed the instructions here and once I changed the chart type to bar graph the date format changed:
Any idea how I can fix it?
Thanks!
Hi Chen!
If you navigate to Chat Configuration -> Date Display Format you should be able to change the format of how the dates display on the axis.
Thank you!
the problem is that, using this custom attribute, I lose the capability to drillthrough a subset of data. It's pulling everything instead of just the clicked column.
Hey Michele, thanks for reaching out. This is valid feedback, but for the time being this is behaving as expected. I wish I had more productive feedback for you for the time being.
I would recommend making your voice heard on our Explore Product Feedback forums.
This is a great tip, thank you!
You can also add the end of the week to create a date range:
DATE_FORMAT(START_OF_WEEK_ISO([Ticket created - Date]),""MMM-dd - ") +
DATE_FORMAT(END_OF_WEEK_ISO([Ticket created - Date]),"MMM-dd ")
I modified your formula a bit so it will show Aug 26 - Sep 01
Hi,
I'm having trouble with this custom attribute - I've followed the instructions fully but the dates are all muddled up:
If I try to filter them it just shows me a bunch of random dates. How can I make it show the last 3 or 4 weeks?
I tried to look for the Chart Configuration > Date Display Format but it appears I don't have it.
Thanks!
Hey Lauren,
Any chance you could provide a screenshot of the attribute you created so we can take a look?
Thanks!
Hi,
This standard calculated attribute appears to work fine for me. I also need to do the same thing in the SLA dataset for the "SLA update - Week of year" attribute.
I used the same formula but substituted "SLA update - Week of year" for "Ticket created - date".
When resulting query changes from this format...
To this...
I'm not sure what went wrong. Advice please?
Jay, you need an attribute that is a date. SLA week of year is a number. Try SLA Update - Date.
Hillary, that worked. Thanks!
When I create a custom attribute like this I have been unable to find a way to allow using a date range rather than selecting the dates manually. Attached are the original Ticket created - Week of Year and my Ticket Created Week of Year (date)

Hello Kate,
Thank you for your post! Unfortunately this is expected behavior. It is not possible to select a floating date range for a custom metrics. The only option for those at this time is to select dates from the list as you indicated.
I hope that helps clarify! Please feel free to reach out at support@zendesk.com if you'd like to dig into more detail or discuss specific examples.
Thank you,
Elissa
Elissa | Customer Advocate | support@zendesk.com
Hello,
Referring to the earlier issue, is it possible to dynamically select weeks in the dashboard or the list of weeks to display has to be specified in the Query?
For instance, would I have to update the query each week to add a new week od data in it?
The best way would be to allow selecting a number of weeks to show and that it dynamically changes each week, showing only that number (adding the newest and removing the oldest from the list).
Hello Tomica,
While it is not possible to select a floating date range using the custom metric listed above, you can create a filter using the default ticket created date. Let us know if you have any issues creating this and we'll be happy to assist.
Best regards.
If you slice the query further by date to look at how this attribute aggregate the data, here's how the table looks like:
You'll notice that each week includes 8 days and that the data for Monday is split in two, into two separate weeks. With this attribute, you may be looking at an inaccurate representation of your weekly data.
Zendesk Support did a test on his own account with the Star of week custom attribute, and he was also able to replicate the behavior. He'll be reaching out to the Explore team about this, and I'll be updating you as soon as I hear back from him.
The above metric was working great for me. After last weeks update it now shows the Mondays tickets total, it used to show the weeks starting Monday:
DATE_FORMAT(START_OF_WEEK_MONDAY([Ticket created - Date]),"YYYY-MM-dd")
Not having a weekly dated attribute makes it very hard to report over time and week over week. How can I simply report on volume created by week, sorted chronologically, by date?
When inputting the timestamp to ensure it matches to the date format, you can see that it pulls tickets from the week after as part of the "same week"...
I'd like to echo Seth a bit here, with the most recent update we've had to transition over to an attribute that uses this:
DATE_FORMAT(START_OF_WEEK_MONDAY([Ticket created - Date]),"MM-dd-YYYY")
We had to deviate from the original article's format as START_OF_WEEK_ISO was displaying the start of the week as Sunday as opposed to Monday.

This newly updated attribute works just fine for ticket count and such, but it seems to interact strangely when paired with the full resolution time and first reply time:
It would seem that regardless of the aggregator used (median, max, average, etc) that the data displayed is the sum, not the selected aggregator. Does anyone have any insights on this? Is this just a case of custom attributes interacting strangely with preset metrics or is there something I'm missing?
Hello Seth Ganz,
I've opened up a ticket for you on your behalf so our experts can look into this issue. We suspect there might be some unwanted behavior taking place which needs to be troubleshot one on one. You should expect an email shortly followed by a reply from our specialist.
Best regards.
Please sign in to leave a comment.