

Explore features a prebuilt live dashboard that displays important information about your Zendesk products in real time, in one place. If you're on an Enterprise plan, this dashboard behaves like any other Explore dashboard in that you can share it, schedule it, or clone it to make your own customized version. If you're on a Professional plan, the dashboard is read-only

- Zendesk Support Professional or Enterprise
- Zendesk Talk Professional or Enterprise
- Zendesk Chat Professional or Enterprise
- Zendesk Suite plan (for messaging)
Additionally, the name of the live dashboard in the Dashboard library depends on whether you use live chat or messaging:
- Live data: Name of the live dashboard if you use neither live chat nor messaging. Includes the Support and Talk sections.
- Live data (including Chat): Name of the dashboard if you use live chat. Includes the Support, Talk, and Chat sections, but not the Messaging section.
- Live data (including Messaging): Name of the dashboard if you use messaging.
Includes the Support, Talk, and Messaging sections, but not the Chat section.Note: If you recently turned on messaging, you might not see this dashboard yet. See Why don’t I see the Live data (including Messaging) dashboard? for details.
If your account was created before November 3, 2021 and you migrated from chat to messaging, you’ll see both dashboards in the Dashboard library.
This article contains the following topics:
Accessing the live dashboard
To access the live dashboard
- In Explore, click the Dashboard icon (
 ) in the left sidebar.
 - From the list of dashboards, select the Live data dashboard.
If you use live chat, select Live data (including Chat). If you use messaging, select Live data (including Messaging). If you use both, select whichever option you want to view metrics for.
Support reports

The Support section of the real-time dashboard displays the following information:
- New tickets (30 min): The number of tickets that changed to New status in the last 30 minutes.
- Open tickets (30 min): The number of tickets that changed to an Open status in the last 30 minutes.
- Tickets created and solved per hour: (Non-live data) A chart showing the number of tickets created (column) and solved (line) each hour for the last 8 hours. This report is based on historical data that syncs once per hour. Depending on when you load the dashboard and when the sync occurs, you might not see data for the past hour. For details, see Data refresh intervals for Explore reporting.
- Agents online: The number of agents who are online and available to work tickets. If you're on an Enterprise plan, click this metric to drill into specific information about agent status and current tickets. For more information, see Seeing live agent status and activities.
- Agents offline: The number of agents who are offline and unavailable to work tickets. If you're on an Enterprise plan, click this metric to drill into specific information about agent status. For more information, see Seeing live agent status and activities.
- Solved tickets (30 min): The number of tickets that changed to a Solved status in the last 30 minutes.
- Satisfaction (today): The percentage of customers who rated a ticket as "Good" today. The number below the satisfaction percentage indicates the change in satisfaction since yesterday. A negative result indicates a drop in customer satisfaction which you might need to investigate.
You can filter the reports in the Support section by Ticket group or Ticket brand. You can select up to five attribute values for each filter.

Talk reports

The Talk section of the real-time dashboard displays the following information:
- Calls in queue: The number of calls in the queue.
- Ongoing calls: The number of currently connected calls.
- Calls started and completed per hour: (Non-live data) A chart showing the number of calls started (column) and completed (line) each hour for the last 8 hours. This report is based on historical data that syncs once per hour. Depending on when you load the dashboard and when the sync occurs, you might not see data for the past hour. For details, see Data refresh intervals for Explore reporting.
- Agents online: The number of agents who are online and available to take calls. This includes agents who are in a wrap-up state from a previous call. If you're on an Enterprise plan, click this metric to drill into specific information about agent status. For more information, see Seeing live agent status and activities.
- Agents offline: The number of agents who are offline and unavailable to take calls. If you're on an Enterprise plan, click this metric to drill into specific information about agent status. For more information, see Seeing live agent status and activities.
- Average wait time: The average time customers wait for their call to be answered.
- Longest wait time: The maximum time a customer waited for their call to be answered.
The wait time metrics are refreshed each time a new call is answered.
You can filter the reports in the Talk section by Call group. You can select up to five attribute values for each filter.
Messaging reports
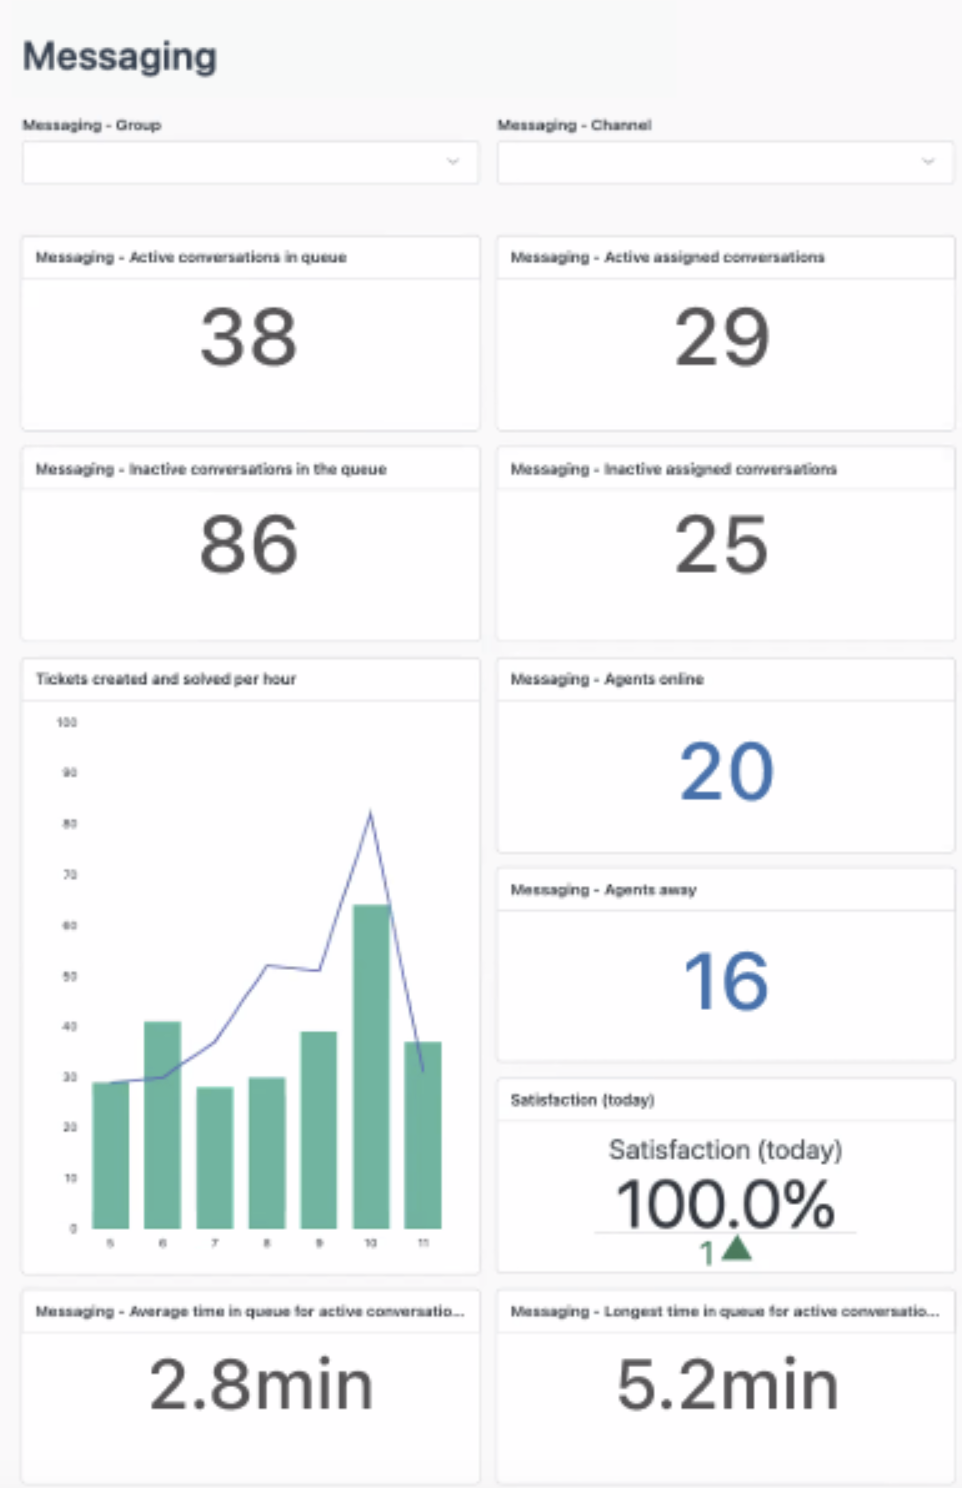
The Messaging section of the real-time dashboard displays the following information:
- Active conversations in queue: The number of active conversations that have not yet been answered by an agent.
- Active assigned conversations: The number of conversations being addressed by an agent.
- Inactive conversations in the queue: Unassigned conversations without a reply from the end user for 10 minutes.
- Inactive assigned conversations: Assigned conversations without a reply
from the end user for 10 minutes.Note: There are differences in how we count towards Inactive conversations for customers participating in the Conversation Inactivity Timer beta. Learn more in Live data widgets for Explore dashboards.
- Agents online: The number of agents who are online and available to work on conversations. If you're on an Enterprise plan, click this metric to drill into specific information about agent status and current chats. For more information, see Seeing live agent status and activities.
- Agents away: The number of agents who are away and not available to work on conversations. If you're on an Enterprise plan, click this metric to drill into specific information about agent status. For more information, see Seeing live agent status and activities.
- Satisfaction (today): The percentage of customers who rated a conversation as "Good" in the last 30 minutes. The number below the satisfaction percentage indicates the change in satisfaction since the previous 30 minutes. A negative result indicates a drop in customer satisfaction which you might need to investigate.
- Average time in queue for active conversations for active conversations: The average time customers wait for their conversation request to be answered by an agent.
- Longest time in queue: The maximum time a customer waited for their chat request to be answered by an agent.
- Tickets created and solved per hour: (Non-live data) A chart showing the number of conversations started (column) and completed (line) each hour for the last 8 hours. This report is based on historical data that syncs once per hour. Depending on when you load the dashboard and when the sync occurs, you might not see data for the past hour. For details, see Data refresh intervals for Explore reporting.
The wait time metrics are refreshed each time a new conversation request is answered.
You can filter the reports in the Messaging section by Group or Channel. You can select up to five attribute values for each filter.
When you activate a new social channel, refresh your browser to ensure that new tickets created from that channel are reflected on the dashboard.
If there has been no activity in any channel for seven days, channel values no longer appear in the filter drop-down. When tickets are created from any channel again, refresh your browser to see the channel values in the filter drop-down.
Chat reports

The Chat section of the real-time dashboard displays the following information:
- Active chats: The number of currently connected chats.
- Chats in queue: The number of chats in the queue.
- Chats started and completed per hour: (Non-live data) A chart showing the number of chats started (column) and completed (line) each hour for the last 8 hours. This report is based on historical data that syncs once per hour. Depending on when you load the dashboard and when the sync occurs, you might not see data for the past hour. For details, see Data refresh intervals for Explore reporting.
- Agents online: The number of agents who are online and available to chat. If you're on an Enterprise plan, click this metric to drill into specific information about agent status and current chats. For more information, see Seeing live agent status and activities.
- Agents away: The number of agents who are away and not available to chat. If you're on an Enterprise plan, click this metric to drill into specific information about agent status. For more information, see Seeing live agent status and activities.
- Satisfaction (30 min): The percentage of customers who rated a chat as "Good" in the last 30 minutes. The number below the satisfaction percentage indicates the change in satisfaction since the previous 30 minutes. A negative result indicates a drop in customer satisfaction which you might need to investigate.
- Average wait time: The average time customers wait for their chat request to be answered.
- Longest reply time: The maximum time a customer waited for their chat request to be answered.
The wait time metrics are refreshed each time a new chat request is answered.
You can filter the reports in the Chat section by Department. You can select up to five attribute values for each filter.