

This recipe demonstrates you how can use dashboard filters to quickly change configurations on dashboard reports. You can then save different configurations as bookmarks. Bookmarks enable dashboard viewers to switch between different dashboard configurations with a single click.
In this example, you'll set up a number of reports that track ticket updates and comments over the past year. You'll add these to a dashboard and then create a change attribute filter that enables viewers to change the time period looked at between years, months, and days. Finally, you'll create bookmarks that let the viewer switch between these time measurements with a single click.
This article contains the following topics:
What you'll need
Skill level: Advanced
Time required: 30 minutes
- Zendesk Explore Professional or Enterprise
- Editor or Admin permissions (see Giving agents access to Explore)
- Ticket and agent data in Zendesk Support
Creating the reports
In this first section, you'll create the following reports and add them to a new dashboard:
For all reports
For each report you create, use this procedure to get started:
To create the report
- In Zendesk Explore, click the reports (
 ) icon.
 - In the Reports library, click New report.
- On the Select a dataset page, click Support > Support - Updates history, and then click Start report.
The report builder opens. Continue working through each procedure in turn.
Report 1 - Tickets created
In this first report, you'll create a column chart that displays the number of tickets created by month and year.
To create the report
- In the Metrics panel, click Add.
- From the list of metrics, choose Tickets > Tickets created, then click Apply.
- In the Columns panel, click Add.
- From the list of attributes, choose Time - Ticket update > Update - year and Time - Ticket update > Update - Month, then click Apply.
- From the Visualization type menu (
 ), choose Column.
 - Click Save, and then click Add to dashboard

- On the Save new report to page, select a new dashboard and give your dashboard a name, for example, Bookmarks dashboard.
- When you are finished, click Save.
Report 2 - Tickets solved
In this report, you'll create another column chart. This chart displays the number of tickets solved by month and year.
To create the report
- Create a new report using the first procedure above.
- In the Metrics panel, click Add.
- From the list of metrics, choose Tickets > Tickets solved, then click Apply.
- In the Columns panel, click Add.
- From the list of attributes, choose Time - Ticket update > Update - Year and Time - Ticket update > Update - Month, then click Apply.
- From the Save menu, click Save.
- From the Save menu, click Add to dashboard
- On the Save new report to page, choose an existing dashboard, then choose your dashboard, Bookmarks dashboard from the list
- When you are finished, click Save.
Report 3 - Agent comments
In this report, you'll create another column chart. This chart displays the number of ticket comments from agents by month and year.
To create the report
- Create a new report using the first procedure above.
- In the Metrics panel, click Add.
- From the list of metrics, choose Comments > Agent Comments.
- In the Columns panel, click Add.
- From the list of attributes, choose Time - Ticket update > Update - Year and Time - Ticket update > Update - Month, then click Apply.
- From the Save menu, click Save.
- From the Save menu, click Add to dashboard
- On the Save new report to page, choose an existing dashboard and choose your dashboard, Bookmarks dashboard from the list
- When you are finished, click Save.
Optional reports
If you want to see totals as well as time trends, you can additionally add Key Performance Indicators (KPIs) for the metrics.
Create each of these reports using the Support: Updates history [default] dataset and add them to your dashboard in the same way as you did the three reports above.
- A report with a single metric, Tickets > Tickets created.
- A report with a single metric, Tickets > Tickets solved.
- A report with a single metric, Comments > Agent comments.
If you need more help creating reports, see Creating reports.
Customizing the dashboard
You'll find your new dashboard ready to go in the Dashboards library (![]() ). However, you'll need to do a bit more work to get it looking just right.
). However, you'll need to do a bit more work to get it looking just right.
To customize the dashboard
- Open the dashboard, then click Edit. The dashboard opens in edit mode.
- Click Tab options.
- In the Tab options menu, click Size: fit to one screen (
 ), then click Automatically reorganize widgets (
 ).
). - Click CTRL-A (Windows) or Option-A (Mac) to select all the reports (widgets) on the dashboard.
- Under Widget options, click Hide/Show header (
 ). This removes the title header from each report.
 - To show the label on each KPI chart, perform the following steps for each KPI chart:
- In the KPI chart, click the arrow, then choose Edit report. The report builder opens with the KPI report loaded.
- In the chart configuration menu (
 ), click Chart.
 - On the Chart page, uncheck Hide label.
- Save the report to return to the dashboard.
- Organize the dashboard by dragging and resizing each report until it looks similar to the example screenshot below:

Configuring dashboard filters
In this section, you'll create two dashboard filters. A time filter changes the time period of the results shown on the dashboard. The change attribute filter enables you switch the x-axis attribute being used for the column charts between month, week, and date.
Add a time filter
In this section, you'll add a time filter to your dashboard that lets dashboard viewers select the date range displayed by the dashboard.
To add a time filter
- In your dashboard, click Add
- From the list of widgets, choose add time filter.
- On the Time filter widget page, select the first attribute, Updates history [default] - Update (this corresponds to the Time - Ticket update group of attributes).
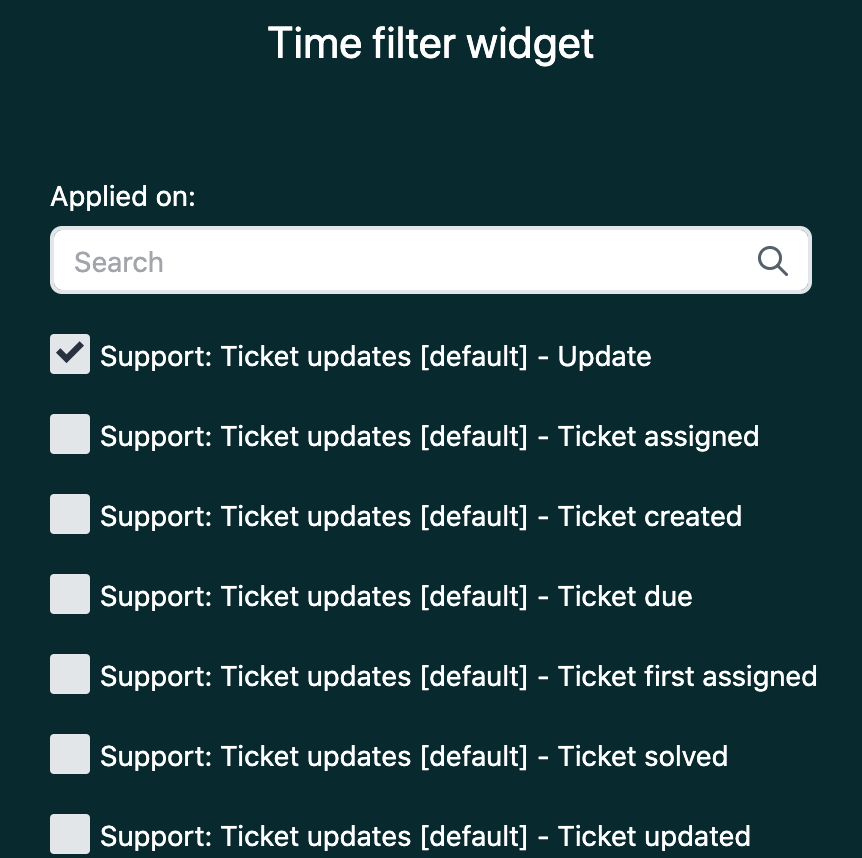
- From the Render as drop-down list at the bottom of the widget page, choose Advanced ranges. This gives you access to both simple and advanced date ranges in your time filter widget.
- Click Close.
Now, when you preview your dashboard, you'll see that you can use the time filter to select a simple or advanced date range. When you select a range, the dashboard updates to reflect the new time period. Now, you'll add a change attribute filter. This attribute lets you change the attribute being reported on from Update - month to a different attribute.
Add a change attribute
To add a change attribute
- In your dashboard, click Add
- From the list of widgets, choose Add change attribute.
- On the Choose change attribute page, select Update - Month. The change attribute is displayed and dashboard viewers can replace the Update - Month attribute with any other month.
- From the Display drop-down list on the Choose change attribute page, choose In a button list.
- In the Restrict to this list of attributes enter the following attributes. These will be the only change attributes displayed to the end user:
- Update - Month
- Update - Week of year
-
Update - Date

- Move the change attributes widget so you can see it and the time filter next to each other.
You've now completed this section and viewers can use the time attribute to alter the duration of the whole dashboard, or the change attribute to report by month, week of year, or date. You can set any combination of values you want. In the next section, you'll learn how yo can save reports you've configured using dashboard filters by using bookmarks.
Setting up the bookmarks
In this section, you'll set up three bookmarks that viewers to use to switch between three different time periods and levels of detail with a single button click rather than having to configure multiple features:
- Monthly for the past 12 months
- Weekly for the past 12 weeks
- Daily for the past 30 days

Monthly view
To set and bookmark the monthly view
- In the time filter widget, set the date range to be from 12 months in the past to 1 month in the past.
- In the change attribute widget, choose Update - Month.

- From the dashboard menu, click Add > Add bookmark.
- On the Bookmark page, click Create bookmark from current state and name it 12 month view.
- Click the pin button to make this the default dashboard configuration.

- Click Close.

Weekly view
To set and bookmark the weekly view
- In the time filter widget, set the date range to be from 12 weeks in the past to 1 week in the past.
- In the change attribute widget, choose Update - Week of year
- In the bookmark widget you previously created, click the top-right corner menu, then click Edit.
- On the Bookmark page, click Create bookmark from current state. A new, blank bookmark is created.
- Name the new bookmark 12 week view, and then click Close.

Daily view
To set and bookmark the daily view
- In the time filter widget, set the date range to be from 30 days in the past to yesterday.
- In the change attribute widget, choose Update - Date
- In the bookmark widget you previously created, click the top-right corner menu, then click Edit.
- On the Bookmark page, click Create bookmark from current state. A new, blank bookmark is created.
- Name the new bookmark 30 day view, and then click Close.

Finishing up
To finish the dashboard
- Hide the time filter and change attributes widgets. In top-right corner menu of each widget, click Hide.
- Move the bookmarks widget to a clear space on the dashboard.

- Rearrange the dashboard to look similar to the example below:

Dashboard viewers can now switch between dashboard configurations with a single click.