

Zendesk Explore features a prebuilt dashboard to help you monitor many details about your tickets, efficiency, and performance with Zendesk Support. The dashboard can help you identify your ticket backlog, customer satisfaction, agent activity, SLAs, and more.
This article contains the following topics:
Opening the Support dashboard
Use the following procedure to access the Support dashboard.
- In Explore, click the Dashboard icon (
 ) in the left sidebar.
 - From the list of dashboards, select the Zendesk Support dashboard.
Understanding the Support dashboard reports
The Support dashboard contains the following tabs:
- Tickets tab
- Efficiency tab
- Assignee activity tab
- Agent updates tab
- Unsolved tickets tab
- Backlog tab
- Satisfaction tab
- SLAs tab
- Group SLAs tab
Tickets tab
The Tickets tab contains reports about tickets created in your Zendesk account. You can filter the reports by time, group, brand, channel, form, submitter role, and requester organization.
On this tab, the time filter is based on the ticket creation date, unless otherwise noted in the report descriptions below.
To open the Tickets dashboard tab
- In Explore, click the Dashboard icon () in the left sidebar.
- From the list of dashboards, select the Zendesk Support dashboard.
- Click the Tickets tab.
Tickets tab headline metrics
This tab displays the following headline metrics (KPIs):
- Created tickets: The number of tickets created in your Support account.
- Unsolved tickets: The number of unsolved tickets. These are tickets that do not have a Closed or Solved status.
- Solved tickets: The number of solved tickets. These are tickets that have a Solved or Closed status. The time filter for this report is based on the ticket solved date.
- One-touch tickets: The percentage of tickets that were solved with one agent reply. The time filter for this report is based on the ticket solved date.
- Reopened tickets: The percentage of reopened tickets that were previously marked as Solved. The time filter for this report is based on the ticket solved date.

Tickets tab reports
This tab displays the following reports:
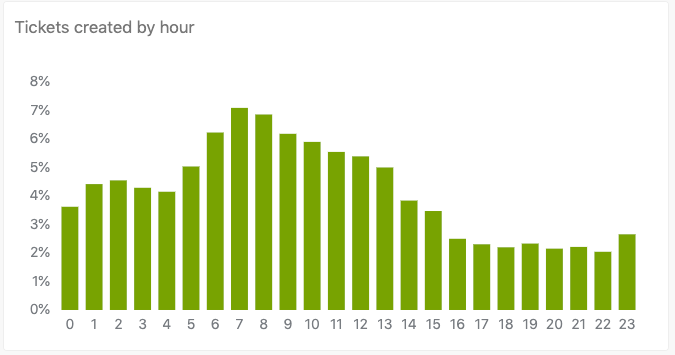
- Tickets created by hour: The percentage of tickets created each
hour (0-23).
- Average tickets created by day of week: The average number of
tickets created for each day of the week.

- Tickets created by date: The total number of tickets created each
day for the date range you choose. You can hover over a data point on
the graph to see how many of the created tickets have been
solved.

- Tickets by selected attribute (top 10): The percentage of tickets
for each type of the attribute you select. For example, if you select
Ticket channel, you'll see the percentage of tickets that
were created by each channel during the date range you
selected.

- Tickets created by date and channel (top 10): The number of
tickets created each day for the date range you chose sliced by the
channel from which the ticket was received.

- Tickets created by month/year: Displays the number of tickets
created each month for the years you select. You can overlay data from
the last five years to help you compare. The current month's data is not
displayed until the end of the month. This report is excluded from the
tab's time filter.

Efficiency tab
The Efficiency tab contains reports that help you evaluate the efficiency of your agents. You can filter the reports by time, group, brand, channel, form, priority, and requester organization.
On this tab, the time filter is based on the ticket solved date, unless otherwise noted in the report descriptions below.
To open the Efficiency dashboard tab
- In Explore, click the Dashboard icon () in the left sidebar.
- From the list of dashboards, select the Zendesk Support dashboard.
- Click the Efficiency tab.
Efficiency tab headline metrics
This tab displays the following headline metrics (KPIs):
- First reply time median: The median time from when the ticket was first created until an agent first replied. The time filter for this report is based on the ticket created date.
- First resolution time median: The median time from the creation of a ticket until it was first closed or solved.
- Full resolution time median: The median time from the creation of a ticket until it was fully closed or solved.
- Group stations average: The average number of groups a ticket was assigned to.
- Assignee stations average: The average number of agents a ticket was assigned to.

Efficiency tab reports
This tab displays the following reports:
- Tickets by first reply time brackets: A bracketed list showing
the percentage of tickets first reply times that fall into various
brackets. For example, in the screenshot below, 12% of tickets were
replied to in more than 24 hours. The time filter for this report is
based on the ticket created date.

- Tickets by full resolution time brackets: A bracketed list
showing the percentage of tickets full resolution times that fall into
various brackets. For example, in the screenshot below, 10% of tickets
were fully resolved in 5-24 hours.

- First reply and assignment time median over time: A comparison
between the median first reply time and the median first assignment time
over the date range you selected. The time filter for this report is
based on the ticket created date.

- Full resolution and requester wait time median over time: A
comparison between the amount of time it took to solve a ticket, and the
median time a ticket spend in the New, Open, or On-hold status.

- Tickets by agent replies brackets: The bracketed percentage of
agent replies for tickets. In the example below, 12% of tickets had 2
agent replies.

- Tickets by group stations brackets: The bracketed number of
groups that were assigned to tickets. In the example below, 56% of
tickets were assigned to two or three groups.

- Agent replies average and resolutions over time: The average
number of agent replies and the total number of tickets solved on a
daily basis. You can hover over a data point to see the exact results
for a day.

- Assignee and group stations average over time: Displays both the
average number of agent tickets were assigned to and the average number
of groups associated with a ticket.

Assignee activity tab
The Assignee Activity tab helps you to see the results when you assign tickets to agents and others. You can filter the reports by time, group, assignee, brand, channel, form, and requester organization.
On this tab, the time filter is based on the ticket solved date.
To open the Assignee activity dashboard tab
- In Explore, click the Dashboard icon () in the left sidebar.
- From the list of dashboards, select the Zendesk Support dashboard.
- Click the Assignee activity tab.
Assignee activity tab headline metrics
This tab displays the following headline metrics (KPIs):
- Solved tickets: The number of solved and closed tickets that were resolved during the selected date range.
- Requester wait time median: The median time that tickets spent in the new, open, or on-hold statuses.
- Assignment to resolution: The median time from the last agent assignment until the ticket was resolved.
- One-touch tickets: The percentage of tickets that were resolved with only one agent reply.
- Two-touch tickets: The percentage of tickets that were resolved after two agent replies.

Assignee activity tab reports
This tab displays the following reports:
- Good vs bad satisfaction tickets: A pie chart showing the
percentage of rated tickets that received a satisfaction rating of good
or bad.

- Tickets by requester wait time brackets: A bracketed list showing
the requester wait time for tickets. In this example, 12% of tickets
took between 1 and 3 days before the requester received a
response.

- Satisfaction score and requester wait time median by date: A
comparison of the customer satisfaction rating against the amount of
time they had to wait for a response from an agent.

- Assignee activity: A detailed list of your agents and their
activities including the number of tickets they solved, their average
reply time, and more.

Agent updates tab
The Agent Updates tab shows comments and updates made to tickets by your agents. You can filter the reports by time, agent, brand, channel, form, group, and requester organization.
On this tab, the time filter is based on the update date.
To open the Agent updates dashboard tab
- In Explore, click the Dashboard icon () in the left sidebar.
- From the list of dashboards, select the Zendesk Support dashboard.
- Click the Agent updates tab.
Agent updates tab headline metrics
This tab displays the following headline metrics (KPIs):
- Public comments: The total number of tickets where public comments from an agent are included.
- Internal comments: The total number of tickets where internal comments from an agent are included.
- Tickets commented: The number of tickets with an agent comment, whether public or internal.
- Tickets solved: The number of tickets that were marked as solved by an agent.
- Tickets created: The number of tickets that were created by an agent.

Agent updates tab reports
This tab displays the following reports:
- Agent comment averages by date: A comparison of the total number
of comments on tickets and the number of those comments that were public
or internal.

- Tickets commented, created and solved by date: A comparison of
the number of tickets created, solved, and commented on over the
selected date range.

- Agent updates: For each agent, displays detailed information
about updates they made to tickets including comments, solves, creation,
and more.

Unsolved tickets tab
The Unsolved Tickets tab helps you take a detailed look at tickets in your account that are still open and require attention. You can filter the reports by group, assignee, brand, channel, priority, and requester organization.
To open the Unsolved tickets dashboard tab
- In Explore, click the Dashboard icon () in the left sidebar.
- From the list of dashboards, select the Zendesk Support dashboard.
- Click the Unsolved tickets tab.
Unsolved tickets tab headline metrics
This tab displays the following headline metrics (KPIs):
- Unsolved tickets: Tickets that are not in a Solved or Closed status.
- New and open tickets: Tickets that are in a New or Open status.
- Unreplied unsolved tickets: Unsolved tickets with no agent replies.
- Time since update median: The median time since unsolved tickets were updated.
- Ticket age median: The median time since unsolved tickets were created.

Unsolved tickets tab reports
This tab displays the following reports:
- Unsolved tickets by status: A pie chart showing the percentage of
tickets that are in a New, Open, Pending, or On-hold status.

- New and open tickets by assignment status: A pie chart showing
the percentage of tickets in the Open or New state that are assigned, or
unassigned.

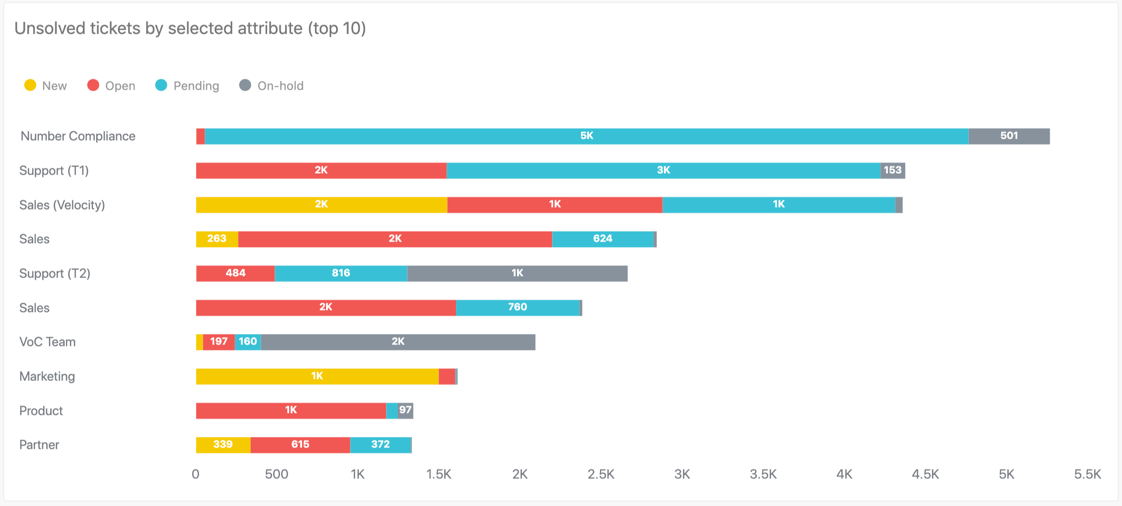
- Unsolved tickets by selected attribute (top 10): A stacked chart
displaying the percentage of tickets in the new, open, pending and
on-hold statuses for the attribute you choose. You can choose from
ticket brand, channel, form, group, priority, or type.
- Unsolved tickets by creation month: A stacked chart showing all
unsolved tickets over the date range you selected. The stacks indicate
whether the ticket is New, Open, Pending, or On-Hold.

- Unsolved tickets: A detailed list of unsolved tickets sorted by
agent name.

Backlog tab
The Backlog tab helps you look at open ticket activity over a date range you select. You can filter the reports by group, assignee, brand, channel, priority, and type.
This tab contains no headline metrics.
To open the Backlog dashboard tab
- In Explore, click the Dashboard icon () in the left sidebar.
- From the list of dashboards, select the Zendesk Support dashboard.
- Click the Backlog tab.
Backlog tab reports
This tab displays the following reports:
- Daily historical backlog by status (30 days): A list of your open
ticket backlog over the last 30 days to help you identify
trends.

- Weekly historical backlog by status (12 weeks): A list of your
open ticket backlog over the last 12 weeks to help you identify
trends.

- Weekly historical backlog by selected attribute (top 10/12
weeks): The number of unsolved tickets at the end of each week
for the last 12 weeks. Choose a tab to display results by ticket brand,
group, channel, priority, or type.

Satisfaction tab
The Satisfaction tab helps you take a closer look at customer satisfactions (CSAT) scores for your tickets. You can filter the reports by time, group, brand, channel, form, priority, and type.
On this tab, the time filter is based on the ticket solved date, unless otherwise noted in the report descriptions below.
To open the Satisfaction dashboard tab
- In Explore, click the Dashboard icon () in the left sidebar.
- From the list of dashboards, select the Zendesk Support dashboard.
- Click the Satisfaction tab.
Satisfaction tab headline metrics
This tab displays the following headline metrics (KPIs):
- Satisfaction score: The percentage of tickets rated as good from the total number of rated tickets.
- Good satisfaction tickets: The number of tickets rated as good.
- Bad satisfaction tickets: The number of tickets rated as bad.
- Bad to good ratings: The number of tickets with a rating that changed from bad to good. The time filter for this report is based on the update date.
- Satisfaction rated ratio: The percentage of tickets that received either good or bad from the total number of surveyed tickets.

Satisfaction tab reports
This tab displays the following reports:
- Good vs bad satisfaction tickets: A pie chart showing the
percentage of good and bad satisfaction rated tickets both with and
without comments.

- Rated tickets funnel: A funnel chart showing the percentage of
surveyed and rated tickets against all tickets.

- Satisfaction score and rated tickets by date: The number of rated
tickets against the percentage satisfaction score they received over the
selected date range.

- Satisfaction score by selected attribute (top 10 by volume): The
average satisfaction percentage for the attribute you select. For
example, if you select Ticket Channel, you'll see the average
satisfaction score for each of the ticket channels like Chat, Email,
etc. You can select from Ticket brand, channel, form, group, priority,
and type.

- Satisfaction score and rated tickets by month (12 months): The
number of rated tickets, and the average satisfaction score over a
12-month period. This report is excluded from the tab's time
filter.

- Satisfaction rated ratio and surveyed tickets by month (12
months): The percentage of all tickets that were rated against
the number of tickets that were surveyed over a 12-month period. This
report is excluded from the tab's time filter.

SLAs tab
The SLAs tab helps you measure your results against SLAs you configured. You can filter the reports by time, SLA policy, SLA metric, group, brand, form, priority, and requester organization.
On this tab, the time filter is based on the SLA update date, unless otherwise noted in the report descriptions below.
To open the SLAs dashboard tab
- In Explore, click the Dashboard icon () in the left sidebar.
- From the list of dashboards, select the Zendesk Support dashboard.
- Click the SLAs tab.
SLAs tab headline metrics
This tab displays the following headline metrics (KPIs):
- SLA achievement rate: The percentage of tickets that met the SLA from the total number of SLA tickets.
- SLA breached tickets: The number of tickets that have at least one SLA target breach.
- SLA achieved tickets: The number of tickets that did not have an SLA target breach.
- SLA active tickets: The number of tickets with an active SLA policy.
- SLA active breached tickets: The number of active tickets with at least one SLA target breach.

SLAs tab reports
This tab displays the following reports:
- Achieved vs breached completed SLA policies by date: Shows the
number of tickets that breached or achieved your SLA targets over the
date range you chose.

- Achieved and breached completed SLA policies by selected attribute
(top 10 breached): A stacked bar chart showing the percentage of
tickets that achieved, or breached an SLA policy for the attribute you
select. You can select from ticket brand, channel, form, or group.
Additionally, you can select the SLA policy name.

- SLA target breaches by hour: A chart showing the average
percentage of breaches that happened each hour over a 24 hour
period.

- SLA target breaches by day of week: A bar chart showing the
average percentage of SLA breaches that happened each day of the
week.

- Achieved and breached SLA targets by metric: The percentage of
time that each SLA target was achieved or breached.

- SLA target achievement rate by month (12 months): The percentage
of instances per month where SLA targets where achieved. This report is
excluded from the tab's time filter.

Group SLAs tab
The Group SLAs tab helps you measure your results against group SLAs you configured. You can filter the reports by time, group SLA policy, group SLA metric, group, brand, form, priority, and requester organization.
On this tab, the time filter is based on the group SLA update date, unless otherwise noted in the report descriptions below.
To open the Group SLAs dashboard tab
- In Explore, click the Dashboard icon () in the left sidebar.
- From the list of dashboards, select the Zendesk Support dashboard.
- Click the Group SLAs tab.
Group SLAs tab headline metrics
This tab displays the following headline metrics (KPIs):
- Achievement rate: The percentage of tickets that met the group SLA from the total number of SLA tickets.
- Breached tickets: The number of tickets that have at least one group SLA target breach.
- Achieved tickets: The number of tickets that did not have a group SLA target breach.
- Active tickets: The number of tickets with an active group SLA policy.
- Breached tickets: The number of active tickets with at least one group SLA target breach.

Group SLAs tab reports
This tab displays the following reports:
- Group SLA: Achieved vs breached completed Group SLA policies by
date: Shows the number of tickets that breached or achieved your
group SLA targets over the date range you chose.

- Group SLA: Achieved and breached completed Group SLA policies by
selected attribute (top 10 breached): A stacked bar chart
showing the percentage of tickets that achieved, or breached a group SLA
policy for the attribute you select. You can select from ticket brand,
channel, form, or group. Additionally, you can select the group SLA
policy name.

- Group SLA target breaches per hour: A chart showing the average
percentage of breaches that happened each hour over a 24 hour
period.

- Group SLA target breaches by day of week: A bar chart showing the
average percentage of group SLA breaches that happened each day of the
week.

- Group SLAs: Achieved and breached Group SLA targets by metric:
The percentage of time that each group SLA target was achieved or
breached.

- Group SLAs: Group SLA target achievement rate by month (12
months): The percentage of instances per month where group SLA
targets where achieved. This report is excluded from the tab's time
filter.
