Note: This is an Early Access Preview (EAP). To learn more about the EAP, see a roadmap for the real-time dashboards, or to sign up, visit the EAP community area.
Real time monitoring dashboards build on the capabilities of the analytics dashboards you already use in Zendesk to add the following capabilities:
- Dashboards are based on use cases rather than channels to more accurately reflect common service workflows as agents' day-to-day tasks.
- Real time reports to provide the necessary context to make immediate decisions.
- Recent historical data is available for many reports to help you identify trends up to seven days in the past.
This release introduces three new dashboards, each with multi-filtering and extensive drill in capabilities for the live data on the dashboard.
- Incoming tickets: Comprehensive reporting on your queue backlog with detailed drill in (requires omnichannel routing).
- Ticket progress: Details about in-progress and recently completed tasks in your agent backlog.
- Agent productivity: An overview of how your agents and groups of agents are performing across channels.
This article contains the following topics:
Accessing the real-time monitoring dashboards
You’ll find the real-time dashboards in the analytics dashboard library in the same place your existing dashboards are accessed.
To access the real-time dashboards
- In Support, open the product tray.
- From the list of products, click Analytics.
Explore opens and displays the dashboard library with the three new dashboards.
- Click one of the following dashboards to open it:
- Incoming tickets
- Ticket progress
- Agent productivity
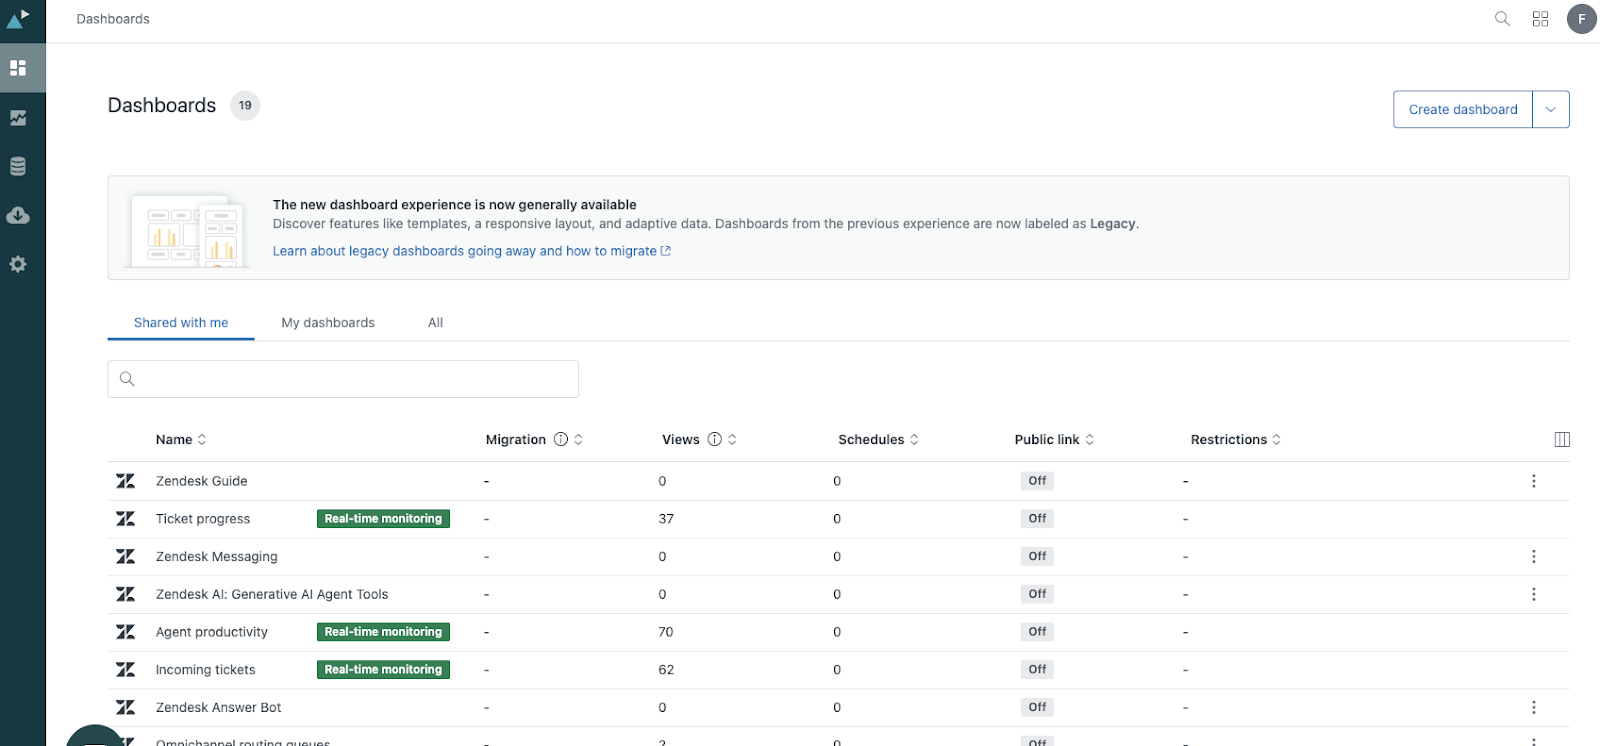
The selected dashboard opens and is ready to use.
Understanding the real time monitoring dashboards
In the following topics, you’ll learn about the three real time dashboards and the reports they contain.
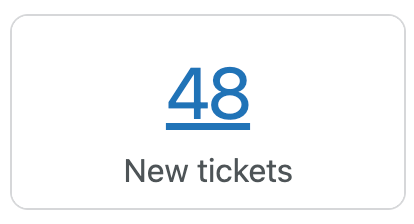
From the drill in page, you can click the ticket ID to open that ticket in Support or the agent name to open the agent's profile.
In any dashboard, you can hide or show the filters by clicking the filter icon
(![]() ).
).
This section contains the following topics:
Incoming tickets dashboard
The incoming tickets dashboard gives you comprehensive reporting on your queue backlog with detailed drill in. To use this dashboard, you must have turned on omnichannel routing and custom queues.
This dashboard contains the following tabs:
Tickets in queue
This tab gives you information about your ticket queue. This includes emails, messages, and voice. The reports can be filtered by brand, queue, primary group, secondary group, channel type, and channel.
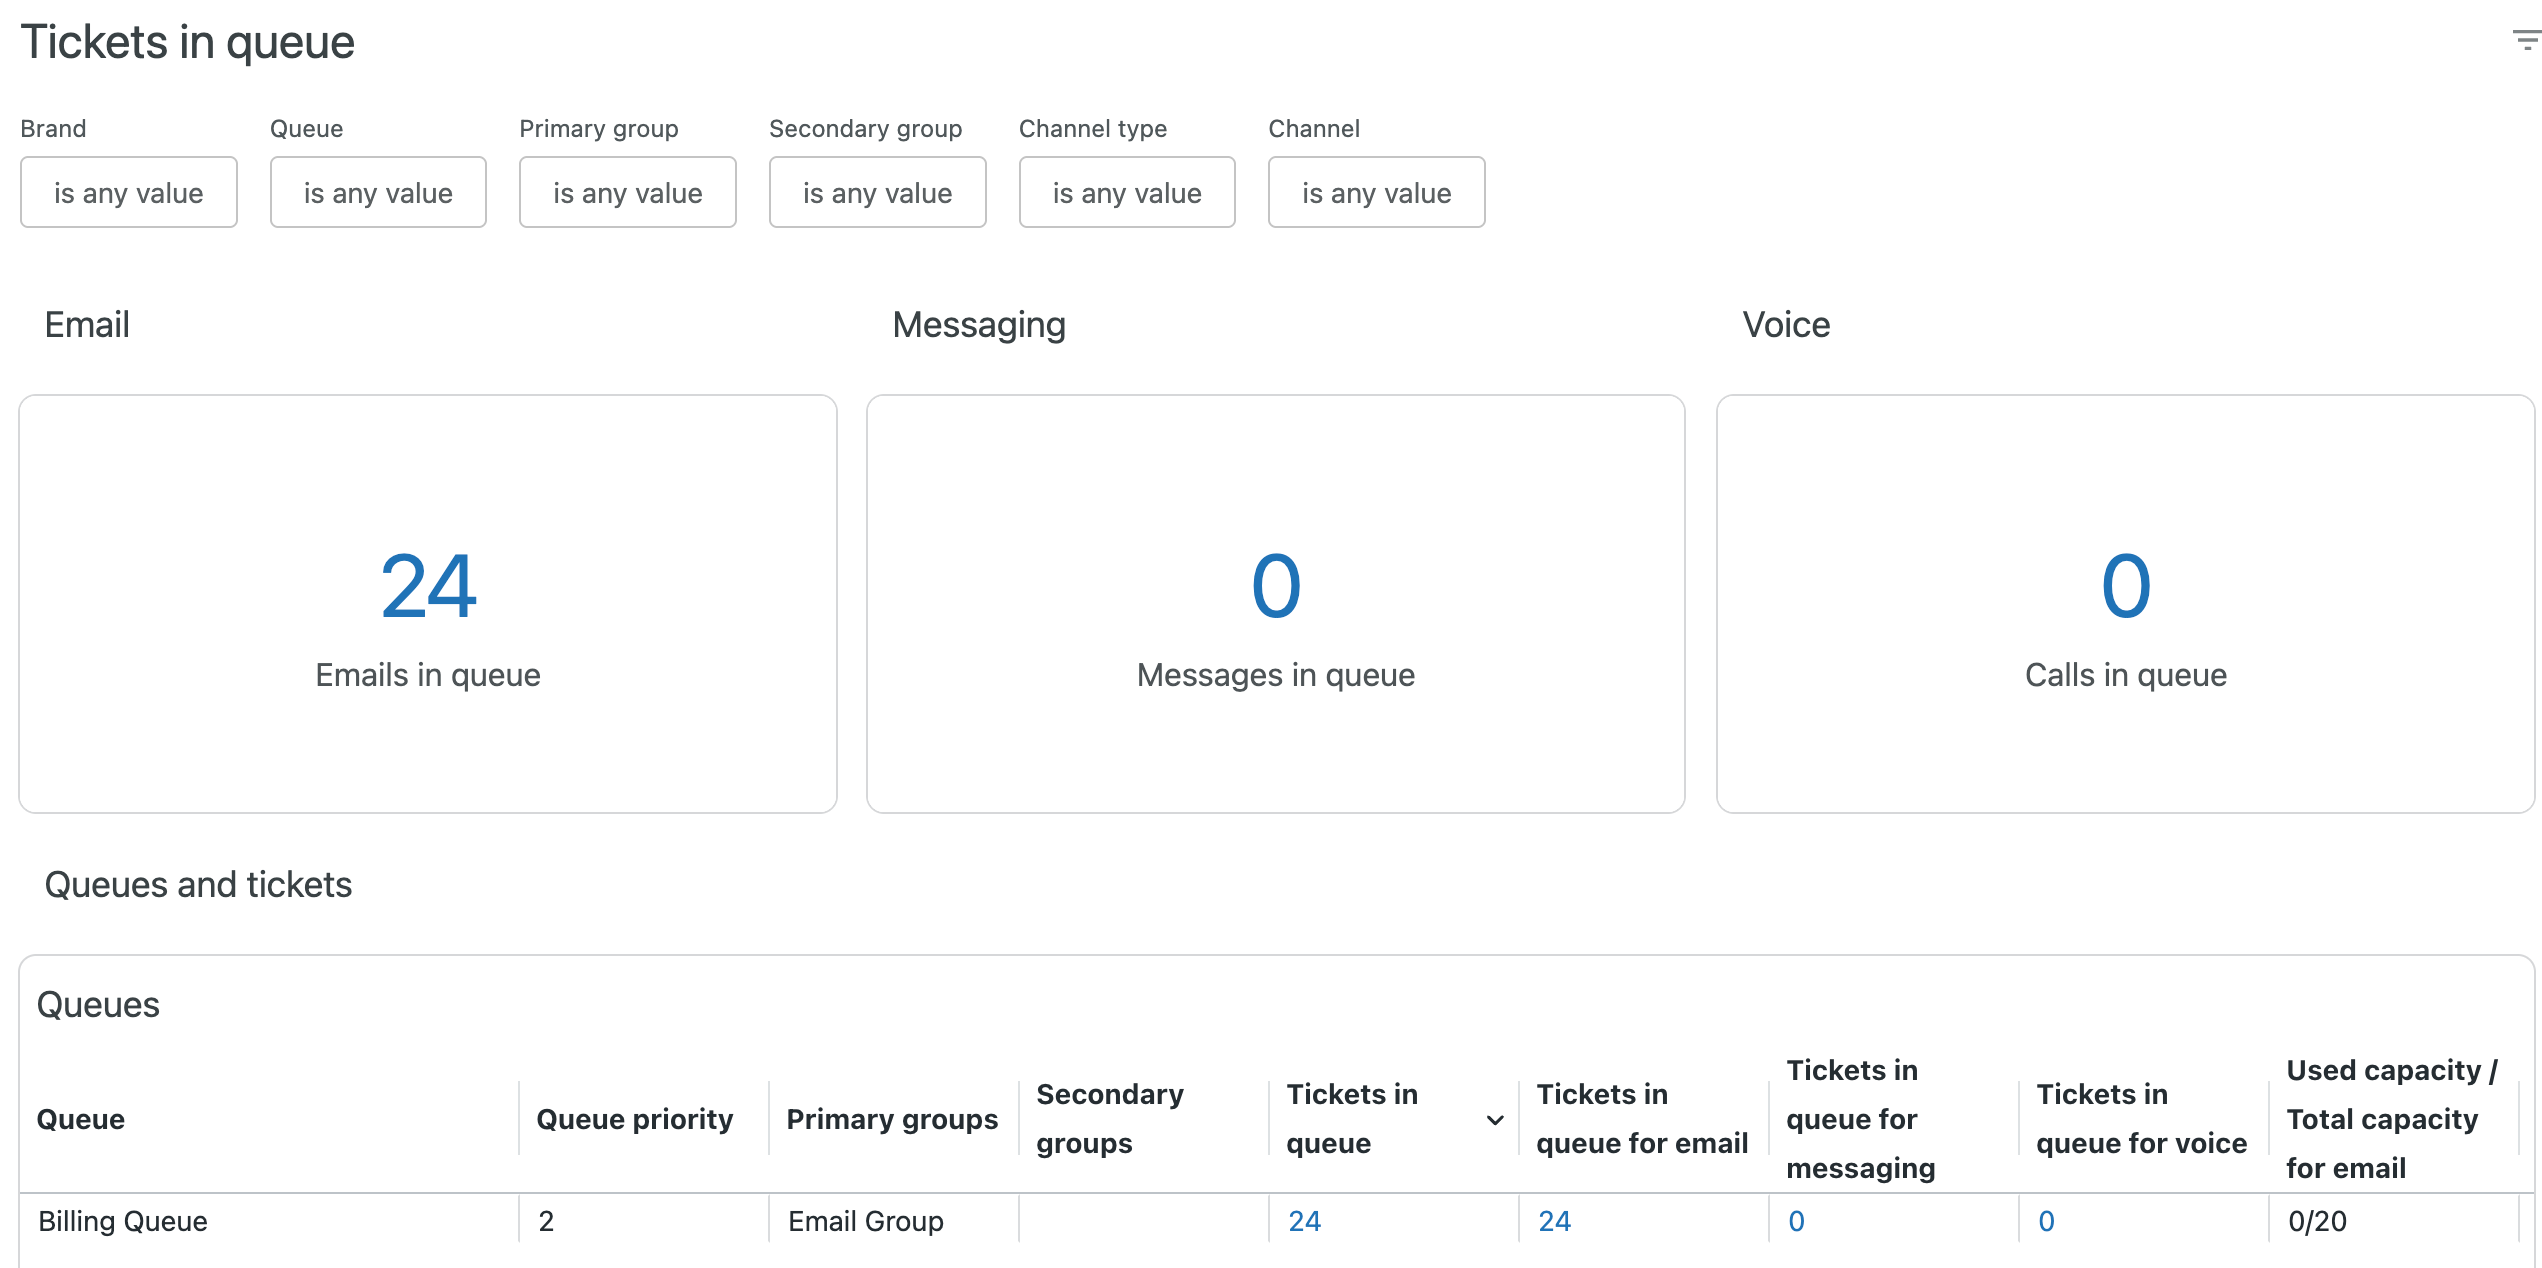
The tab contains the following reports:
- Emails in queue: Displays in near-real-time, the number of email requests in the queue.
- Messages in queue: Displays in near-real-time, the number of messaging requests in the queue.
- Calls in queue: Displays in near-real-time, the number of voice calls in the queue.
- Queues: Displays information about all of your queues including priorities, ticket in the queue, and agent availability and capacity, as well as longest and average time in queue for all tickets in a queue.
- Tickets in queue: Displays information about all tickets in your queues including groups, brands, skills, channel, time in queue, and more.
Queue wait times
This tab gives you information about the average time that requests spend in the queue. The reports can be filtered by brand, queue, primary group, secondary group, channel type, and channel.
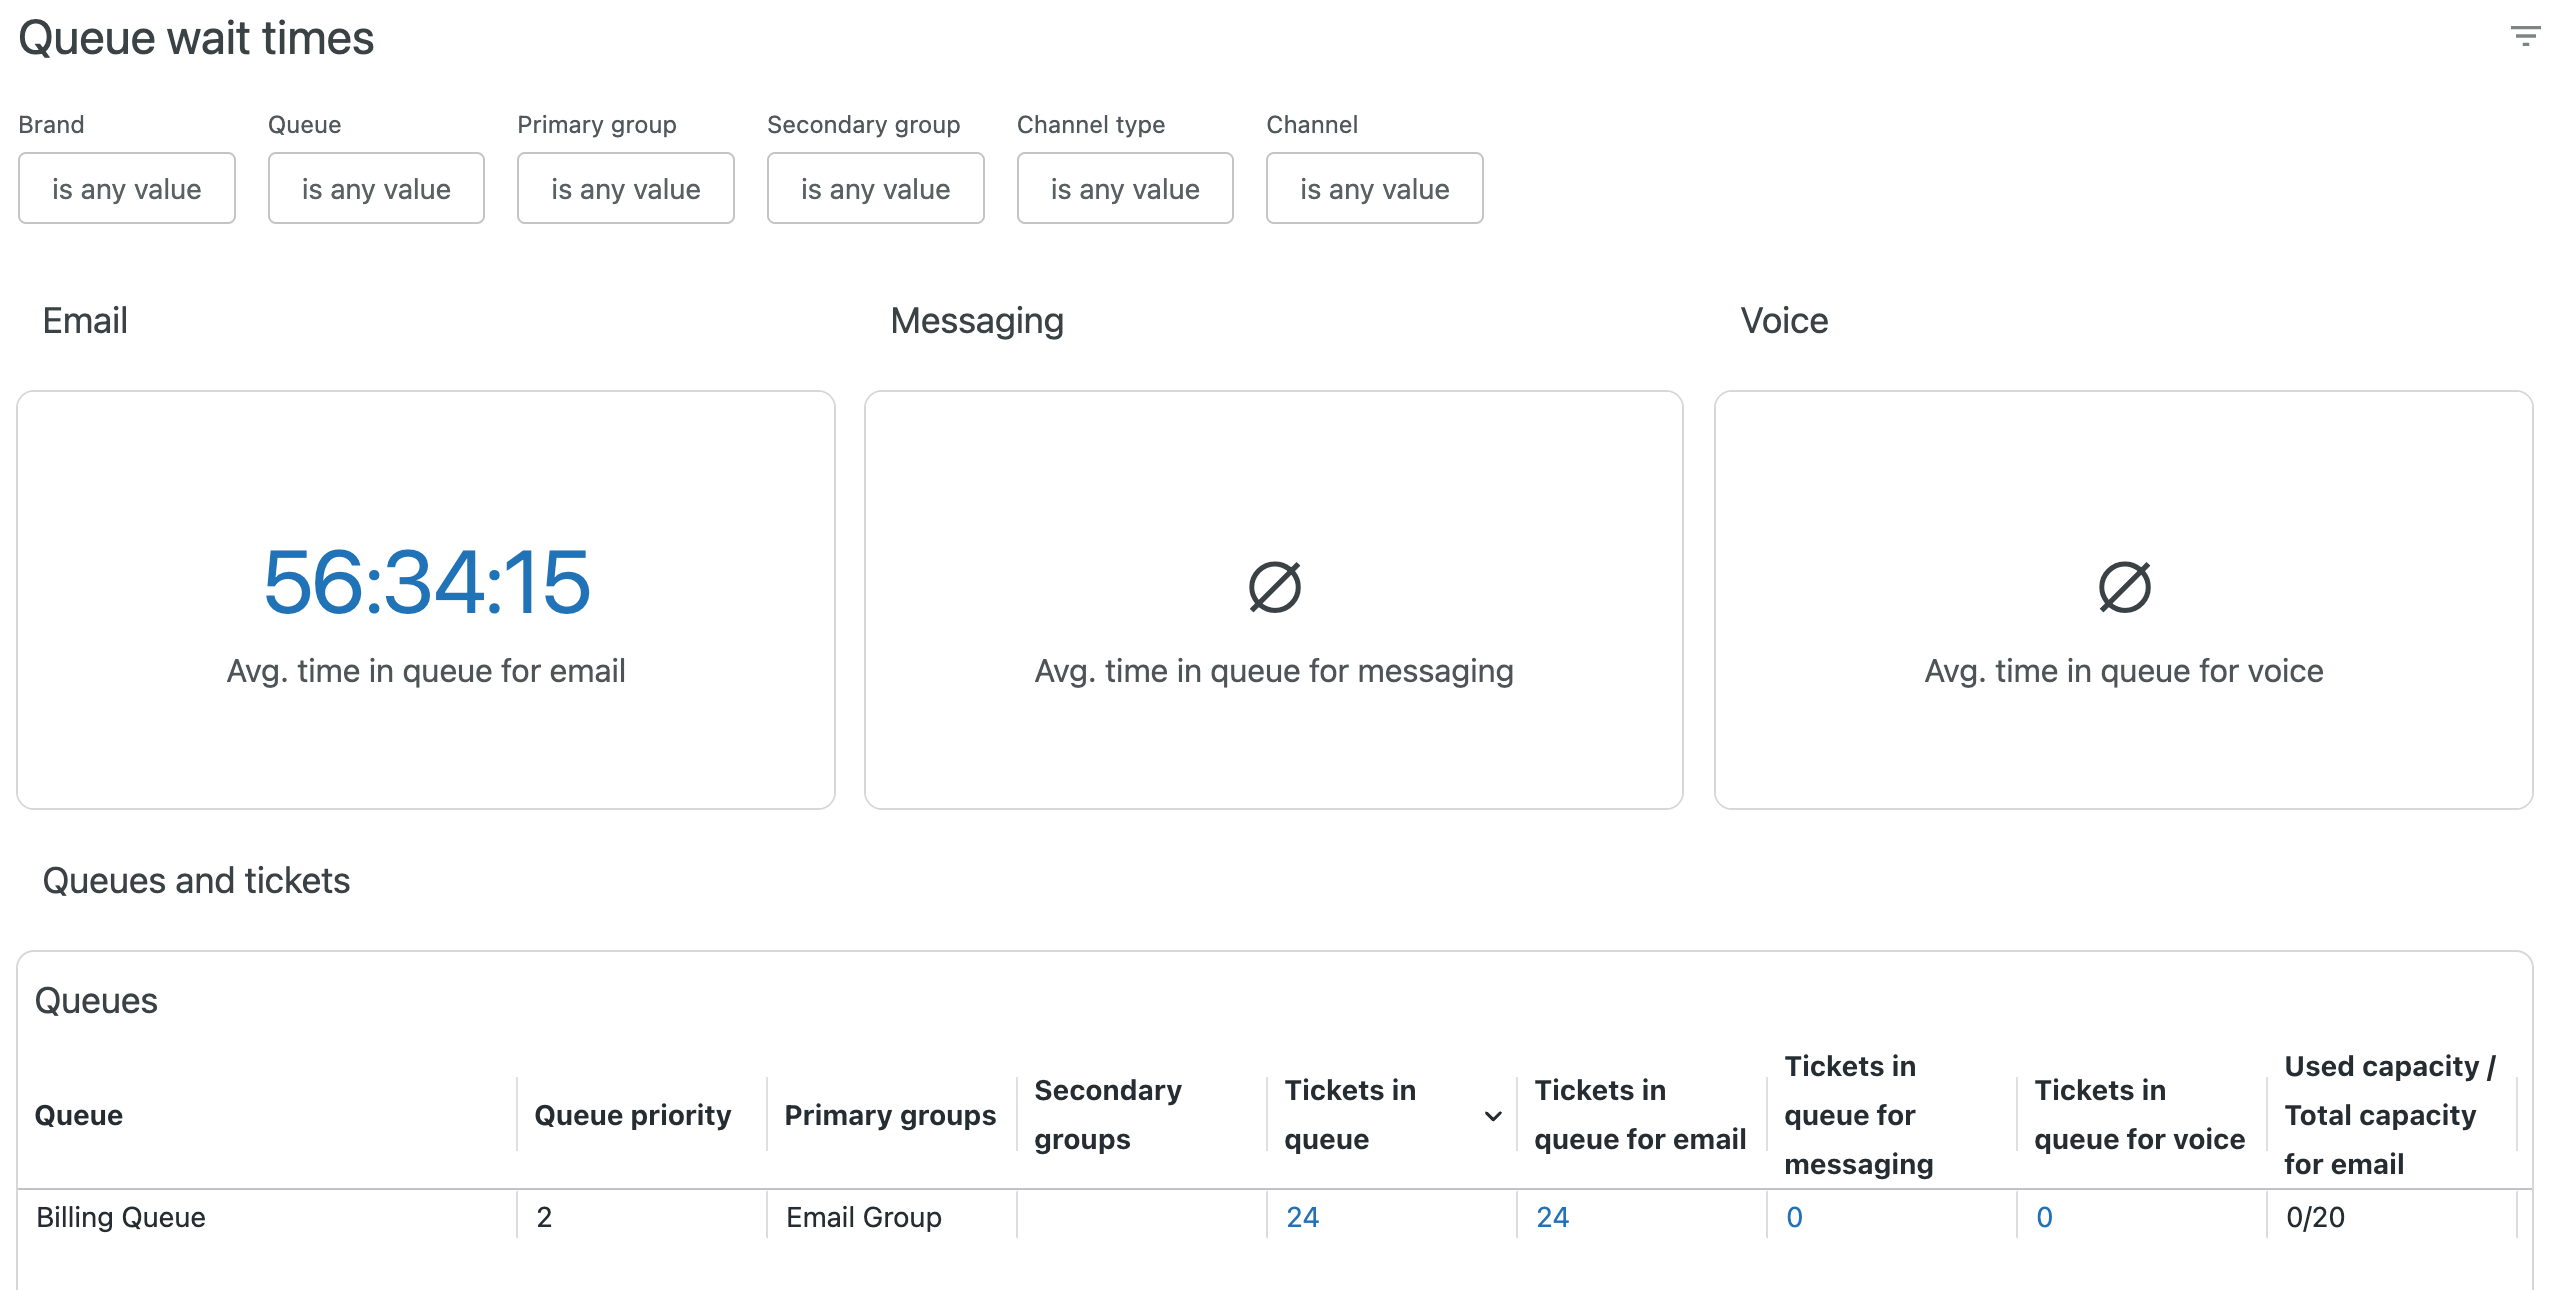
The tab contains the following reports:
- Avg. time in queue for email: Displays in near-real-time, the average time emails spend in the queue before they are addressed.
- Avg. time in queue for messaging: Displays in near-real-time, the average time messages spend in the queue before they are addressed.
- Avg. time in queue for voice: Displays in near-real-time, the average time voice calls spend in the queue before they are addressed.
- Queues: Displays information about all of your queues including priorities, ticket in the queue, and agent availability and capacity, as well as longest and average time in queue for all tickets in a queue.
- Tickets in queue: Displays information about all tickets in your queues including groups, brands, skills, channel, time in queue, and more.
Agent availability
This tab gives you information about your agent availability for each queue. The reports can be filtered by brand, group, agent, agent status, channel type, and channel.
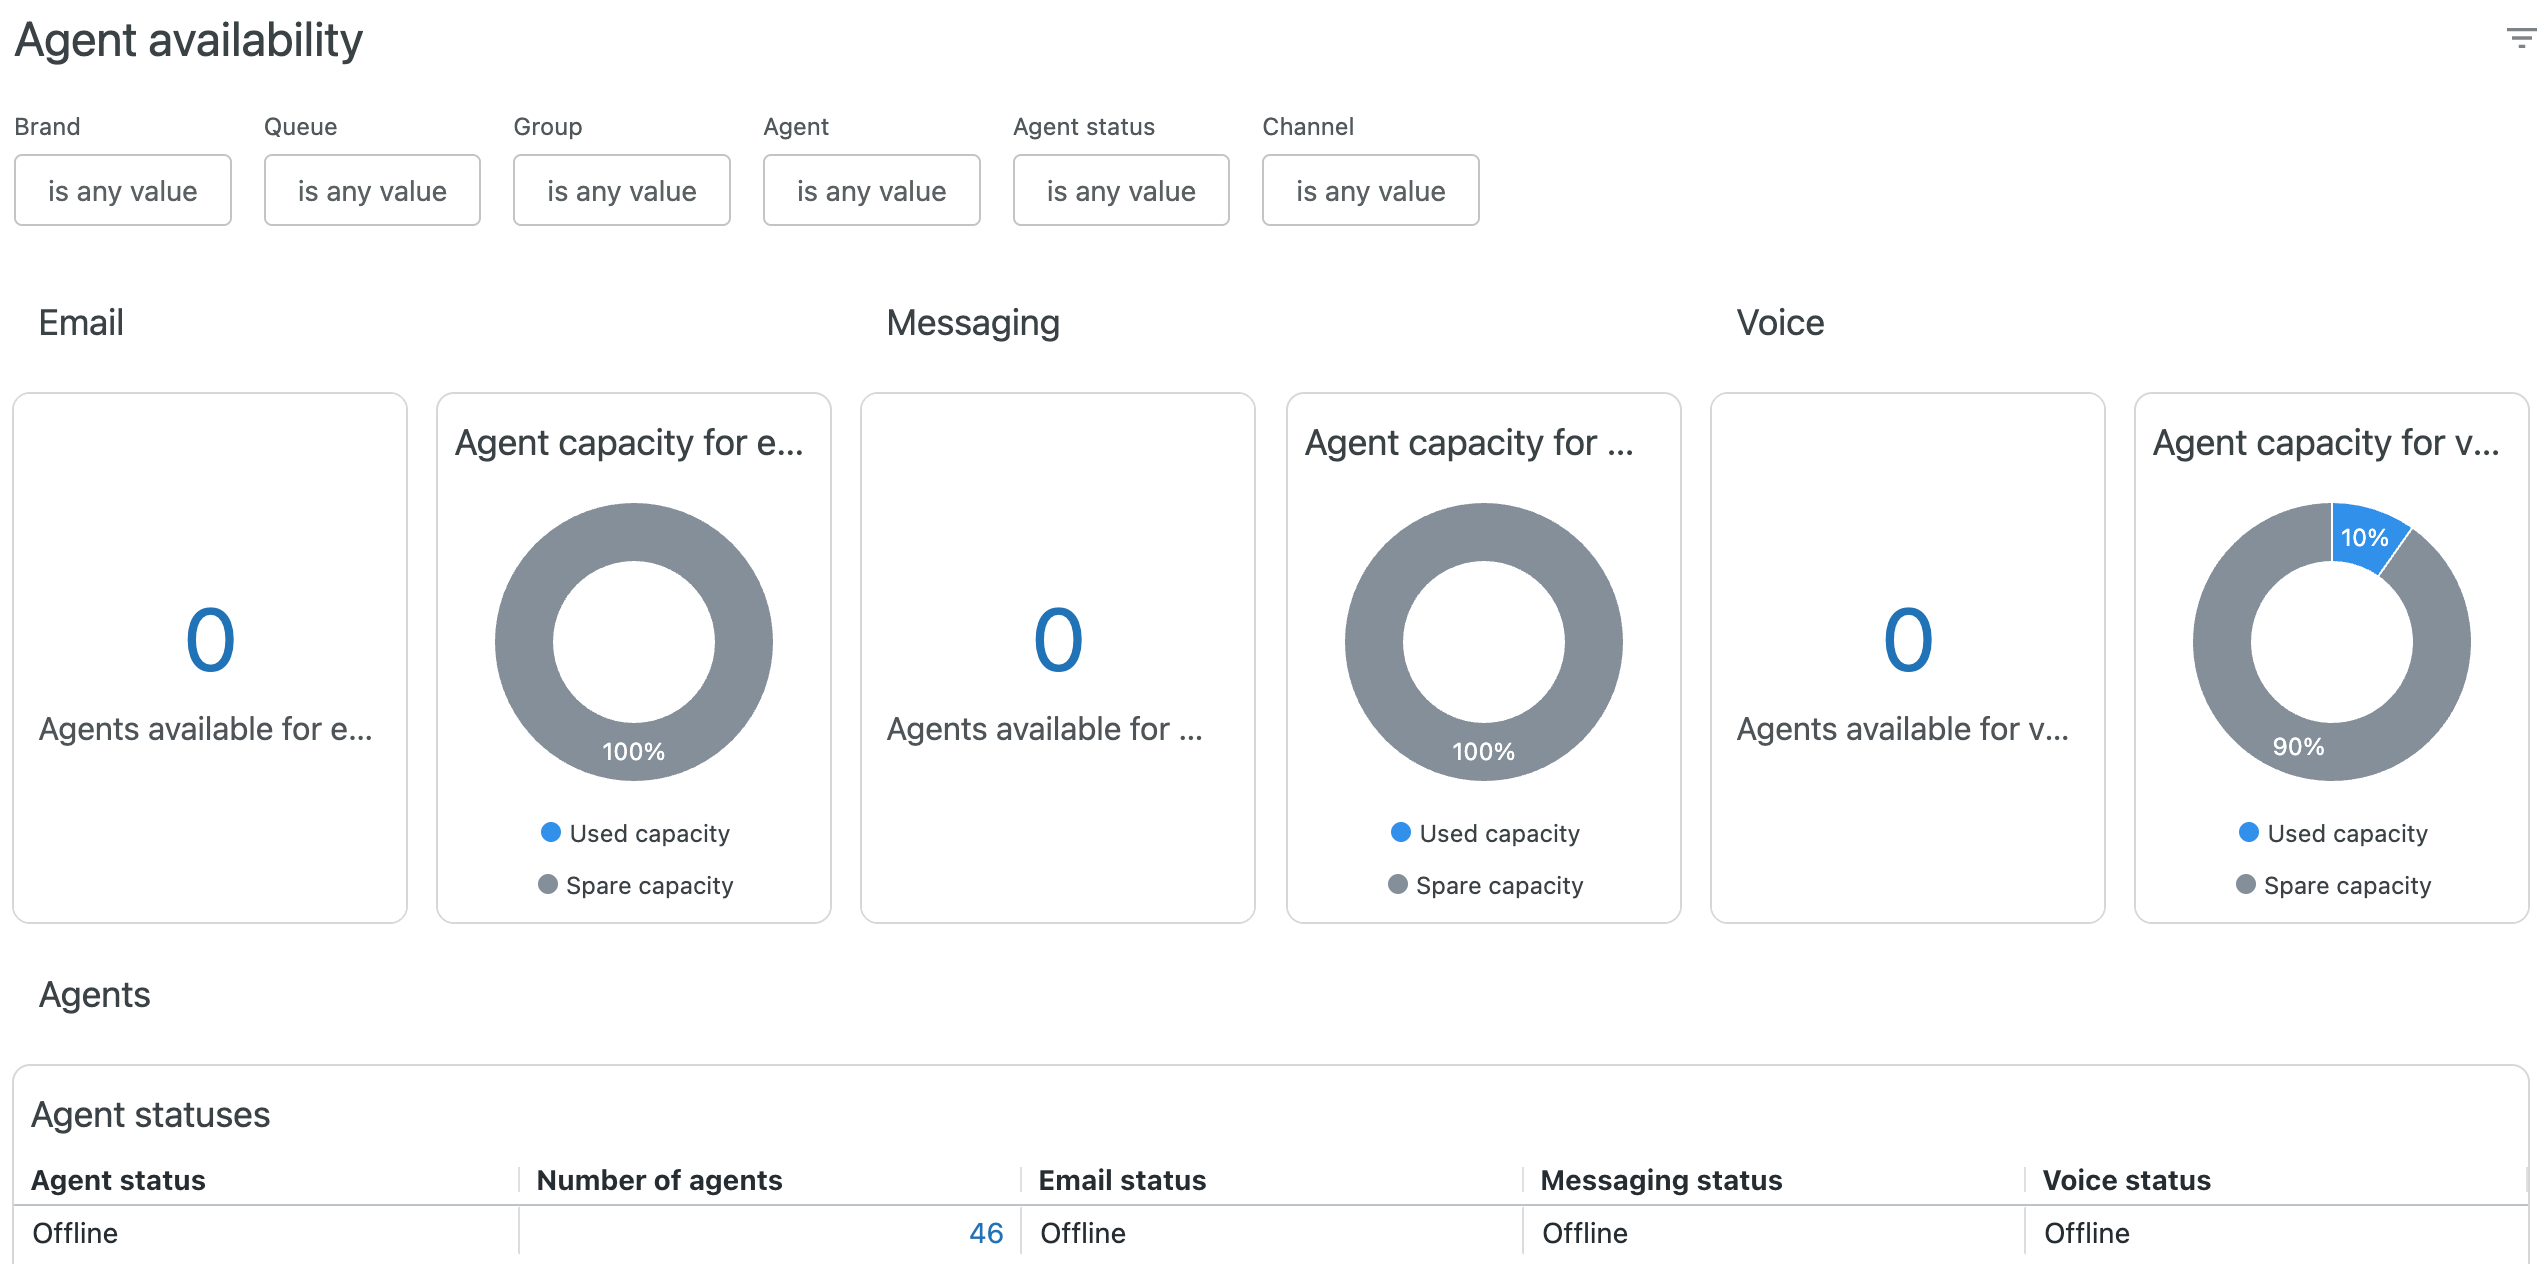
The tab contains the following reports:
- Agents available for email: The number of agents that are available for email support. You can drill into this report to see more details about the available agents.
- Agent capacity for email: A pie chart showing the percentage of agents who are already using the email channel, and how many are available for email support.
- Agents available for messaging: The number of agents that are available for messaging support. You can drill into this report to see more details about the available agents.
- Agent capacity for messaging: A pie chart showing the percentage of agents who are already using the messaging channel, and how many are available for messaging support.
- Agents available for voice: The number of agents that are available for voice support. You can drill into this report to see more details about the available agents.
- Agent capacity for voice: A pie chart showing the percentage of agents who are already using the voice channel, and how many are available for voice support.
- Agent statuses: A detailed breakdown of your agent’s showing their status for each channel, email, messaging, and voice. You can click any value under Number of agents to drill-in and see the agents with that status.
- Agent availability and capacities: A detailed breakdown of your agent’s status alongside their ticket assignment. You can click the number of tickets assigned to see further detail on the work items assigned.
- Agent availability and tickets assigned by group: Similar to the agent availability and capacities report, this table provides an overview by group on agents availability alongside work item assignment. You can click any of the numeric values to drill in to further details.
Incoming tickets by brand
This tab gives you information by brand about your ticket queue. The reports can be filtered by brand, queue, primary group, secondary group, and channel.
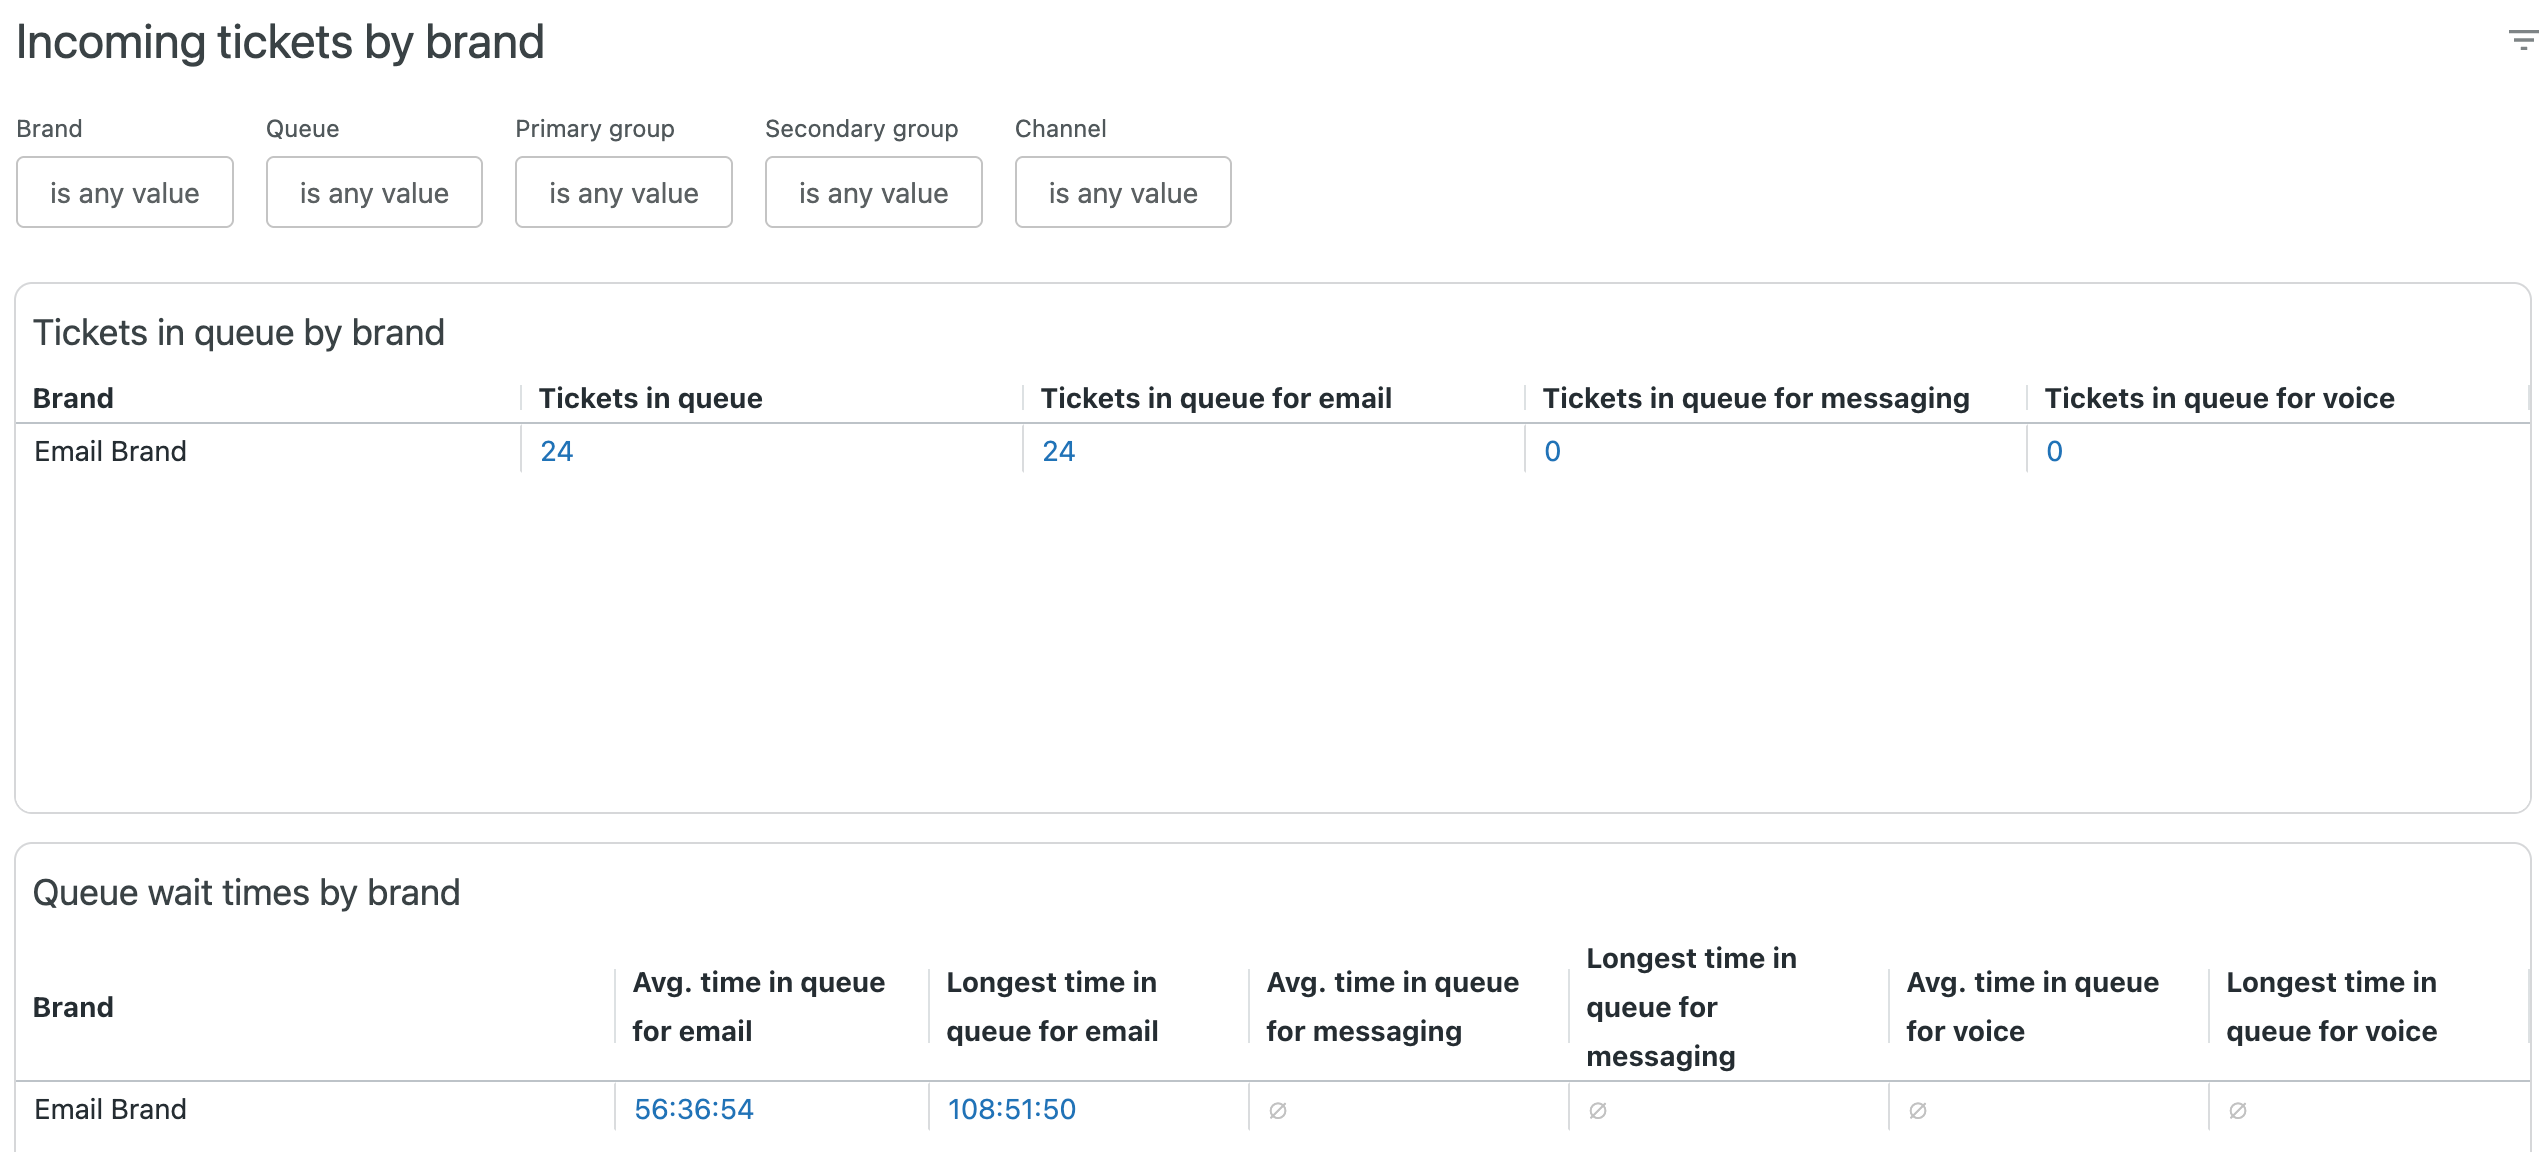
The tab contains the following reports:
- Tickets in queue by brand: For each of your brands, displays the brand name and the number of email, messaging, and voice tickets in the queue. You can click any of the numeric values to drill in to more detailed information.
- Queue wait times by brand: For each of your brands, displays the brand name and the average time in the queue for email, messaging, and voice requests. You can click any of the numeric values to drill in to more detailed information.
- Agent availability and tickets assigned by brand: For each of your brands, displays the brand name, tickets assigned to that brand and agent availability and workload for email, voice, and messaging.You can click any of the numeric values to drill in to more detailed information.
Ticket progress dashboard
The ticket progress dashboard gives you details about in-progress and recently completed tasks in your agent backlog. This dashboard can be used to monitor the team's current workflow, including assigned and recently resolved work items to help supervisors get an idea of the team's tickets in different statuses, across different channel over the last seven days.
The reports can be filtered by brand, ticket group, channel type, channel, ticket status, ticket assignee, and creation since time.
This dashboard contains the following tabs:
Ticket status
This tab gives you information about your email, messaging, and voice tickets status.
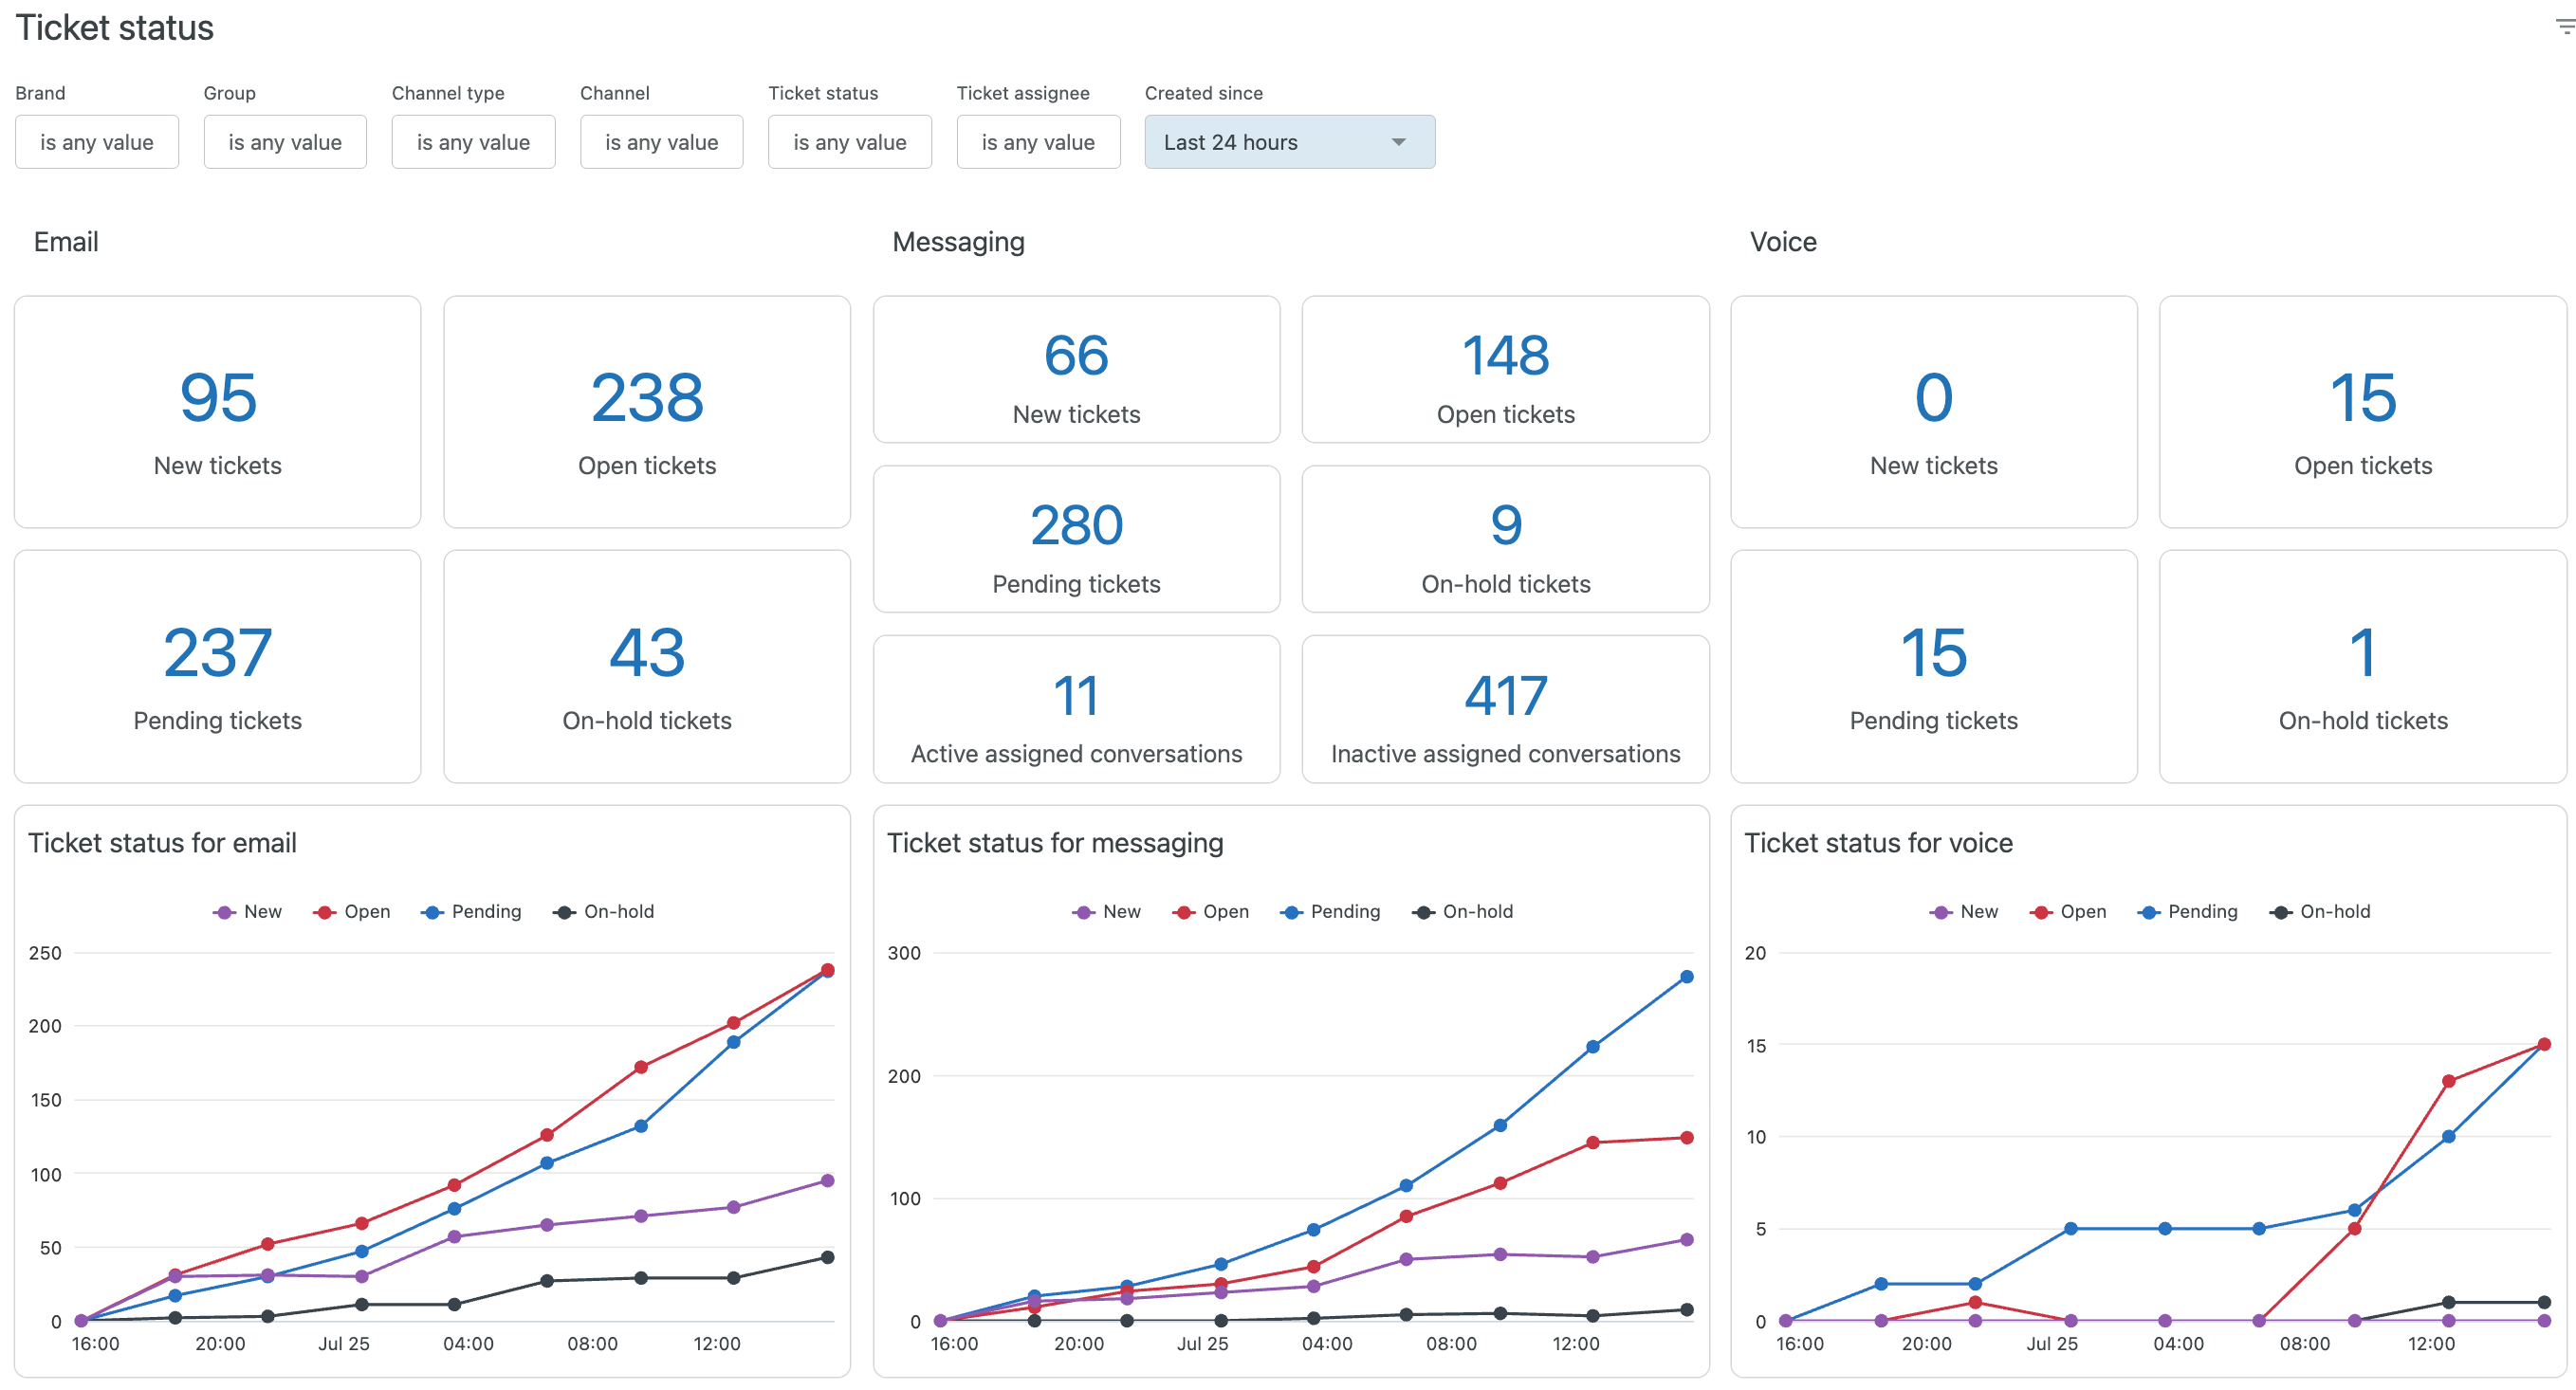
The tab contains the following reports:
- Email: Displays KPIs for your new, open, pending, and on-hold email tickets.
- Messaging: Displays KPIs for your new, open, pending, and on-hold messaging tickets.
- Voice: Displays KPIs for your new, open, pending, and on-hold messaging tickets.
- Ticket status for email: Displays the number of new, open, pending, and on-hold tickets for email tickets, over a period of time.
- Ticket status for messaging: Displays the number of new, open, pending, and on-hold tickets for messaging tickets, over a period of time.
- Ticket status for voice: Displays the number of new, open, pending, and on-hold tickets for voice tickets, over a period of time.
- Ticket status: Displays the number of new, open, pending, and on-hold tickets for each of your channels including social channels and sub-channels.
- Tickets in progress: Displays information about all of your open tickets including the ticket ID, assignee, brand, channel, and group.
You can drill in to a recent history point in time in order to see statuses of the tickets at that particular time. In this view you can see how long the ticket stayed in a status as well as its current status.
You can filter the reports by the last 15, 30, 60 minutes, since midnight (meaning you can report on "today"), the last 2, 8, 24, and 48 hours, and the last seven days.
Customer wait times
This tab gives you information about the time your customers are waiting for responses and resolutions. The reports can be filtered by brand, group, channel type, channel, ticket status, ticket assignee, and creation time.
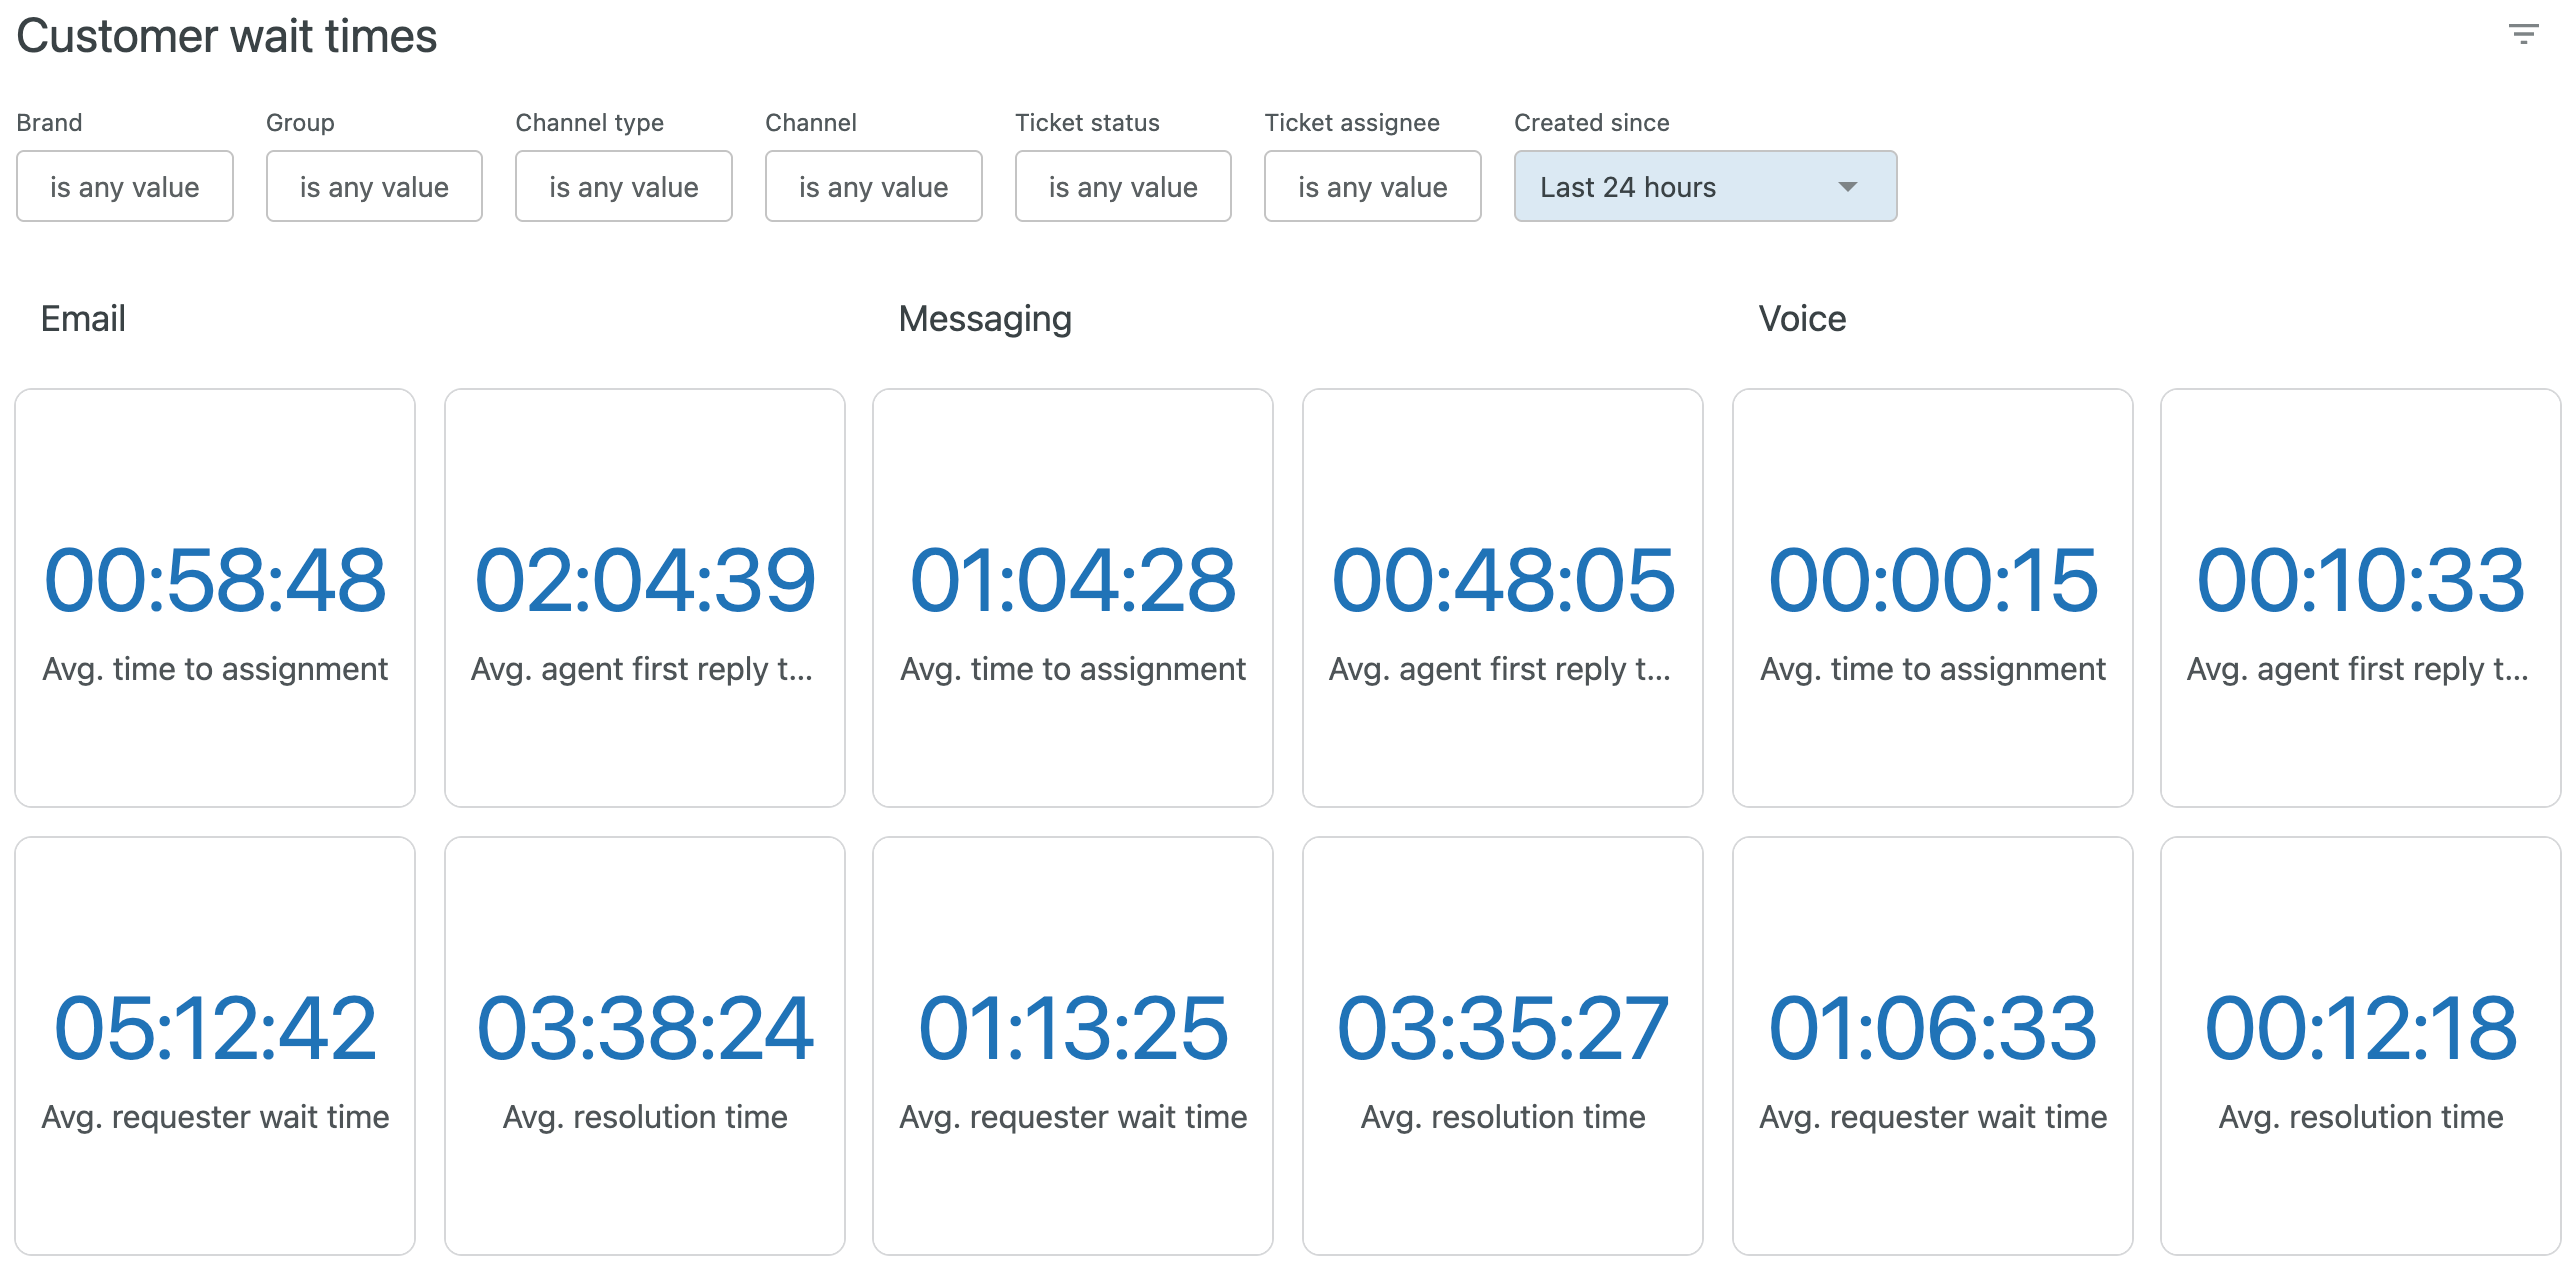
This tab contains the following reports for email, messaging, and voice:
- Avg. time to assignment: The average time between when a ticket was created and the first time it was assigned to an agent.
- Avg. agent first reply time: The average duration between when tickets were created and the first public agent reply on the ticket.
- Avg. requester wait time: The average time a ticket spends in the New, Open, and On-hold statuses.
- Avg. resolution time: The average duration from when the ticket was created to its latest resolution.
Ticket progress by brand
This tab gives you information about your email and messaging tickets sorted by brand. The reports can be filtered by brand, ticket group, channel type, channel, ticket status, ticket assignee, and created since time.
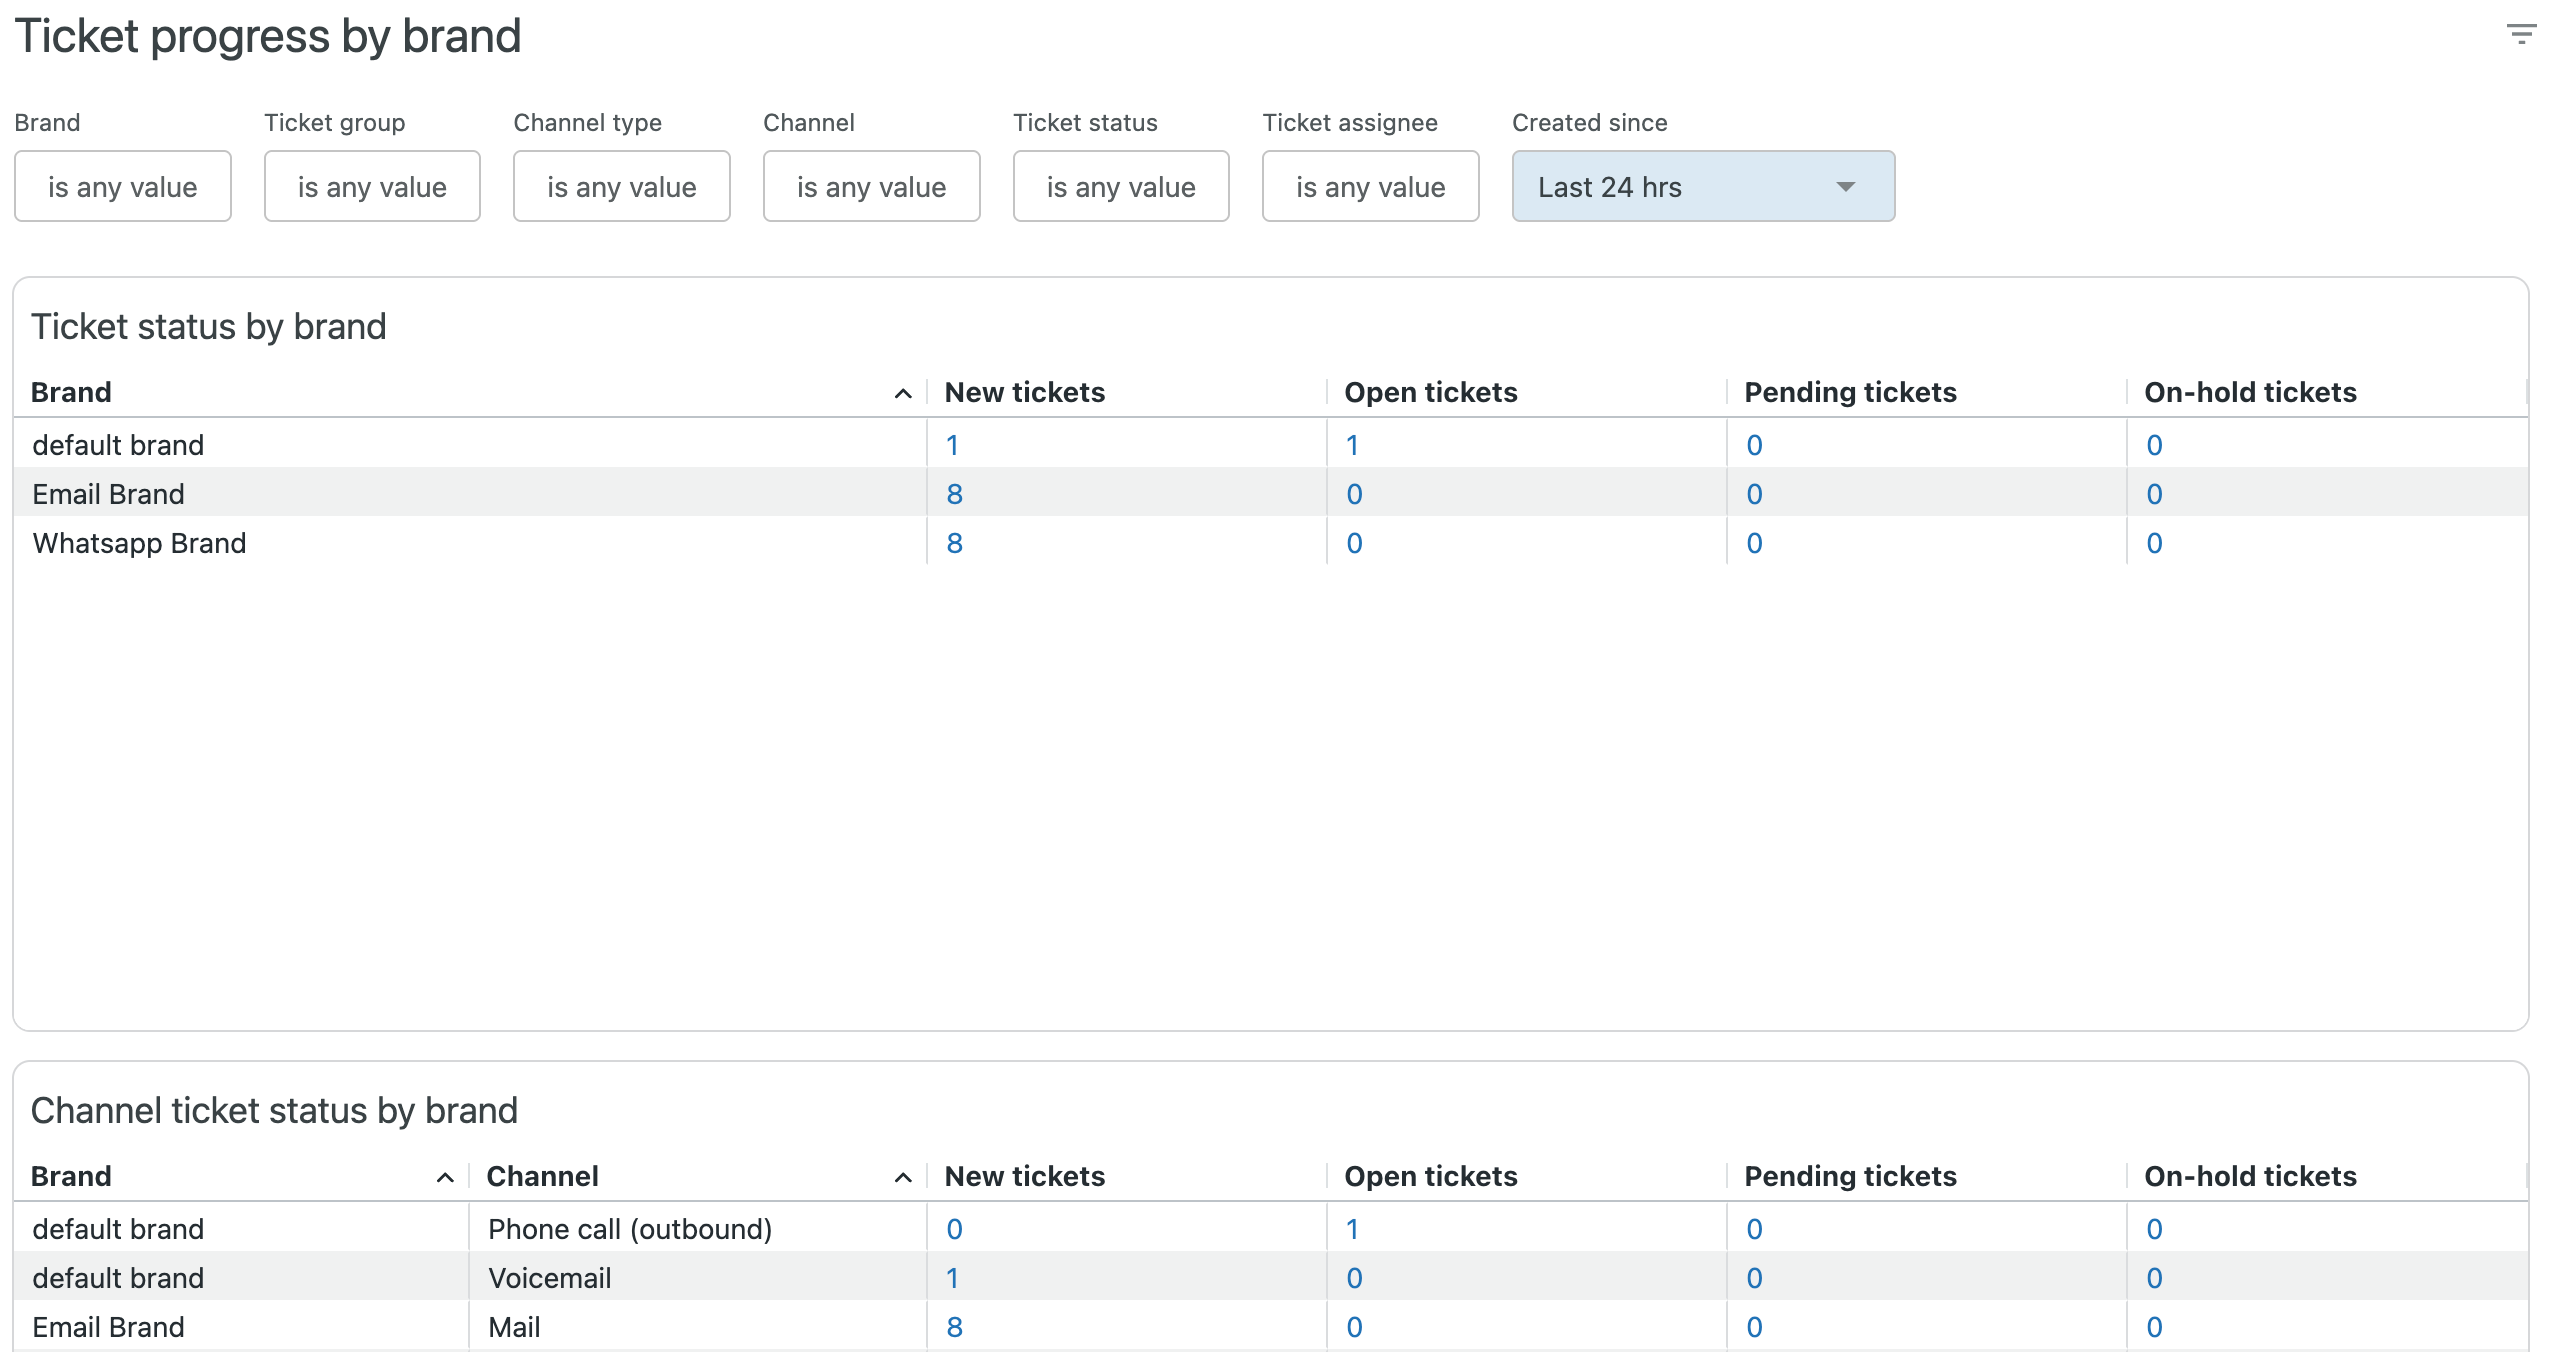
The tab contains the following reports:
- Ticket statuses by brand: For each of your brands, displays the brand name together with the number of new, open, pending, and on-hold tickets.
- Channel ticket status by brand: For each of your brands, displays the channel and the number of new, open, pending, and on-hold tickets.
- Messaging conversations by brand: For each of your brands, displays the number of active and inactive assigned conversations.
Ticket progress by group
This tab gives you information about your email and messaging tickets sorted by group. The reports can be filtered by brand, ticket group, channel type, channel, ticket status, ticket assignee, and created since time.
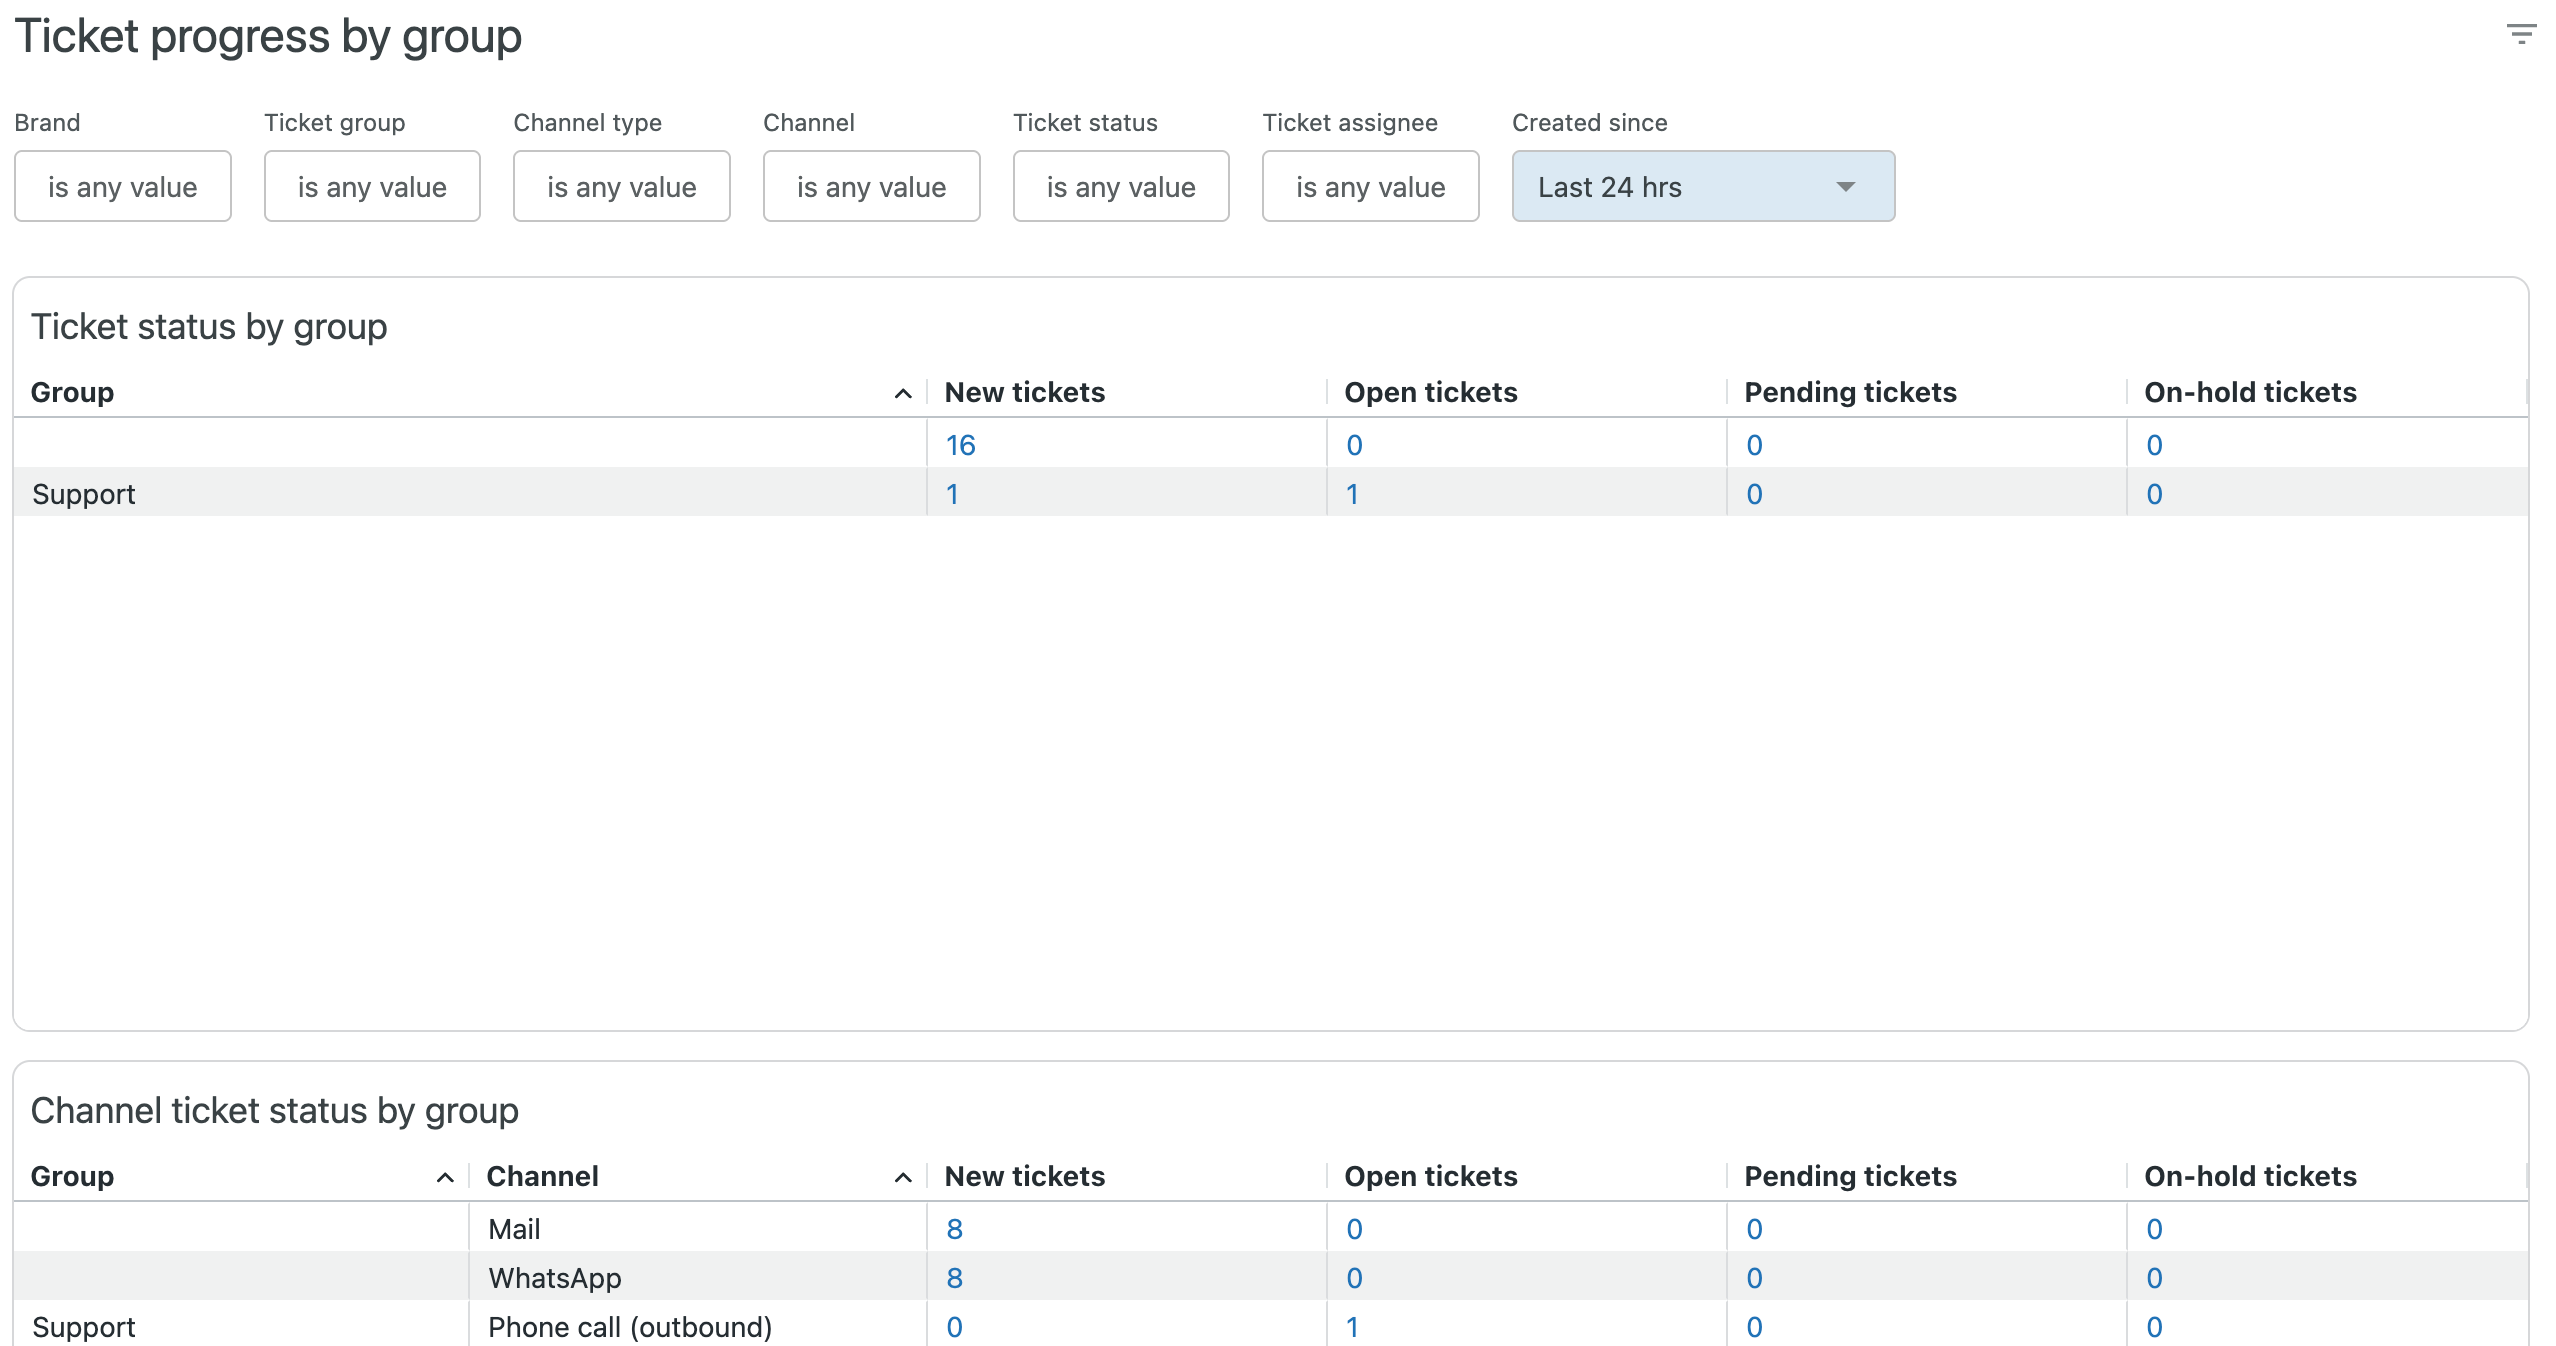
The tab contains the following reports:
- Ticket statuses by group: For each of your brands, displays the brand name together with the number of new, open, pending, and on-hold tickets.
- Channel ticket statuses by group: For each of your brands, displays the sub-channel and the number of new, open, pending, and on-hold tickets.
- Messaging conversations by group: For each of your brands, displays the number of active and inactive assigned conversations.
Agent productivity dashboard
The agent productivity dashboard gives you an overview of how your
agents and groups of agents are performing. In any dashboard, you can hide
or show the filters by clicking the filter icon (![]() ). You can click on any given agent
to be navigated to their agent profile.
). You can click on any given agent
to be navigated to their agent profile.
This dashboard contains the following tabs:
Agent availability
This tab gives you information about your agent's capacity and availability. The reports can be filtered by brand, group, agent, agent status, channel type, and channel.

The tab contains the following reports:
- Agents available for email: The number of agents that are available for email support. You can drill into this report to see more details about the available agents.
- Agent capacity for email: A pie chart showing the percentage of agents who are already using the email channel, and how many are available for email support.
- Agents available for messaging: The number of agents that are available for messaging support. You can drill into this report to see more details about the available agents.
- Agent capacity for messaging: A pie chart showing the percentage of agents who are already using the messaging channel, and how many are available for messaging support.
- Agents available for voice: The number of agents that are available for voice calls. You can drill into this report to see more details about the available agents.
- Agent capacity for voice: A pie chart showing the percentage of agents who are already using the voice channel, and how many are available for voice support.
- Agent overview: A detailed breakdown of your agent’s status showing their online status for each channel. You can click any number under Number of agents to see the names of the agents in that status.
Agent productivity by brand
For each of your brands, this tab gives you information about your agent's capacity and availability. The reports can be filtered by brand, group, agent, agent status, channel type, and channel.

The tab contains the following reports:
- Agent availability and tickets assigned by brand: For each of your brands, displays the brand name, assigned tickets, and agents available and capacity in use for email, messaging, and voice.
Agent productivity by group
For each of your groups, this tab gives you information about your agent's capacity and availability. The reports can be filtered by brand, group, agent name, agent status, channel type, and channel.

The tab contains the following reports:
- Agent availability and tickets assigned by group: For each of your groups, displays the group name, assigned tickets, and agents available and capacity in use for email and messaging.
Current limitations
The following limitations currently apply when using the real time monitoring dashboards:
- Drill-in to recent historical data is not available.
- To see the incoming tickets dashboard, omnichannel routing must be turned on.
- You can't change agent state from dashboards.
- You can't use multi-filtering for recent historical data.
- Real time monitoring reports only on tickets created in the last 90 days. A full view is available in historical reporting.
- The new dashboards are read-only. You can't customize the dashboards beyond applying filters and drilling-in to data.
- Dashboards show only filter options for active attributes, for example, queues with tickets or groups with assigned work items.
- Data retention for these dashboards may be subject to change depending
on performance and scalability.
- The ticket progress dashboard reports on activity relating to tickets created in the past 7 days.
- The agent productivity dashboard reports on all used capacity, regardless of the assignment time.
- Initially, while we monitor performance and scalability, KPIs and tables will have a refresh rate of 20 seconds.
- Tables are limited to 100 rows of data whilst drill-in tables are limited to 500 rows while we monitor performance and scalability.
- If no maximum capacity is assigned to an agent, no data will be shown in the capacity used KPIs in the agent availability dashboards.
- The agent capacity widget will not render for agents with zero max capacity.
- The agent capacity widget will not render if the agent name filter is selected with an agent name that contains special characters.
- Dashboard sharing is not possible during this EAP.
- Tickets created before a certain date, which haven't been updated since, might have some missing information (for example, first assignment time) until the next ticket update.
- If an agent initiates a call from an email ticket, this will use the agents voice capacity. However, this will surface in the drill-in for agent used capacity for voice as an email ticket. Therefore, there might be instances where not all capacity in use for voice is shown by only filtering for Voice under the channel type filter.
- Table sorting will override on dashboard refresh. This is a known limitation which is being worked on by our development team.