Recent searches
No recent searches
Knowledge Manager Roundtable: How do you measure self-service activity and knowledge base usefulness?

Posted Feb 12, 2018
The Knowledge Roundtable is a group of Zendesk customers who have some responsibility for the process of creating and managing content at their companies. They will share their expertise on a specific topic.
The topic this time is: How do you measure self-service activity and knowledge base usefulness?
Meet the panel and read their advice below:
- Sherri Anderson, Knowledge Manager, Bold Commerce
- Ben Garris and Sarah Boyd, KCS Program Manager - Solve Loop and KCS Program Manager, Republic Wireless
- Rebecca McMurry, Documentation Manager, Zift Solutions
- Andrei Kamarouski, Business Analytics Director and Co-founder, smm3
- Zac Garcia, Customer Care Operations, Fossil
- Mary Paez and Sahar Padesh, Knowledge Manager and Support Operations Manager, Veeva
- Melissa Burch, Online Support Manager, Zendesk
Be sure to add a comment to ask a question or share your ideas and workflow. And check out the complete list of KM Roundtable discussions.
Sherri Anderson
Knowledge Manager, Bold Commerce
What are you measuring?
- Top search terms
- Analyzing click-through rates on those search terms
- Percentage of users that use site search
- How many users refine their search
- Refined search terms
- How many users exit after search
- Time spent after search
- Average time spent on page
- Pages per session
- Average session duration
- Bounce Rate
- How many visitors use mobile and which devices
- Visitors per page
- Self Service Score
- Customer Feedback
- Heatmapping
- Site recording
Why do you measure it?
The search statistics are all done to analyze the effectiveness of search. The percentage of users that use the search is taken to determine how much time should be spent on improving the search experience. These stats help me to see what users are searching for and if they are finding what they need in a timely manner:
- Top search terms
- Analyzing click-through rates on those search terms
- How many users refine their search
- Refined search terms
- How many users exit after search
- Time spent after search
With this information I can tweak the keywords on the page, the page titles as well as the labels. You can see real-time search improvements when you make these adjustments and re-search the keywords like a customer would.
These statistics are used to determine if the content is easy to find and the articles are cross-linked well. Because of the nature of our site I want these stats to be low, which would indicate our visitors found what they needed quickly without the need to visit multiple pages:
- Average time spent on page
- Pages per session
- Average session duration
- Bounce Rate
How many visitors use mobile and which devices helps me to determine how much focus should be spent on the mobile experience and which devices I should be testing on.
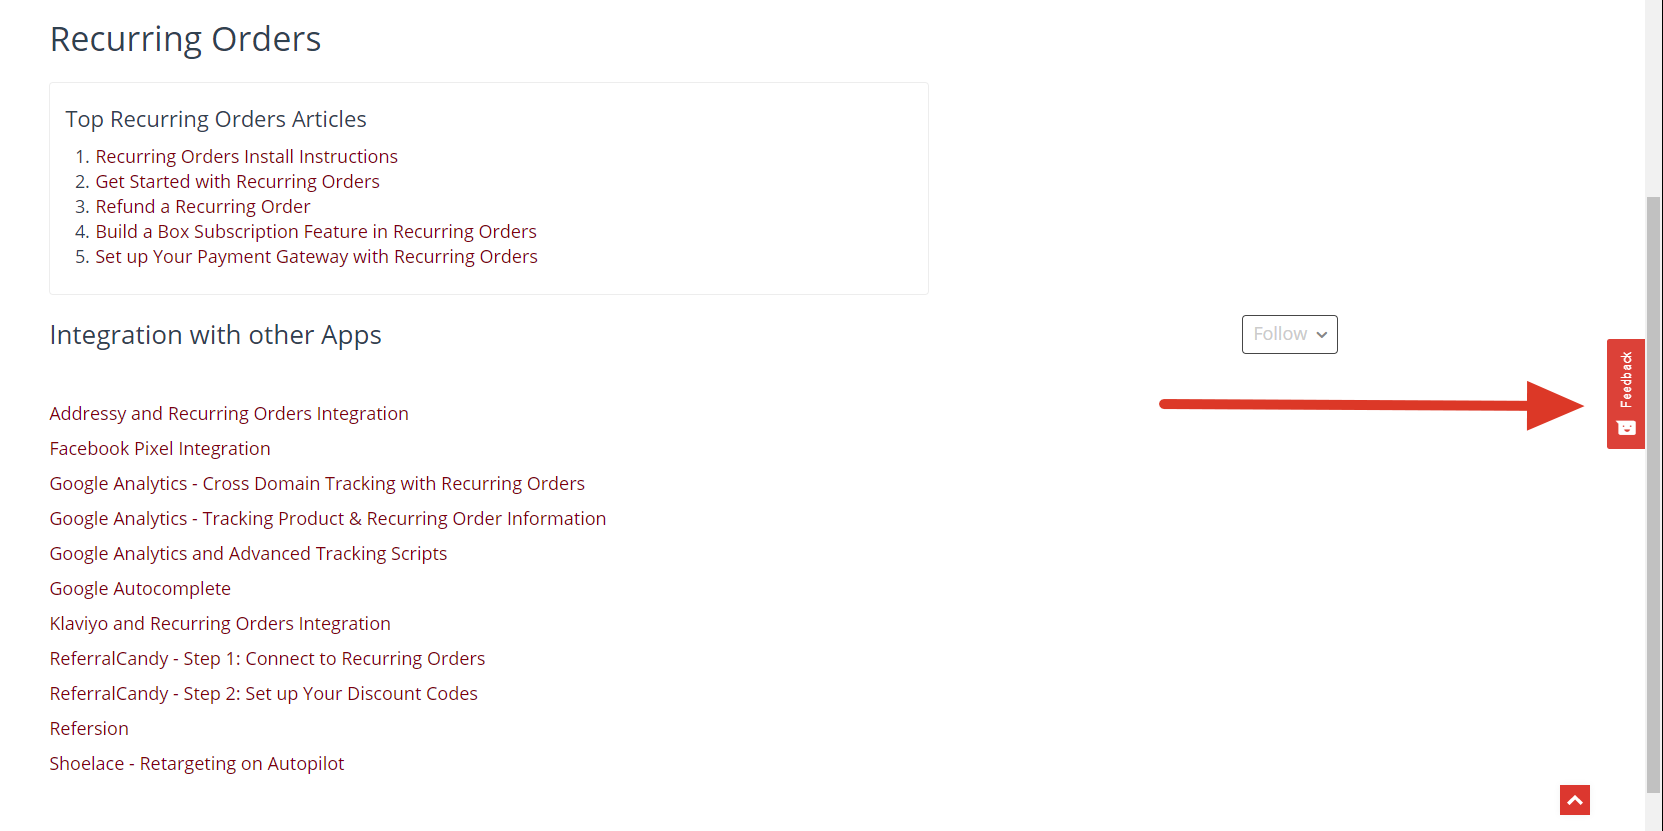
Visitors per page is used to determine the top help center articles, I have created a portal on the landing pages in the Help Center that displays the top articles for each category and this is done to assist our visitors in finding the most popular articles more quickly and for cross-linking related articles.
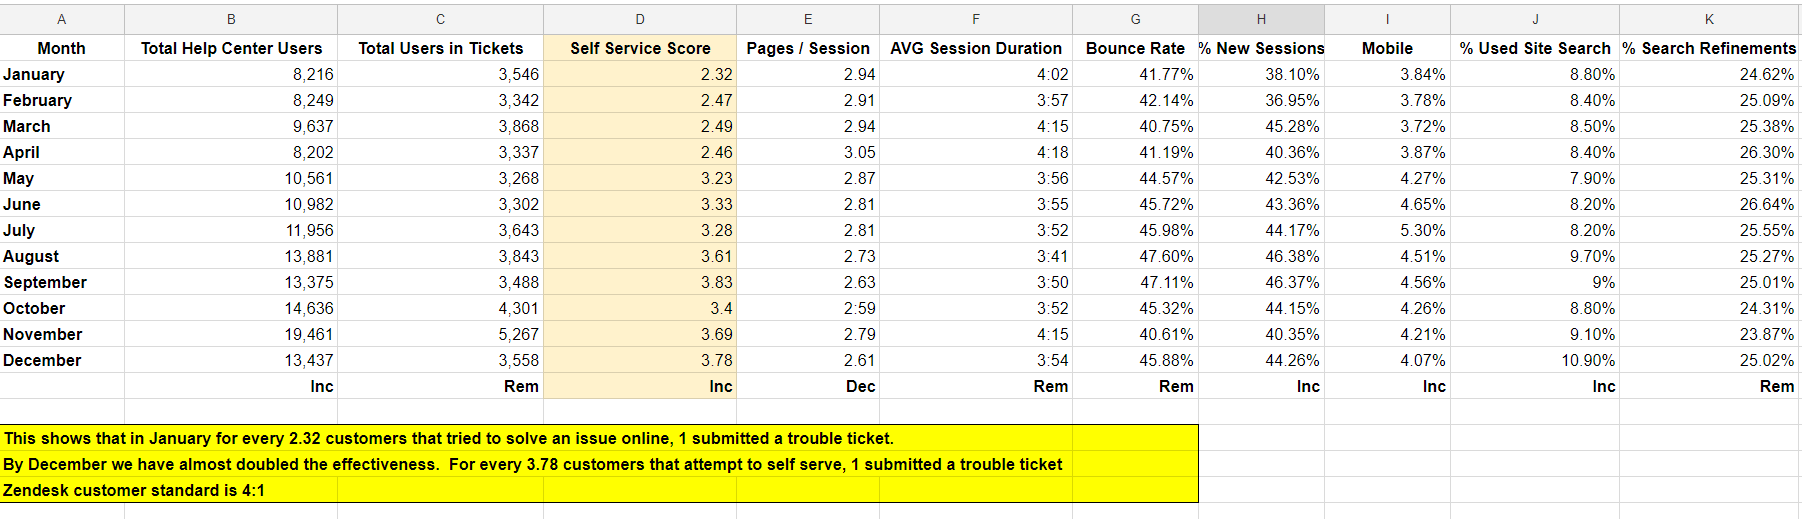
The Self-Service Score is used to measure the over-all effectiveness of the Help Center, I have been measuring this stat since I started here so it’s great to see how much the work I have done here has benefited the company. When I got here our Self-Service Score was 2.32:1 and it’s now 3.78:1 in less than a year (Industry standard is 4:1). This stat shows how many people submitted trouble tickets when compared to the number of visitors, so 1 in every 3.78 customers that visit our site submits a trouble ticket. This means I have almost doubled the effectiveness of the Help Center in less than a year, which in turn saves the company money because they do not have to hire additional Support staff as the Help Center is taking the place of Help Center employees.
Customer Feedback is used to get customer opinions on the Help Center. I use this to tweak the content on the pages to try to make the instructions easier for customers to follow.
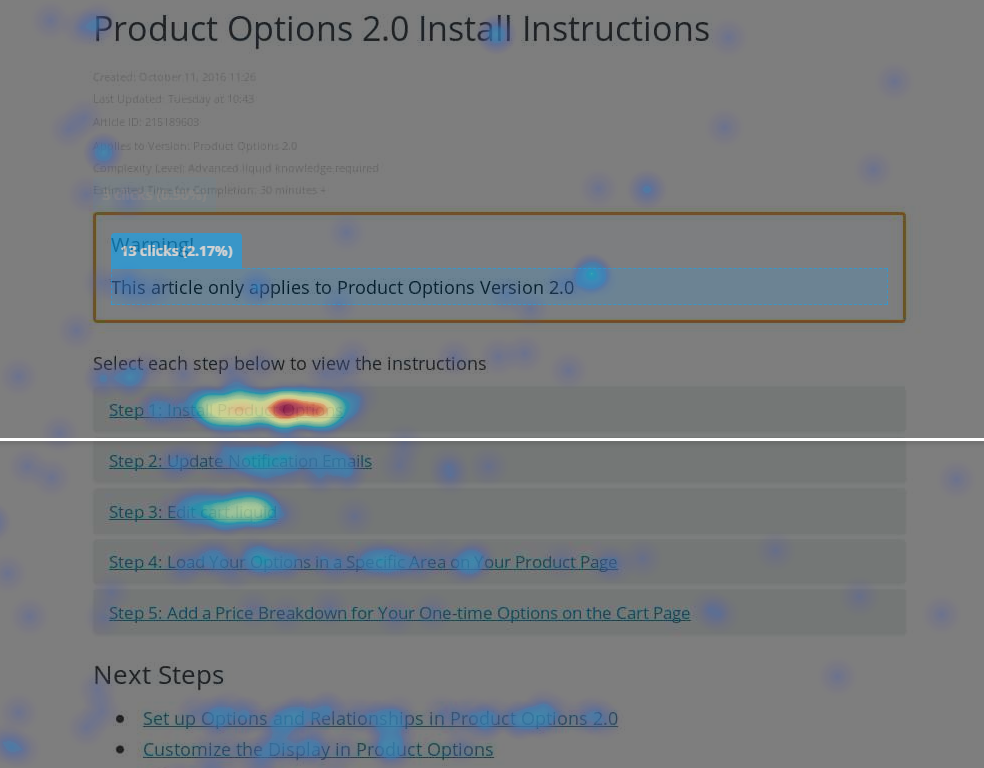
Heatmapping and site recording are done to determine how customers are using our site, this helps me determine how effective new features are that I have implemented and come up with ideas for new features in the future.
How do you measure it?
The analytics within Zendesk, Google Analytics and Hotjar are the three services I use to measure self-service activity and knowledge base usefulness. I used a Zendesk article to determine the self-service score and set up the stats I needed to determine the Self-Service Score.
This Google Analytics and Help Center article series was extremely helpful to me when coming up with my methods:
- Part 1 - Asking the right questions
- Part 2 - Measuring the effectiveness of search
- Part 3 - Tracking customers' actions
- Part 4 - Fine-tuning Help Center
- Part 5 - Capturing Help Center user data
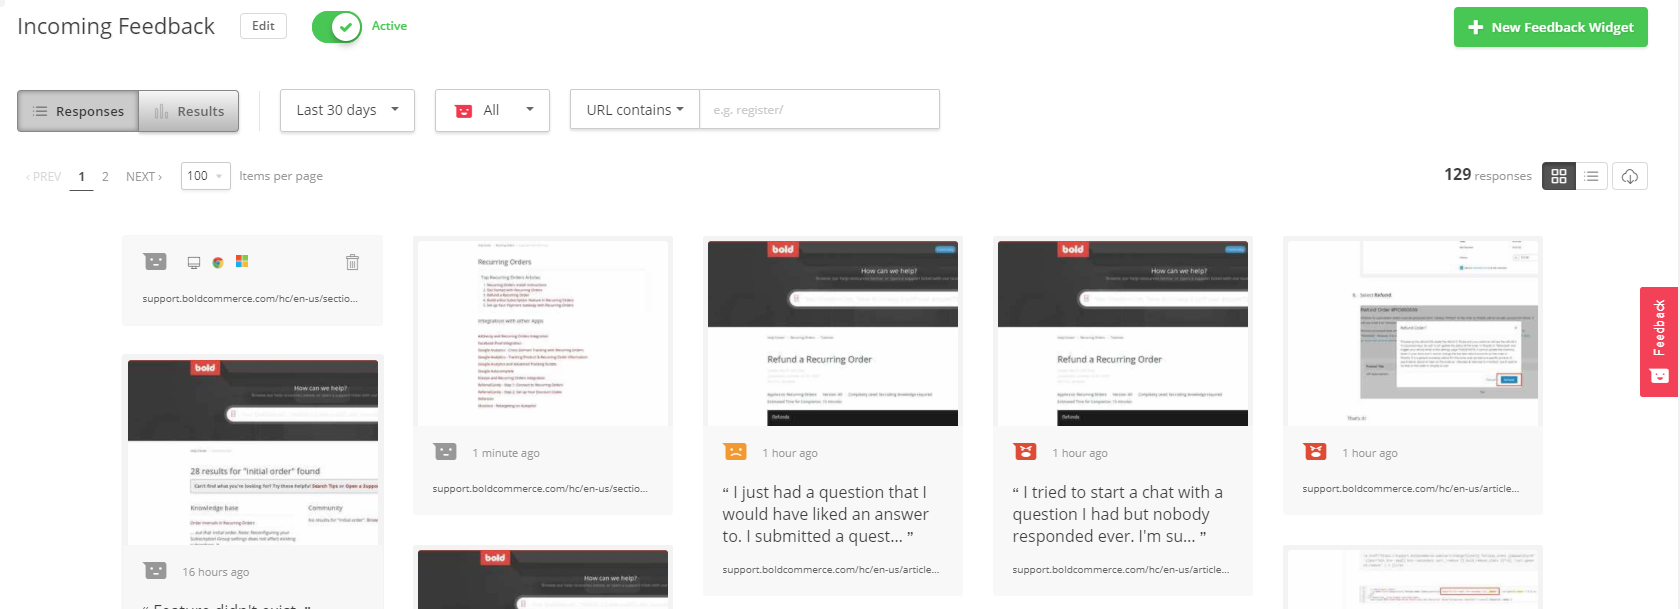
I use a service called Hotjar to create a Customer Feedback form which I added to every page on the site. I quite often receive feedback on our products and customer service reps instead of what I am looking for, but I am working on getting more useful information and the information I do receive on the Help Center has been very valuable.

I have also created heatmapping and site recording with this company which allows me to see how visitors are using our site. It does this by recording visitors, so you can view to scrolling and mouse clicks in a session.
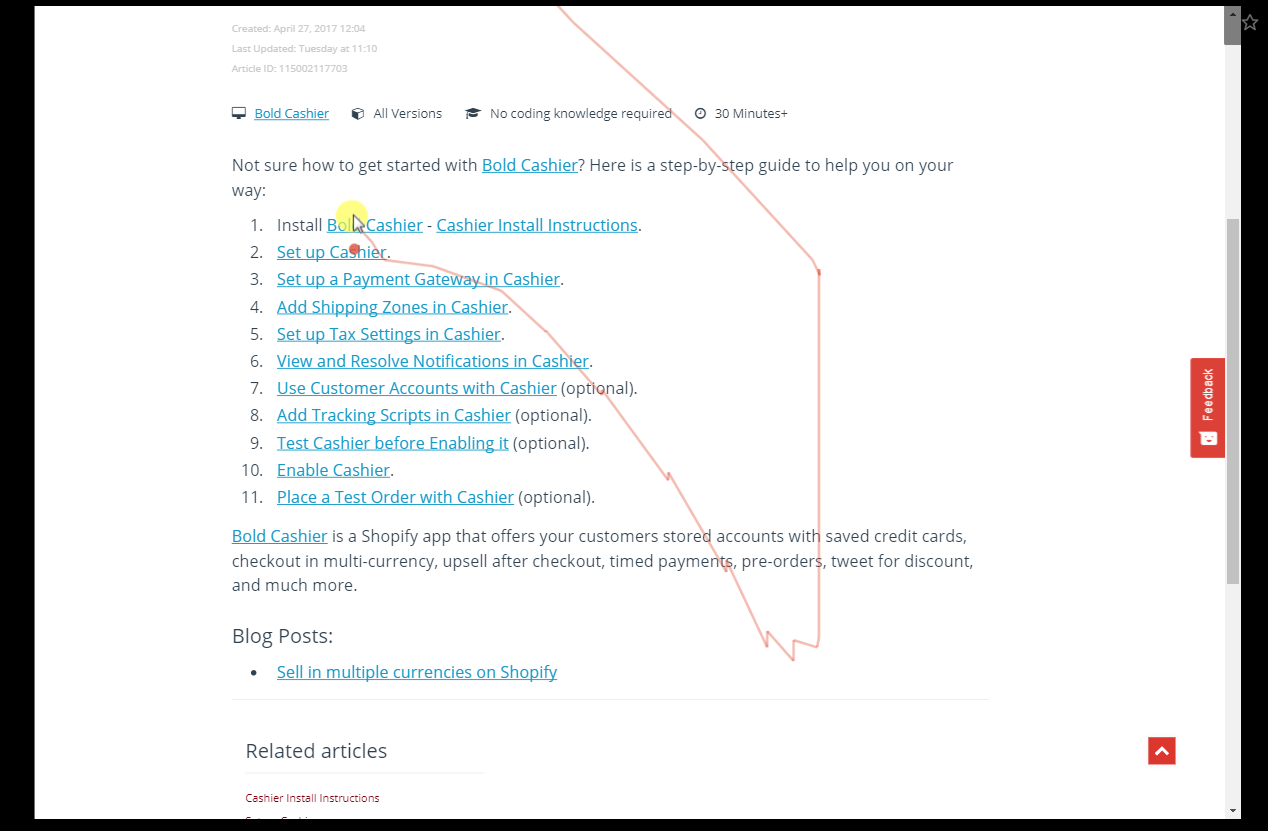
The heatmapping is a screenshot of the page with color heatmap so you can view what areas are used most.
Ben Garris and Sarah Boyd
KCS Program Manager - Solve Loop and KCS Program Manager, Republic Wireless
At Republic Wireless, self-service is a major part of our support organization. We define self-service success as the rate that customers indicate they completed their desired transactions and/or found useful information. Self-service success does not imply that the customer’s need for live assistance was fully satisfied. In addition, we define self-solve success as the rate that self-service resources and/or content eliminate a customer’s need for live assistance. These measures are extremely difficult to quantify, but we believe there are certain activities and outcomes that define what success looks like.
Our recent adoption of KCS (Knowledge Centered Service) has helped to reshape our knowledge base. This combined with an active peer-to-peer community has further transformed our approach to self service.
Having the end in mind and setting attainable goals to work toward is critical to ensure the long term success of a system. We’ve built a foundation at Republic through KCS which has allowed us to implement a sustainable, and effective, content engine that focuses not only on content creation, but maintenance and evolution of the content as well. We follow the KCS v6 Practices and Adoption guides to drive our efforts.
One of the key goals we work towards is known as the 85/85 goal. The KCS Adoption Guide defines this as “at least 85% of the time customers are using self‐service first and at least 85% of the time they are finding what they need”. This can only be achieved by having an extensive, yet focused knowledge base that is both accurate and easy to use. This is directly related to another goal known as the 90/0 goal which states that “90% of what the support organization learns from resolving issues is on the web within 0 minutes of becoming known.” This can be translated to say that anytime we learn something new, it’s immediately made available through self-service without any time lapse. While that may seem impractical, when you build knowledge creation into your solution workflow without unnecessary approval systems and bottlenecks, as described in the KCS methodology, it’s very feasible - once your system has matured.
To help us reach these goals, we measure various aspects of our program including:
-
Web to assisted support ratio - Ratio of web-based (knowledge base and community) sessions compared to tickets opened.
-
Participation rate - the percentage of assisted support sessions that result in a knowledge event (creation of new knowledge, or reuse of existing)
-
External publication percentage - percentage of knowledge base articles that are available externally
We’ve come to the conclusion that a single measurement and/or percentage for “Self-service success” is next to impossible to calculate, and ineffective at describing the true effectiveness. Focusing instead on the insights that we’re able to gather about the health and effectiveness of our content, as well as the trends we’re able to monitor, has proven to be more beneficial than a single statistical number.
Rebecca McMurry
Documentation Manager, Zift Solutions
What are you measuring?
We are measuring number of visits and number of unique visits monthly, quarterly, and yearly.
Why do you measure it?
We feel it shows our customer engagement
How do you measure it?
We rely on Google Analytics
What are you measuring?
New and returning visitors to the site
Why do you measure it?
I am interested to know if the content we provide appeals to both new and experienced users.
How do you measure it?
Google Analytics
What are you measuring?
It is not really a measure, Search Results
Why do you measure it?
We use the search results as an indicator of topics that may need to be added to the site. It might also be an indication that we need to add a tag to an existing article.
How do you measure it?
Google Analytics
Andrei Kamarouski
Business Analytics Director and Co-founder, smm3
To measure self-service activity and knowledge base usefulness systematically we are collecting relevant behavioral (what customers are doing) and motivational (what customers are feeling) data from four different data sources:
-
Default reporting in Zendesk (= behavioral data)
-
Web analytics data in Google Analytics (= behavioral data)
-
Self-service online survey in Google Forms (= motivational data)
-
Help Center related tickets in Zendesk (= motivational data)
Default reporting in Zendesk
Like many of Zendesk customers, we use data from Knowledge base dashboard in Reporting (views, votes etc). We have a dedicated Google spreadsheet where we monthly collect and review dynamics of all metrics from this dashboard. In particular, we pay attention to the following metrics:
-
Top 10 articles views volume and rank dynamics (this data helps to understand macro trends of support demand in our KB)
-
Top 10 KB search requests (this data helps to find gaps and to prioritize the KB content creation)
Web analytics data in Google Analytics
Web analytics data is very helpful in getting a more detailed view of KB usage state and trends. We are playing with many reports there; several metrics are used for monthly internal KPI related reporting, such as the following ones:
-
KB 'effective' sessions. 'Corrected' version of default article views that is used for calculating tickets deflection; in fact Google Analytics shows that many views are 'empty' while they have Session duration less than 10 seconds or only 1 page visited; that's why we have created a special segment to track sessions with at least 3 visited pages during at least 3 minutes and count them as deflected tickets/calls.
-
'KB search' and 'New ticket' goals. These goals allow us to understand behavioral aspects of using search and navigating through KB as well as creating new tickets during this searching activity.
Self-service online survey in Google Forms
Visitors of our Help Center are asked to fill short post-visit online-survey about the overall quality of the service they received (we are using top bar notification for this). This survey includes the following questions:
-
How satisfied are you today with your Help Center experience?
-
What were you looking for?
-
Did you find what you were looking for?
-
Rate your: (a) search experience, (b) article completeness, (с) articles readability, (в) ticket submission experience.
-
How likely is it that you would recommend our company to a friend or colleague? (that's the classical NPS question).
-
Your comments and suggestions for improving your Help Center experience (open text question)
Using this data we are able to better understand why people are visiting our Help Center and how successful are they there.
Interesting fact: Very often people are satisfied with their Help Center experience but wouldn't recommend the brand (are Detractors in terms of NPS methodology). In general, knowing this global attitude to the brand (NPS rating) allows us carefully evaluate survey results and hidden motivations behind survey responses.
Help Center related tickets in Zendesk
This is a comparatively rare source of information but we receive several tickets about HC experience monthly. Very often they give us direct feedback on unexpected issues by using Help Center.
Collecting and merging information from these data sources allows us to get the nearly complete picture of our Help Center customer experience. We are very excited about Zendesk's last improvements in this area; first of all Knowledge Capture app and related analytics as well as Answer Bot and its analytics.
That’s all for today folks. Happy measuring!
Zac Garcia
Customer Care Operations, Fossil
We use the Web Widget to enable self service online. We measure the effectiveness of this widget in three ways using the built in reporting dashboards.
First, we measure search activity: how many searches are being executed on the widget and what are the top search terms? Are we getting an acceptable number of clicks as a result? We might find that some top search terms get search results, but low click through rate. If so, we’ll reconfigure the articles to promote clicks where applicable (though there are some cases where our guests need to talk to a live individual, and we want to make sure those who do can skip right past the articles as needed).
Second, we look for searches with no results. We actually noticed users would type greetings into the search box, expecting it to immediately start a live chat conversation. While we are excited to connect with our customers, we also want to make sure the content is readily available to them. We weren’t sure every visitor realized what’s available at their fingertips, so we tailored some articles to those greeting phrases and used them to point site visitors back to the article search as a primary resource.
Finally, we measure inbound tickets via the Web Widget. How many tickets coming through the widget could have been deflected with better article targeting? We use a combination of Views and Insights reporting to sort through these tickets.
Our goal is to make sure the guests who need our help can reach us, but those who have a question we can answer proactively are able to serve themselves to find the fastest resolution, before ever having to reach out. This is one of the many steps we take to make sure we’re providing the best possible experience.
Mary Paez and Sahar Padesh
Knowledge Manager and Support Operations Manager, Veeva
- # KB articles published
- # KB article accesses on portal
- # KB article usage in Answer Bot
- # KB article usage in Knowledge Capture to close tickets
- # support tutorial videos created
- extra activities in KM & KCS including KCS certification, Coaching, or Knowledge Domain Expert
Melissa Burch
Online Support Manager, Zendesk
What are you measuring?
- Increase HC interactions
- Increase repeat users in HC
- Deliver more resolutions web ticket form and Answer Bot
- Reduce channel switches from HC to Ticket
- Maintain a 24hr or less response in Community
- Increase KCS to 50%
- Increase proactive interactions with Outbound
Why are you measuring it?
- Keep content up to date and relevant with KS (KCS)
- Drive community engagement
- Improve user experience in Help Centers
How are you measuring it?
- Native reporting
- Data warehouse and custom reports
- Installed Pendo on Help Centers
0
11 comments
Sherri Anderson
Great article, lots of VERY useful information.
0
Brandon, Rob
Great info in here. I'm interested in the overall success of a help centre and the measurement of reduced help tickets. We can see reduced webforms submitted and relate that to orders but a customer could easily pick up the phone or start a chat. How is this overcome in your areas? We've considered additional reporting so if a customer clicks on live channel support they would not be included as a deflected contact. Thanks, Rob
0
Zac Garcia
@Rob-
I would focus on categorizing your inbound requests (including via phone and chat). Can you tag those interactions in some way? I would then correlate them to the content available in your Help Center- does the Help Center a) contain content that would deflect that type ticket, b) is it understandable to the user, and c) is it served it in such a way that your audience can discover it when they need to?
I would then try to understand the user journey of the people who have called or chatted you. Chat clients often give you visibility into clicks on your site prior to a visitor initiating a chat, and you may be able to get some ad-hoc Q & A done by your agents during a phone support interaction to find out if the requester tried to self serve. Did they have trouble finding what they needed? Did they find an article but deem it unhelpful? What elements do they have in common, and how can you learn from those journeys to better position your help content?
By doing this, you can focus on deflection by contact type. This helps you piecemeal your strategy and keep you from taking on too much at once, and also avoids the pitfall of looking for direct conversions from Help Center -> Tickets (a pitfall you described in your post).
In general it's hard to measure contacts that are deflected away from a non-integrated channel (like phone and potentially chat) because it's hard to tell from your Web audience who was a potential contact in the first place. You can measure with certainty which contacts were deflected from the Web form by Help Center suggestions, and also which contacts were deflected by Answer Bot, because you know for sure they were in the process of contacting you for help. In general, when looking beyond that, I think it's helpful to look at the trends described above, and also correlate your inbound phone and chat contacts with Help Center engagement overall to look for an inverse relationship.
As you notice reduced webforms submitted, you can also check if your top-line calls and chats are increasing - that'll give you an idea of the contacts are deflected or just driving to another channel.
I hope this is helpful!
0
Sherri Anderson
That's easier for us here because we don't really take phone calls and any voicemails that do come in are converted to tickets. If you record the number of incoming calls and incoming chats, which you must somehow. Why not just take those numbers, add those together and use the self-service score like this?
Self-service score = Total users of your help center(s) / (Total users in tickets + Total users in chat + Total users in calls)
I wouldn't include people who call in or submit a chat as people who tried to self-serve though.
0
Anton Maslov
Hi Rob, in our case, we automatically create tickets for chats and calls, what is kind of similar to your approach. Also "start chat" button is on Zendesk HC page, so basically in Google Analytics, we can see if a customer tried to search anything before starting the chat.
To evaluate help center success we use "call deflection". Basically, it is even possible to measure success in saved money to show the result to stakeholders: you calculate "deflection" to understand how much tickets avoided and multiple to ticket cost. Some links with general algorithm description:
http://library.serviceinnovation.org/Measurement_Matters - an official guide from KCS - check "CALCULATING CALL DEFLECTION" here.
http://www.dbkay.com/files/DBKay-SimpleTechniquesforEstimatingCallDeflection.pdf - a guide from KCS certified company.
0
Andrei Kamarouski
Hi Rob. I just want to add several points (thinking out loud) to the great experts' pieces of advice.
Old well-known call deflection idea (coming from the era of the assisted support when nearly 100% of support demand were satisfied via phone channel and full deflection was valuable) is a bit outdated in the world of the multichannel support and of the rising importance of holistic customer experience and engagement (deflection is a kind of 'serving'). Several important questions arise:
Collecting and combining data of WHAT is happening and WHY is this happening is challenging but very valuable to get the complete picture of support CX.
0
Ryan S Campbell
@Jennifer Rowe. How can I join the Knowledge Roundtable? I'm starting in a new role as Director Knowledge Management with a company who uses Zendesk and I would love to start connecting with my fellow Knowledge Management peers who use Zendesk.
0
Jennifer Rowe
Hi Ryan,
Thanks for your interest! I'll reach out to you via email today.
Thanks!
0
Jessie Schutz
Thanks for sharing your insight on this, Andrei!
0
Kourtney Stuthard
Hi everyone,
This roundtable has been incredibly useful to us, there's so much great information! We have started measuring our own Help Center metrics. Has anyone here used Data Studio? We are in the process of building our own and want to know if anyone can share examples of how they configured theirs.
Thanks!
0
Andrei Kamarouski
Hi Kourtney,
You probably mean Google Data Studio? Yes, I have used it several times for reporting on HC stats, collected via Google Analytics. You can have a lot of default metrics from GA + create specific metrics and events. Pls, refer to this article for more info.
P.S. Sorry if my reply is too late for you.
0