Recent searches
No recent searches
Tip: Year over Year Reporting Using "Running Year (Month)" Custom Attribute

Posted Jun 30, 2022
I wanted to share some steps I came up with for reporting ticket volume in a way that allows you to see % change year-over-year by month. This requires creating custom metrics and attributes in Zendesk Explore. Hope this is useful to some folks out there in Explore world!
1. Create a new custom metric called "Tickets Created - Current 12 Months (YoY)": Returns the total number of tickets submitted within the latest 12 month period. Here is the formula/code:
IF(DATE_GREATER_OR_EQUAL([Ticket created - Date], DATE_ADD(START_OF_MONTH(TODAY()), "year", -1)) AND DATE_LESS([Ticket created - Date],START_OF_MONTH(TODAY())))
THEN [Ticket ID]
ENDIF
2. Create a custom metric called "Tickets Created - Previous 12 Months (YoY)": Returns the total number of tickets submitted within the previous 12 month period. Here is the formula/code:
IF (DATE_GREATER_OR_EQUAL([Ticket created - Date], DATE_ADD(START_OF_MONTH(TODAY()), "year", -2)) AND DATE_LESS([Ticket created - Date],DATE_ADD(START_OF_MONTH(TODAY()), "year", -1)))
THEN [Ticket ID]
ENDIF
3. Create a custom attribute called "Running Year (Month)": This allows you to layer "Ticket created - Month" on top to see the comparison while maintaining the correct order for the months. Make sure you use the "Sort like a time attribute" checkbox when setting this up. Here is the formula:
IF(MONTH_NUMERIC([Ticket created - Date]) < MONTH_NUMERIC(TODAY()) AND YEAR([Ticket created - Date]) > YEAR(DATE_ADD(TODAY(), "year", -2)))
THEN CURRENT_YEAR()
ELSE CURRENT_YEAR() - 1
ENDIF
4. On your query, Add a Date Range filter to grab tickets created in the last 24 months.

5. Add your metrics to the query, first the "Current Year", then the "Previous Year".
6. Add your custom Running Year (Month) and Ticket created - Month attributes as rows. This should give you a nice table:

7. Use the "Result Metric Calculation" option to create a new YoY comparison metric. The formula there would be (Current Year - Previous Year) / Previous Year. Be sure to check the "Clear used metrics" option:

8. When the new metric loads, change the display format of the metric to %

The result is this:

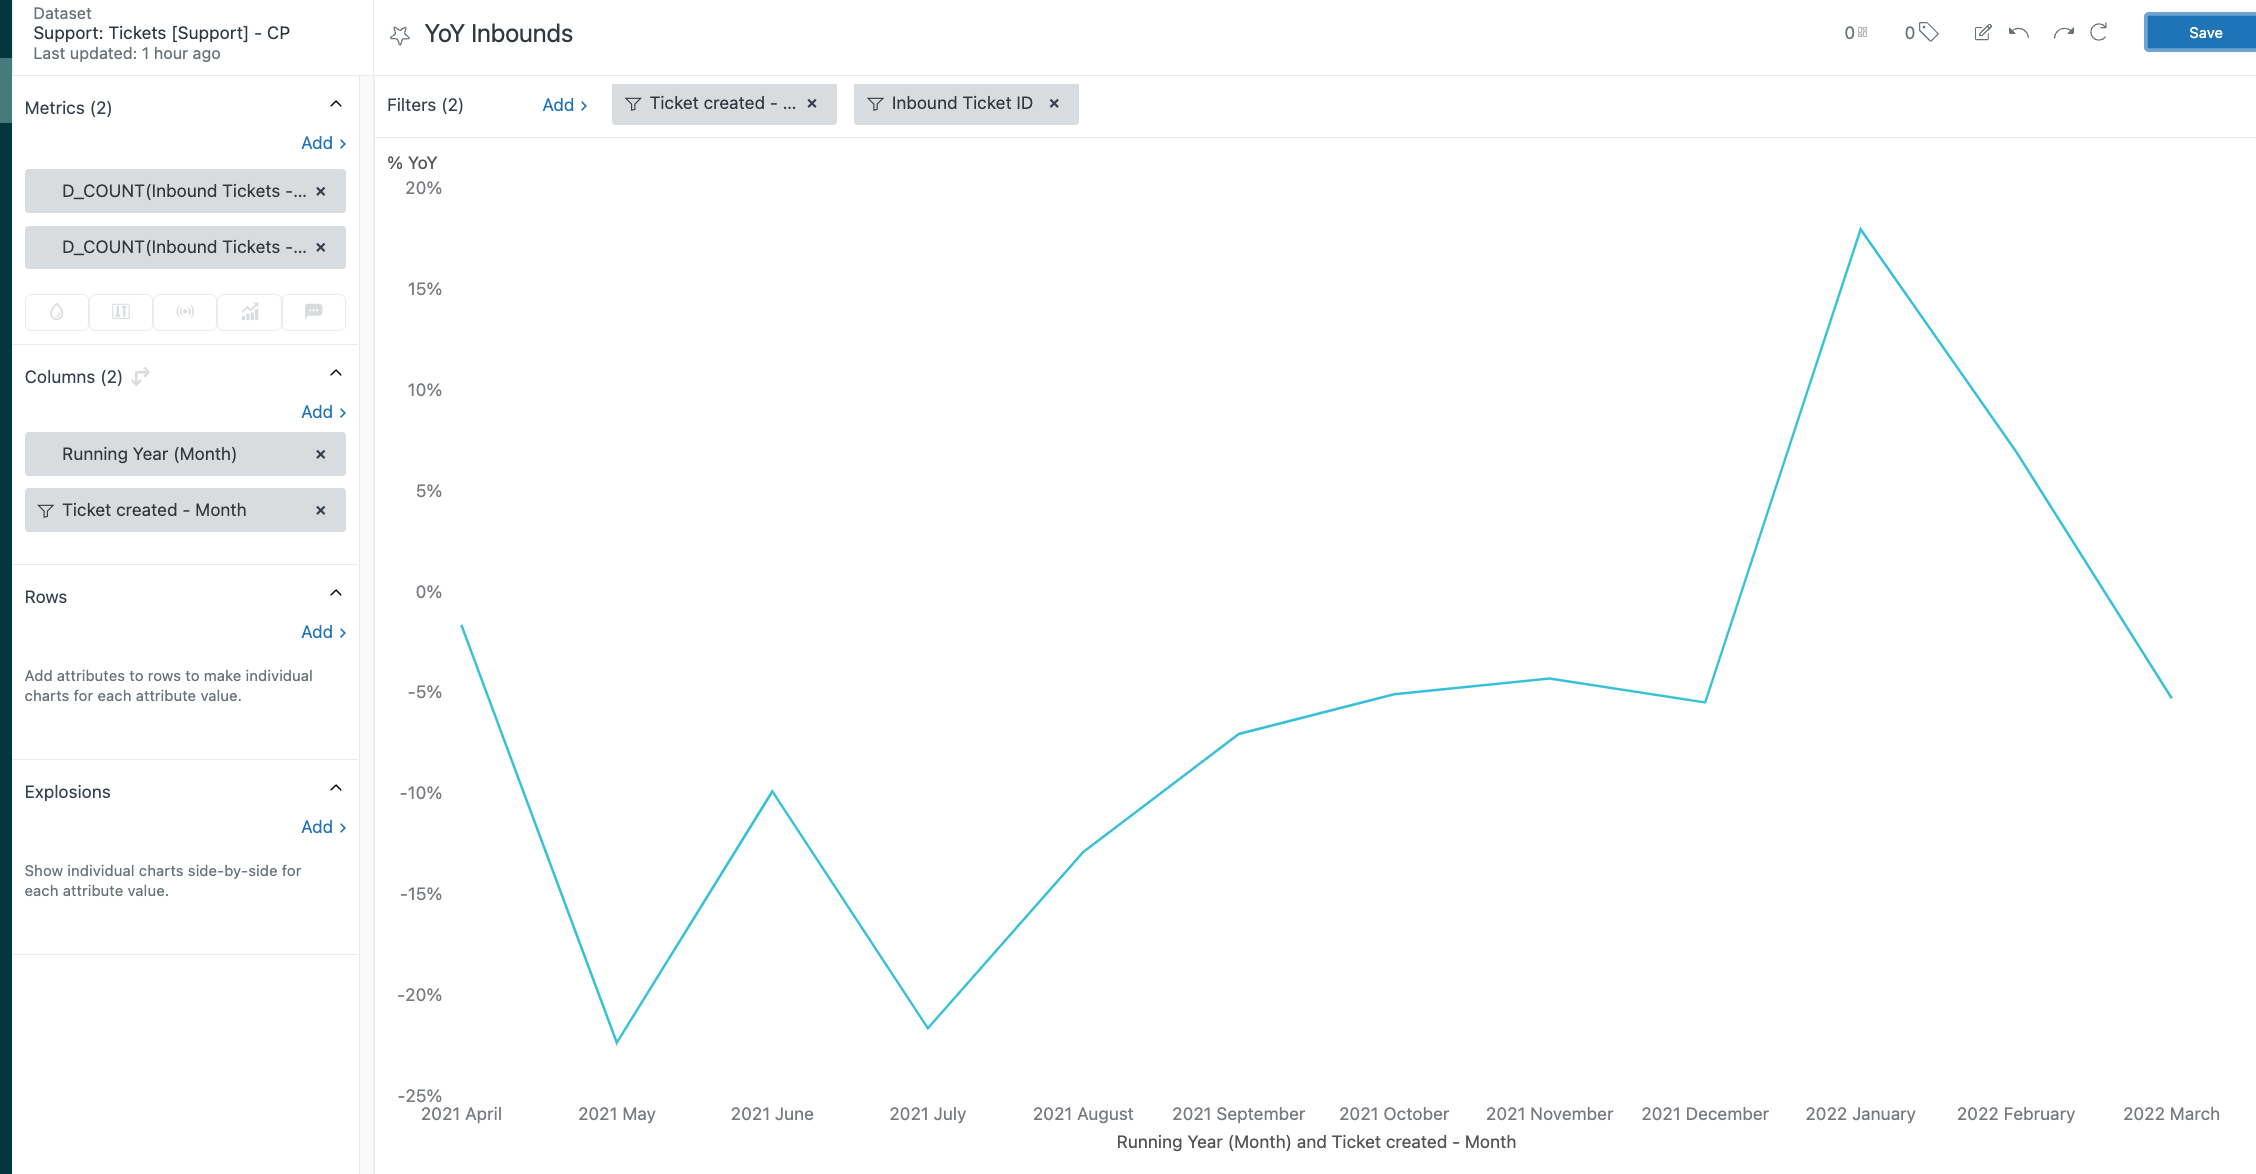
9. So now you have the core data to build this. To get it looking nice, toggle the columns/rows and change the chart type to Line
9. Duplicate your Tickets Created - Current 12 Months (YoY) metric. You can name this Tickets Created - Current 12 Months
10. Add the duplicated metric you just created as a dual-axis metric in the query builder. This should automatically set the dual metric as a column.

12. Do some clean-up/cosmetic work. I usually remove the "show applied filters" option, and I like to use the "multi-level" option on the x-axis, put the legend at the top, and display the values, etc.

Here's what my finished one looks like on my dashboard:

Good luck!
7
6
6 comments
Chris Wooten
Your second metric syntax comes up with an error now for some reason. Love this idea and would appreciate the help.
0
Crawford Philleo
Hey there - thanks for checking this out. I'm looking at the version on my own dashboard, and I see I'm using the `TODAY()` function instead of `NOW()`. Let me know if that fixes the issue - if not, it'd be helpful to know what error you're sseing.
Thanks!
0
Darryll Holmes
@Crawford Philleo
This returns an error:
What is the correct formula to use?
0
Brett Bowser
I think this may be because of a misplaced closing bracket. Can you try this formula?
IF (DATE_GREATER_OR_EQUAL([Ticket created - Date],
DATE_ADD(START_OF_MONTH(NOW()),"year",-2))
AND DATE_LESS([Ticket created - Date],
DATE_ADD(START_OF_MONTH(NOW()),"year",-1))
)
THEN [Ticket ID]
ENDIF
Hope his helps!
0
Robert
It's bonkers to me that a help article created by a ZD community manage returns an error in ZD Explore.
0
Crawford Philleo
Hey there - I think that the code blocks in the article were introducing some errors because of how the formulas were formatted. I usually put line breaks in Explore formulas so they are easier to read, but when I paste them into the article, then try to copy/paste them back into Explore again, they return an error for some reason. The formulas I originally wrote also used certain functions that have since started to return errors under certain circumstances, (following with recent updates to Explore under the hood), so I think they needed to be updated anyway.
I played around with this a bit, and it seems like I can paste the formulas into the HC article here if they are more inline style. I think these should work as they have been edited above (pending approval). I just created a test in my own instance, and it looks like it's working with the formulas written as follows:
Metric: Tickets - Current 12 months:
Metric: Tickets - Previous 12 Months:
Attribute: Running Year (Month):
Hope you're able to get this to work on your end!
0