Búsquedas recientes
No hay búsquedas recientes

Le blagueur masqué
Incorporación 15 abr 2021
·
Última actividad 27 dic 2023
Seguimientos
0
Seguidores
0
Actividad total
5
Votos
0
Suscripciones
2
RESUMEN DE LA ACTIVIDAD
INSIGNIAS
ARTÍCULOS
PUBLICACIONES
COMENTARIOS DE LA COMUNIDAD
COMENTARIOS DE ARTÍCULOS
RESUMEN DE LA ACTIVIDAD
Última actividad de Le blagueur masqué
Le blagueur masqué hizo un comentario,
No reply from Zendesk ? Regarding customer support, far from being acceptable..
Ver comentario · Publicado 17 jun 2021 · Le blagueur masqué
0
Seguidores
0
Votos
0
Comentarios
Le blagueur masqué creó una publicación,
Hello,
Making a chart with date in X axys with the number of tickets may be not really relevant as somedays you have less more tickets (sunday for example) and so it's difficult to see clearly a trend.
The trend with the pandemic and figures related is the 7 day average, for example on Google :
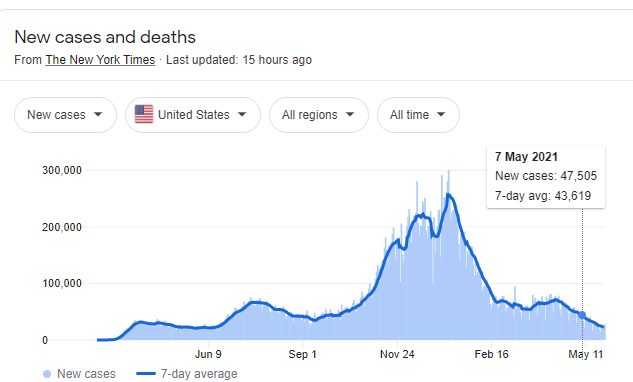
I am trying to do that on Explore (for each day compute an average on the last 7 days) but I did not find a way to do it (don't know if it is possible).
Does someone succeed to do a such metric ?
Thanks
Publicado 28 may 2021 · Le blagueur masqué
0
Seguidores
4
Votos
4
Comentarios
Le blagueur masqué creó una publicación,
Hello,
I am trying to use a date range calculated metric in a standard one but I don't succeed.
I have my two metrics :

The first one is a date range calculated metrics wich give me the first reply time for yesterday :

The other one is a "basic" one which is only the average of the first result :


Results are not the same. Do you know how to use a date range calculated metric in a standard calculated metric ?
Thanks,
Publicado 28 dic 2020 · Le blagueur masqué
0
Seguidores
2
Votos
1
Comentario