Recherches récentes
Pas de recherche récente

Mike Jenkins
Adhésion le 15 avr. 2021
·
Dernière activité le 07 mars 2023
Suivis
0
Abonnés
0
Activité totale
12
Votes
3
Abonnements
4
APERÇU DES ACTIVITÉS
BADGES
ARTICLES
PUBLICATIONS
COMMENTAIRES DE LA COMMUNAUTÉ
COMMENTAIRES SUR L’ARTICLE
APERÇU DES ACTIVITÉS
Dernière activité effectuée par Mike Jenkins
Mike Jenkins a créé une publication,
So we are trying to find best practices for measuring agent productivity. With our support it can be feast or famine at times and it fluctuates due to unforeseen events. Since that is the case, most of our agents have side tasks, some within Zendesk but some outside of Zendesk.
We are trying to measure the amount of time they are working on tickets and the accuracy. We have had numerous discussions of comments per hour vs tickets per hour vs solved tickets per hour. Due to the complexity of tickets, it is not uncommon for one agent to answer a ticket within a minute where another agent will take 5-10 minutes depending on situation. We want to measure equally so we can have a better idea of their productivity.
We are using the Time Tracking App but it seems the accuracy is not as easy to gather information as we would like.
We are looking for ideas of how best to track their productivity so we can make growth decisions and to know they are being productive.
Publication le 07 mars 2023 · Mike Jenkins
0
Abonnés
7
Votes
2
Commentaires
Mike Jenkins a ajouté un commentaire,
This is awesome and wish it was just a built in feature. I do have one little bug. I have to click NO twice before the pop up button shows up. Any idea what could cause this?
Afficher le commentaire · Publication le 04 mai 2021 · Mike Jenkins
0
Abonnés
1
vote
0
Commentaire
Mike Jenkins a ajouté un commentaire,
So I have been trying to create a report that displays the First Reply Time broken down by:
% 1-10 min
% 11-20 min
% 21-30 min
% 31 minutes to 1 hour
% 1-4 hours
% 4-8 hours
% 8-23 hours
% 24 hours plus
Then it would be stacked in columns by the week of the year with the totals equaling 100% of tickets for that week. (each stack would contain the time of first reply) It would look something like this:
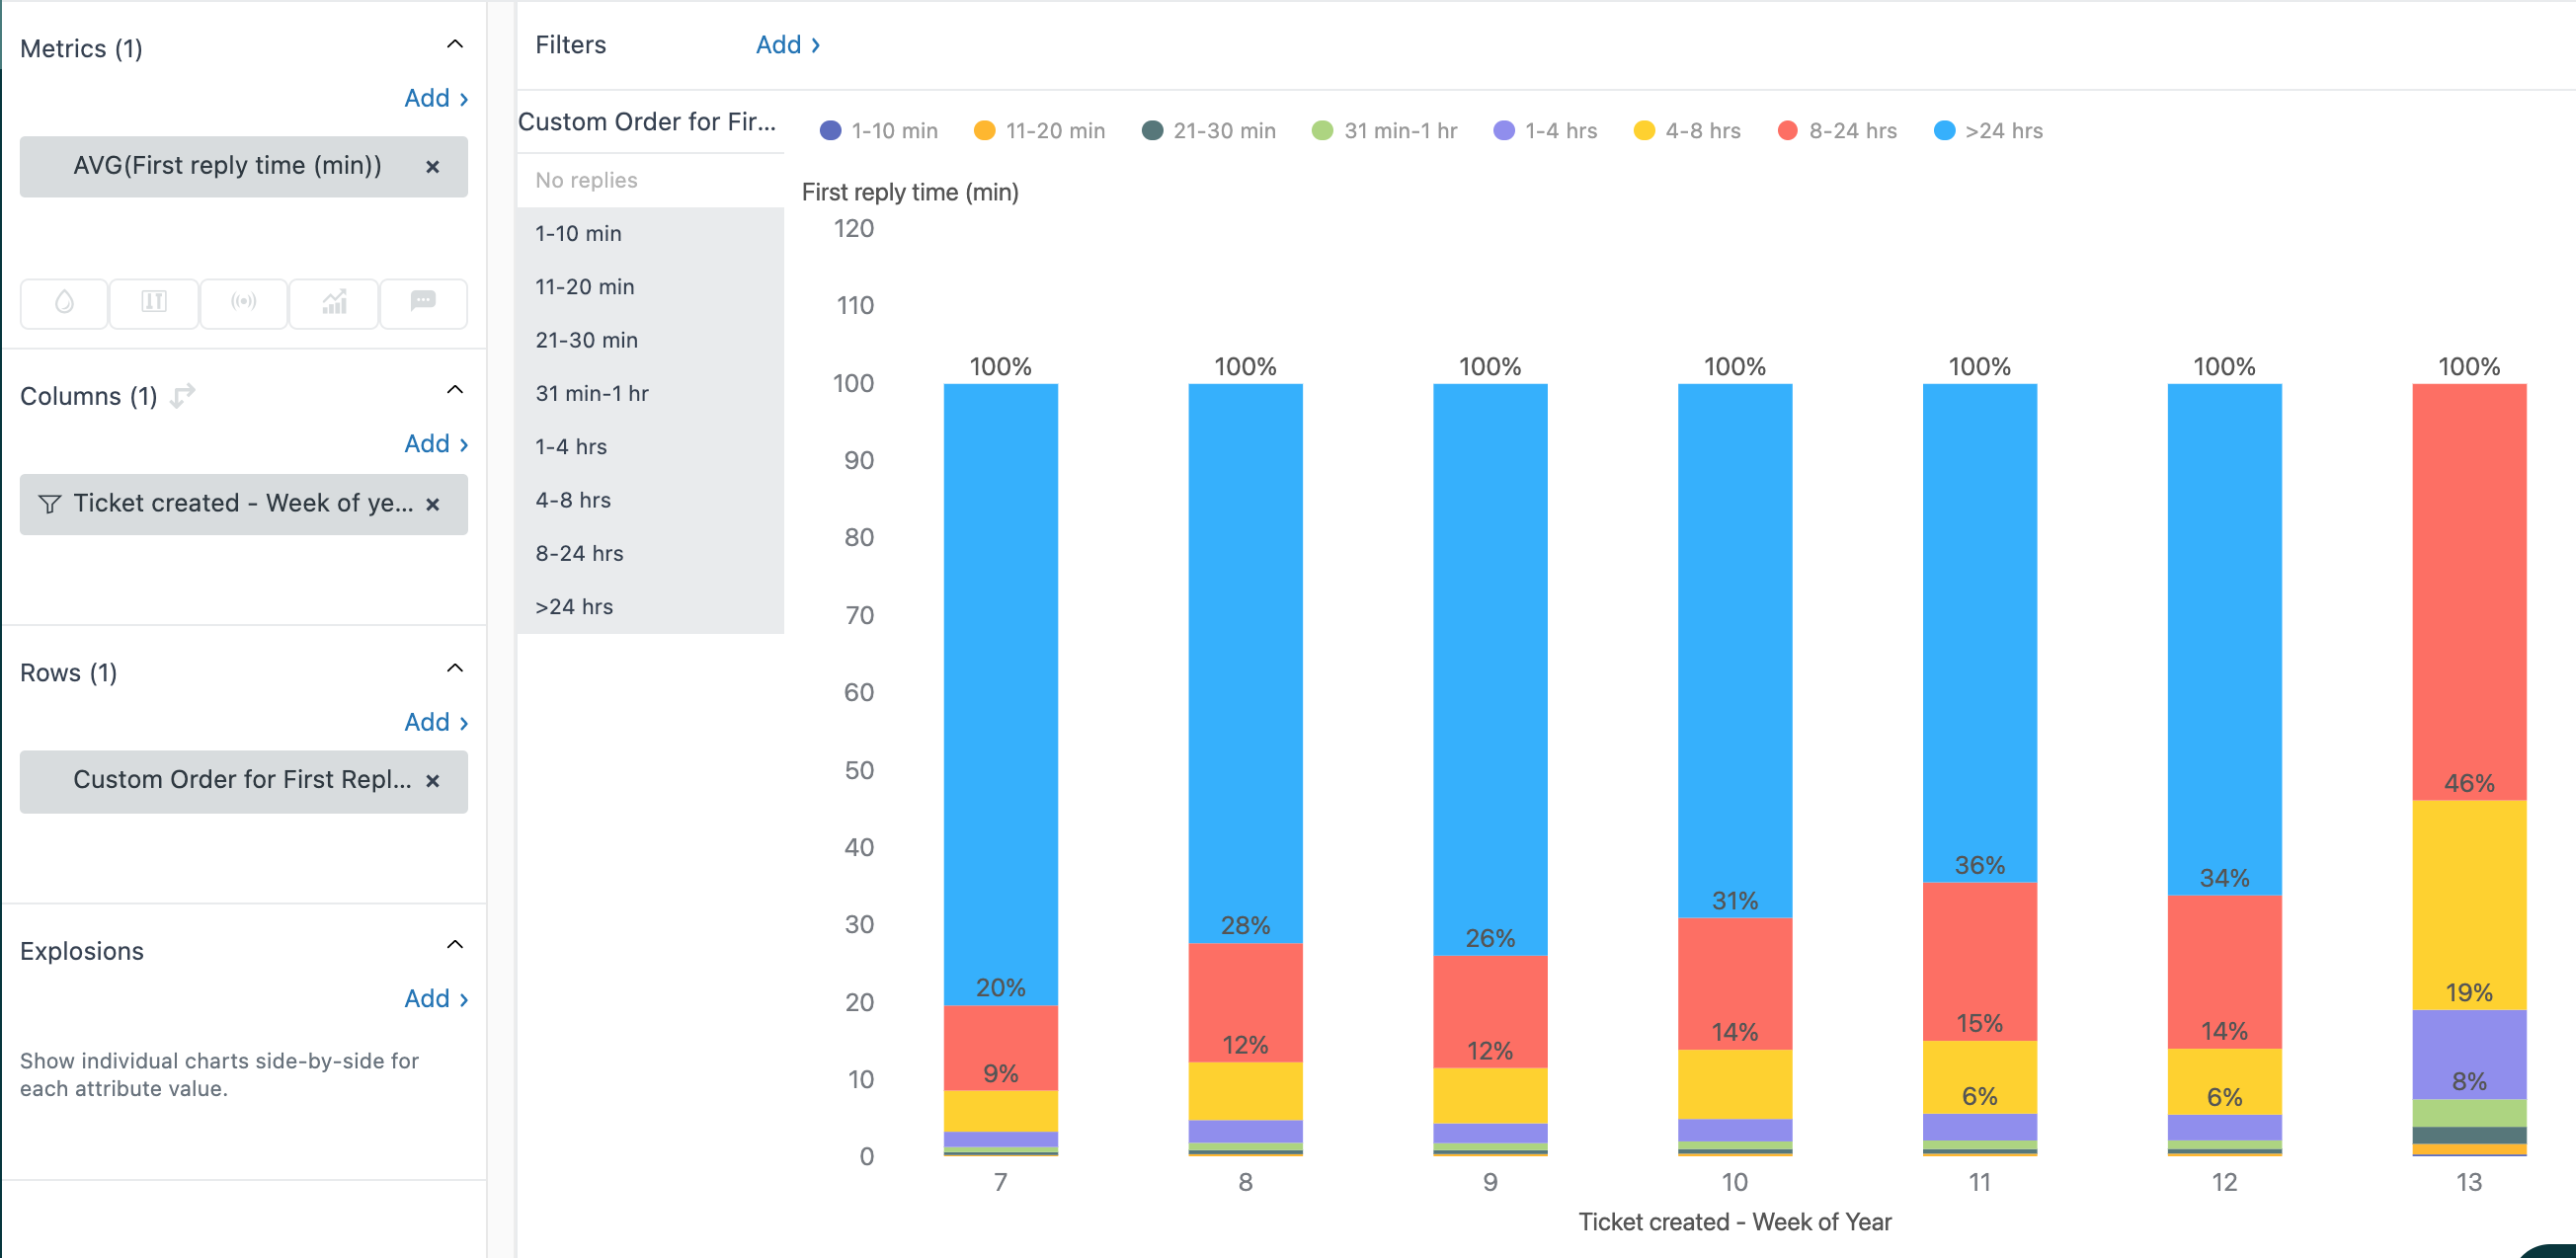
My questions are, am I using the right Metric to begin with. I would think I need something so on my Y axis it is a percentage leading up to 100%.
For Rows I took the First Reply Time Bracket and changed it to have the breakdown of times I needed. Then I had to clone it to organize the times in the right order within it.
This chart just does not look accurate so any help would be appreciated.
Afficher le commentaire · Publication le 31 mars 2021 · Mike Jenkins
0
Abonnés
0
Votes
0
Commentaire
Mike Jenkins a ajouté un commentaire,
Graeme
That may have done the trick. I will monitor and test it to make sure. Thank you so much, glad to finally get this resolved.
Michael
Afficher le commentaire · Publication le 29 oct. 2019 · Mike Jenkins
0
Abonnés
0
Votes
0
Commentaire
Mike Jenkins a ajouté un commentaire,
I would love to get this figured out but am not finding a true representation of what is happening daily. The numbers, no matter what I try do not actually show the correct days.
For example, on 10/28/19 I did not comment on a single ticket, yet it still shows as 8 for the day. So how do I break it down so I see the number according to the specific day a comment happened, not when a ticket is solved through automations or triggers.

I just want to know how many tickets my agents are responding to daily so we can adjust as needed. Any help would be appreciated.
Afficher le commentaire · Publication le 28 oct. 2019 · Mike Jenkins
0
Abonnés
0
Votes
0
Commentaire