Recherches récentes
Pas de recherche récente

Sara del Rosario
Adhésion le 11 juil. 2023
·
Dernière activité le 02 oct. 2023
Suivis
0
Abonnés
0
Activité totale
11
Votes
4
Abonnements
3
APERÇU DES ACTIVITÉS
BADGES
ARTICLES
PUBLICATIONS
COMMENTAIRES DE LA COMMUNAUTÉ
COMMENTAIRES SUR L’ARTICLE
APERÇU DES ACTIVITÉS
Dernière activité effectuée par Sara del Rosario
Sara del Rosario a ajouté un commentaire,
Thanks for your reply, Elaine.
I've conducted a search using one of the requester's names, and I can only find 2 entries even though "Users" displays 11 🙁
Afficher le commentaire · Publication le 02 oct. 2023 · Sara del Rosario
0
Abonnés
0
Votes
0
Commentaire
Sara del Rosario a ajouté un commentaire,
Hi Eugene Orman one question,
What does the column "Users" measure? I have recreated this report, and some of the users have up to 10 over this column.
Afficher le commentaire · Publication le 27 sept. 2023 · Sara del Rosario
0
Abonnés
0
Votes
0
Commentaire
Sara del Rosario a ajouté un commentaire,
For anyone who is as clueless as me. This is how I made it work: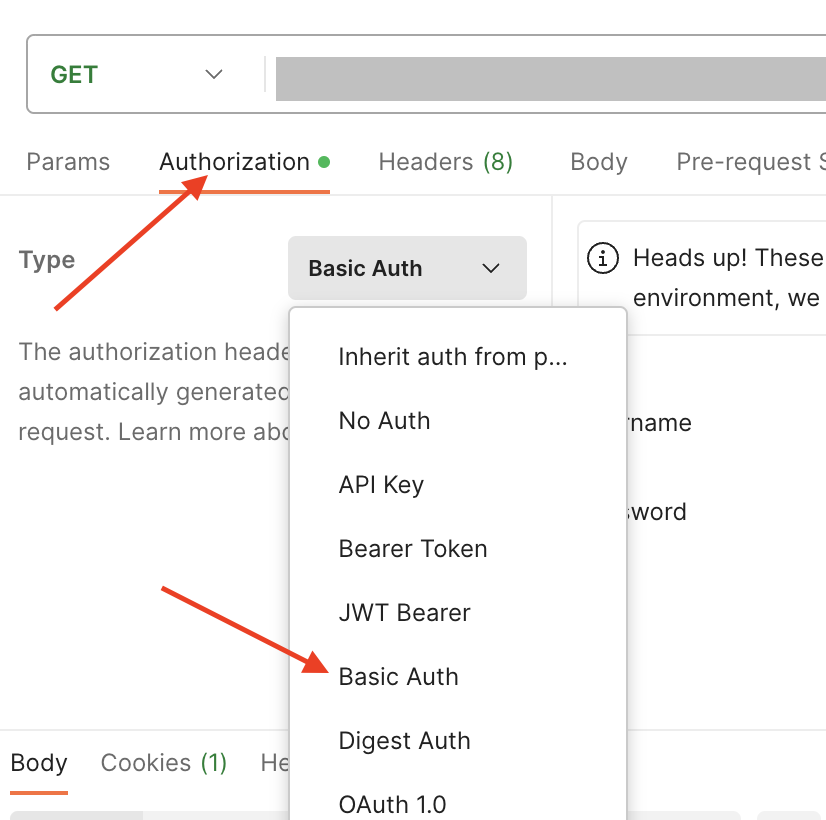
First select the Authorisation tab, then select Basic Auth within the Type dropdown list. Now let's fill in the following information under Username and Password.
Username: {email}/token
Password: {your_api_token}
For example:
Username: youremail@domain.com/token
Password: uyviuyvoubpuigq8fvoufybcqoiquhg8t8x5c
Afficher le commentaire · Publication le 05 sept. 2023 · Sara del Rosario
0
Abonnés
5
Votes
0
Commentaire
Sara del Rosario a ajouté un commentaire,
Hello,
I am looking into creating a report where I can see:
- how many tickets were created each day of the week,
- and how many tickets were solved each day of the week.
Does someone have a solution for this scenario? With this Explore recipe, I am seeing all tickets that were updated each day of the week, so the numbers are inflated. I am seeing tickets that were created last month but updated further on.
Afficher le commentaire · Publication le 03 août 2023 · Sara del Rosario
0
Abonnés
0
Votes
0
Commentaire