Ricerche recenti
Nessuna ricerca recente

Le blagueur masqué
Data ingresso 15 apr 2021
·
Ultima attività 27 dic 2023
Seguiti
0
Follower
0
Attività totali
5
Voti
0
Abbonamenti
2
PANORAMICA ATTIVITÀ
BADGE
ARTICOLI
POST
COMMENTI NELLA COMMUNITY
COMMENTI AGLI ARTICOLI
PANORAMICA ATTIVITÀ
Ultima attività di Le blagueur masqué
Le blagueur masqué ha commentato,
No reply from Zendesk ? Regarding customer support, far from being acceptable..
Visualizza commento · Data ultimo post: 17 giu 2021 · Le blagueur masqué
0
Follower
0
Voti
0
Commenti
Le blagueur masqué ha creato un post,
Hello,
Making a chart with date in X axys with the number of tickets may be not really relevant as somedays you have less more tickets (sunday for example) and so it's difficult to see clearly a trend.
The trend with the pandemic and figures related is the 7 day average, for example on Google :
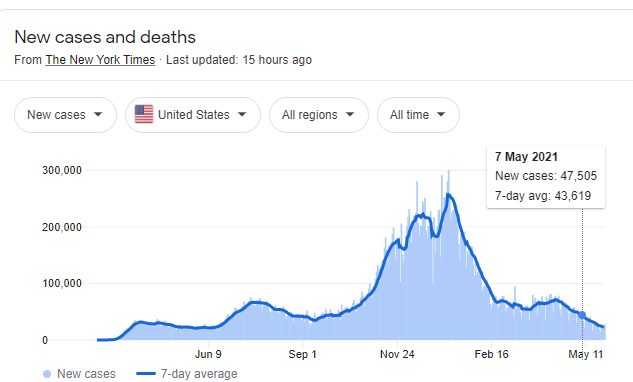
I am trying to do that on Explore (for each day compute an average on the last 7 days) but I did not find a way to do it (don't know if it is possible).
Does someone succeed to do a such metric ?
Thanks
Data ultimo post: 28 mag 2021 · Le blagueur masqué
0
Follower
4
Voti
4
Commenti
Le blagueur masqué ha creato un post,
Hello,
I am trying to use a date range calculated metric in a standard one but I don't succeed.
I have my two metrics :

The first one is a date range calculated metrics wich give me the first reply time for yesterday :

The other one is a "basic" one which is only the average of the first result :


Results are not the same. Do you know how to use a date range calculated metric in a standard calculated metric ?
Thanks,
Data ultimo post: 28 dic 2020 · Le blagueur masqué
0
Follower
2
Voti
1
Commento