Unsolved tickets displayed per week and age bracket?
Beantwortet

Gepostet 09. Aug. 2021
Hello all,
I am trying to build a simple report with a chart that shows the number of unsolved tickets in each age bracket over time. E.g. week-by-week over a rolling 3-month period.
My starting point is the table below but I'm completely at loss as to display it in a graph (or table) per week.
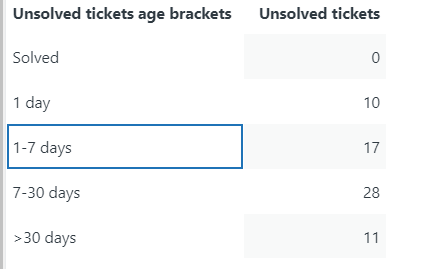
Has anyone manage to solve such an approach?
Many thanks in advance!
/Love
1
1
1 Kommentar
Dave Dyson
Hi there!
It looks like you're using this recipe, but using "Unsolved tickets age brackets" instead: Explore recipe: Displaying tickets answered within different time brackets
So you've got Tickets as your metric, and "Unsolved tickets age brackets" under Rows. The next thing to do is to add dates as Columns -- so under Columns, you could add "Ticket created - week of year", and then add a filter on that same attribute to limit your report to the past three weeks. Then you can select a line or bar chart using the Visualization type button on the right side of the query builder interface. (Note that for that short of a period of time, no ticket will fall under the "> 30 days" column since your total timespan is less than 30 days, so you might want to extend your timeframe a little longer).
You might also find that the Solved like dwarfs the others – in that case, try adding another filter on "Unsolved tickets age brackets" and exclude "Solved" (or only select the brackets you want to see).
Hope that helps!
1
Melden Sie sich an, um einen Kommentar zu hinterlassen.