This article explains how to download agent logs from Contact Center and how to analyze them using the Amazon Connect Contact Control Panel (CCP) Log Parser. Zendesk Support may ask for these logs during investigations.
This article contains the following topics:
Access agent logs
Agent logs are a great resource for Zendesk Customer Support to diagnose and resolve issues with Zendesk Contact Center. Zendesk Support might ask for these logs during an investigation.
To download agent logs in the Agent Workspace:
- Click your profile image
- Click Manage profile
- Click the Voice preferences tab
- Under Download logs, click Download
To download agent logs in the Zendesk for Contact Center app:
- In the Zendesk Contact Center app, click your profile image
- In the sidebar, click Agent Settings
- Click ... at the bottom and then click Download Logs
The browser saves a text (TXT) file named agent-log.txt to your default directory. After the file downloads, you can rename it the same way you rename any other file on your computer.
Analyze agent logs
After you download the agent logs, navigate to Amazon Connect's CCP Log Parser to analyze them. Drag and drop the downloaded agent-log.txt file into the parser:

The Snapshots and Logs tab displays the logs recorded during the agent session. You can filter the logs by type. These logs don't persist when you refresh the browser.
Log entries appear collapsed, but most entries contain additional information. To see the original log object in JSON format, click the plus sign to expand or collapse the log lines.
On the left side of the log entry, select Snapshots, which appear periodically. Each snapshot displays the agent status from the retrieval period. Select a snapshot to highlight the section from that snapshot until the next snapshot.

The following image displays a snapshot log with a softphone error.

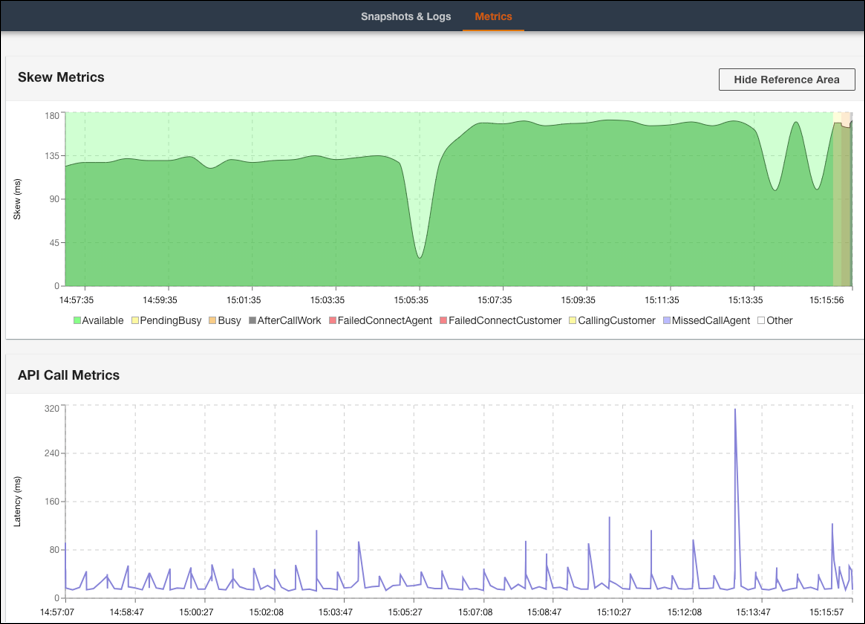
The Metrics tab displays the following metrics:
- Skew Metrics displays the difference in milliseconds between the local timestamp of the agent workstation on the client side and the Amazon Connect service timestamp on the server side
- API Call Metrics displays the latency of the API call from CCP
- WebRTC Metrics is available if the call occurs through CCP. These metrics display the media stream condition during a call.