Summary: ◀▼
Use filtering, grouping, cross-filtering, drill-in, and dashboard interactions to explore analyst copilot reports, compare results by agent, channel, or month, and build dashboard filters that control what you see. You can combine filters, exclude dashboard filters from specific reports, and connect columns across datasets so your reports and dashboards reflect the right data for analysis.
You can group and filter your analyst copilot report results:
- Filtering limits the rows that are included in the report results. Filtering happens before grouping.
- Grouping buckets results to compare aggregates (for example, by agent, channel, or month). Grouping happens after filtering.
Filtering your report results
There are several methods you can use to filter your results:
Filtering reports
You can filter a report to show only the information you need. For example, you might filter tickets solved by a particular agent, or tickets solved between two dates.
To filter a report
- Open a report, then, in the Filters
panel, click the add icon (+).
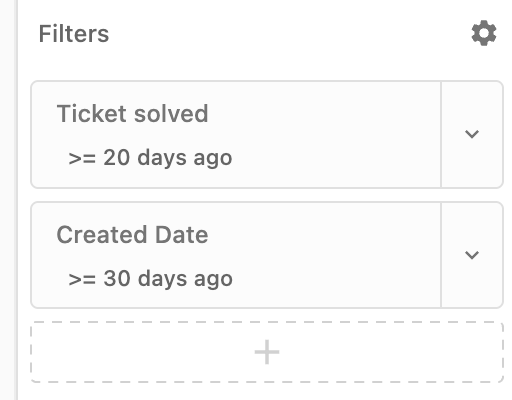
- From the list of filters, click the one you want to add. The filter is added to your report and the filter options open.
- In the filter options, configure information for the filter. For example, a date range, or an agent name.
The report updates to show the filtered results.
Using filter expressions
When using more than one filter, you can configure logical dependencies between them. For example, using three filters, you might want them to work together:
Select: “1 AND 2 AND 3”Alternatively, you might want your report to consider results matching the first filter, or any of the following filters:
Select: “1 AND (2 OR 3)”To create an expression
- Open a report, then, in the Fields panel, click the add icon (+).
- Click the Create expression field tab.
- On the Edit expression page, configure an expression and a new metric name for it. You can use any field name contained in your report and any column in your dataset.
- In the as: field, enter a name for the new metric, such as "Tickets not solved".
You can use the same method to create custom attributes.
Using global filters
When you add a filter to a dashboard (known as a global filter), the filter applies to all components on the dashboard. For example, you can add a filter for assignee name, allowing you to filter a dashboard for only the assignee names you selected.
Adding global filters
Once you've added reports to a dashboard, you can add filters to control the displayed results.
To add a global filter
- Open a dashboard that contains at least one report, then click Edit.
- Click Filter.
- If your dashboard contains reports from more than one dataset, select the dataset from which you want to choose the filter value.
- From the list, select the filter you want to add.
For example, you could choose a date filter to show only results from the last 30 days.
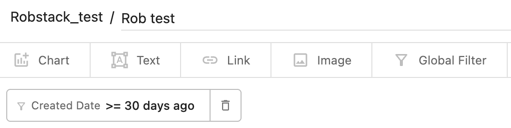
The dashboard updates to reflect the values you configured.
With the dashboard In Edit mode you can choose from filters and set their defaults. In View mode you can only choose from filters.
Configuring global filters
After you add a global filter, configure it to control the information that's displayed.
To configure a global filter
-
Open a dashboard that contains
at least one filter, then click View.
The filter settings are displayed.
- Specify details about the filter. For example, set >= to 30 to only count events that are 30 or more days old.
- Click Apply.
The dashboard updates to display the filtered values.
Deleting global filters
If you no longer need a filter, you can delete it.
To delete a global filter
- Open a dashboard that contains at least one report, then click Edit.
- Click the delete icon next to the filter you want to delete.

The filter is immediately deleted. If you made a mistake, you can click undo to restore the filter.
Controlling how global filters affect reports
- Open a dashboard that contains at least one report and one filter, then click Edit.
- Click the report you want to configure. The report options are
displayed.
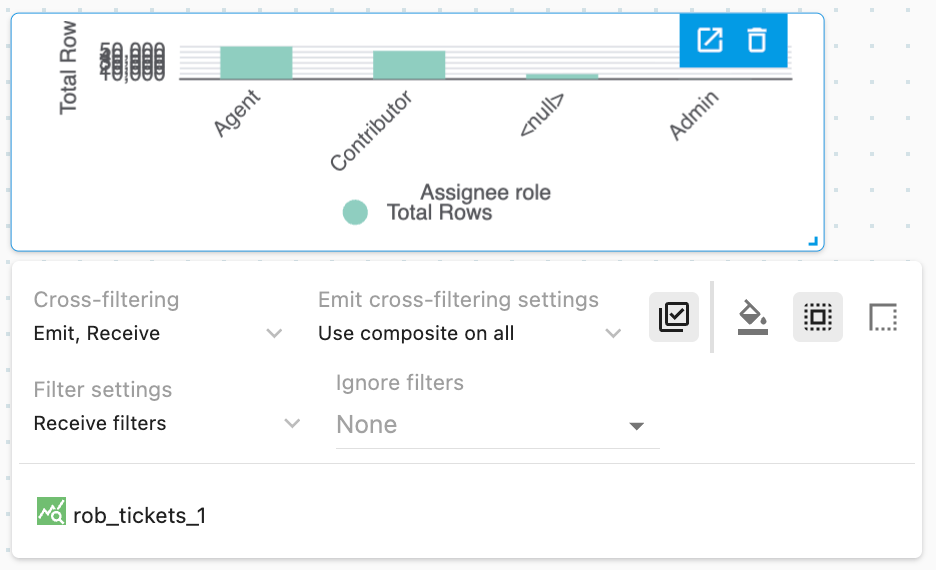
- Configure the following options as needed:
-
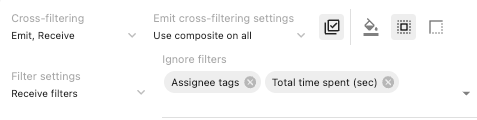
Cross-filtering: Configure how selections made on this
report will cross-filter other reports on the dashboard. Choose
from:
- Emit: Selecting a value (for example a column) on the report will send a cross-filtering event to other components on the dashboard, filtering their results by the value selected in this component.
- Receive: When unchecked, the component will ignore cross-filtering events from other components.
-
Emit cross-filtering settings: Choose from one of the
following options:
- Use composite on all: Use all groupings to cross-filter receiving queries.
- Cross-filter first grouping only: Use the first grouping only to cross-filter receiving queries.
-
Filter settings: Control what happens to the selected
report when global filters are configured:
- Receive filters: Global filters are added to the component's existing filters (both filters apply).
- Receive and replace: Global filters override the component's matching local filters.
-
Ignore filters: If you don't want one or more of your
reports to be affected by global filters, you can choose one of
the following options:
- Ignore all dashboard filters: No dashboard filters will affect the selected report.
- Ignore selected dashboard filters: From the list, choose the filters that will not affect the selected report.
Filter settings are unavailable if you ignore all dashboard filters.
If filters have been ignored, this is indicated by an icon (
 ) next to the report.
Hover over the icon to see which filters are being
ignored.
) next to the report.
Hover over the icon to see which filters are being
ignored.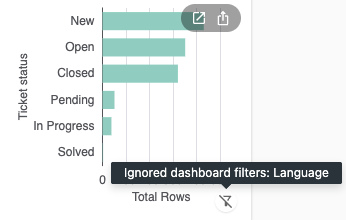
Filters that are ignored are also shown in the report settings. To stop ignoring a filter, click x next to its name.
-
Cross-filtering: Configure how selections made on this
report will cross-filter other reports on the dashboard. Choose
from:
When you use column groups to connect multiple columns for cross-filtering, filter exclusions apply to the entire group.
If you configure a component to ignore a global filter for one column that belongs to a column group, the component will automatically ignore global filters for all columns in that group.
For example, if you had a column group that connects "assignee role" from the tickets dataset and "agent role" from the agents dataset, if you configure either to ignore global filters, both will automatically be ignored.
This ensures consistent behavior across related columns and prevents partial filtering that could produce unexpected results.
Best practices for filter exclusions
The following tips can help you to produce easy to understand dashboards when you ignore filters.
- Use descriptive component titles: When components on the same dashboard have different filter behaviors, use clear titles to help viewers understand what each component shows (for example, "Tickets created this month" against "All-time tickets solved").
- Document your dashboard: Consider adding a text component to explain which components are ignoring specific filters, especially for complex dashboards.
- Review filter exclusions regularly: When you add new global filters to a dashboard, check existing components to ensure the filter exclusions still make sense.
- Test in view mode: Always test your dashboard in view mode to confirm that filter exclusions work as expected for end users.
Using cross-filtering
Cross-filtering (also known as faceting) lets you ask second-order questions about your data by helping you highlight and focus on a specific subset of your data, meaning you can conduct a deep dive into areas of particular interest.
By using cross-filtering, you can ask subsequent questions about your data without having to create a new report.
Before you start, you’ll need a dashboard containing at least two reports that use the same dataset.
To use cross-filtering
- Open a dashboard, then set the toggle switch to View.
- Click one of the data fields in your dashboard.
The entire dashboard is filtered by the data you selected and an extra filter is added to the dashboard.
Example
This example uses a dashboard with two reports:
- Tickets by brand donut chart
- Tickets by group treemap chart
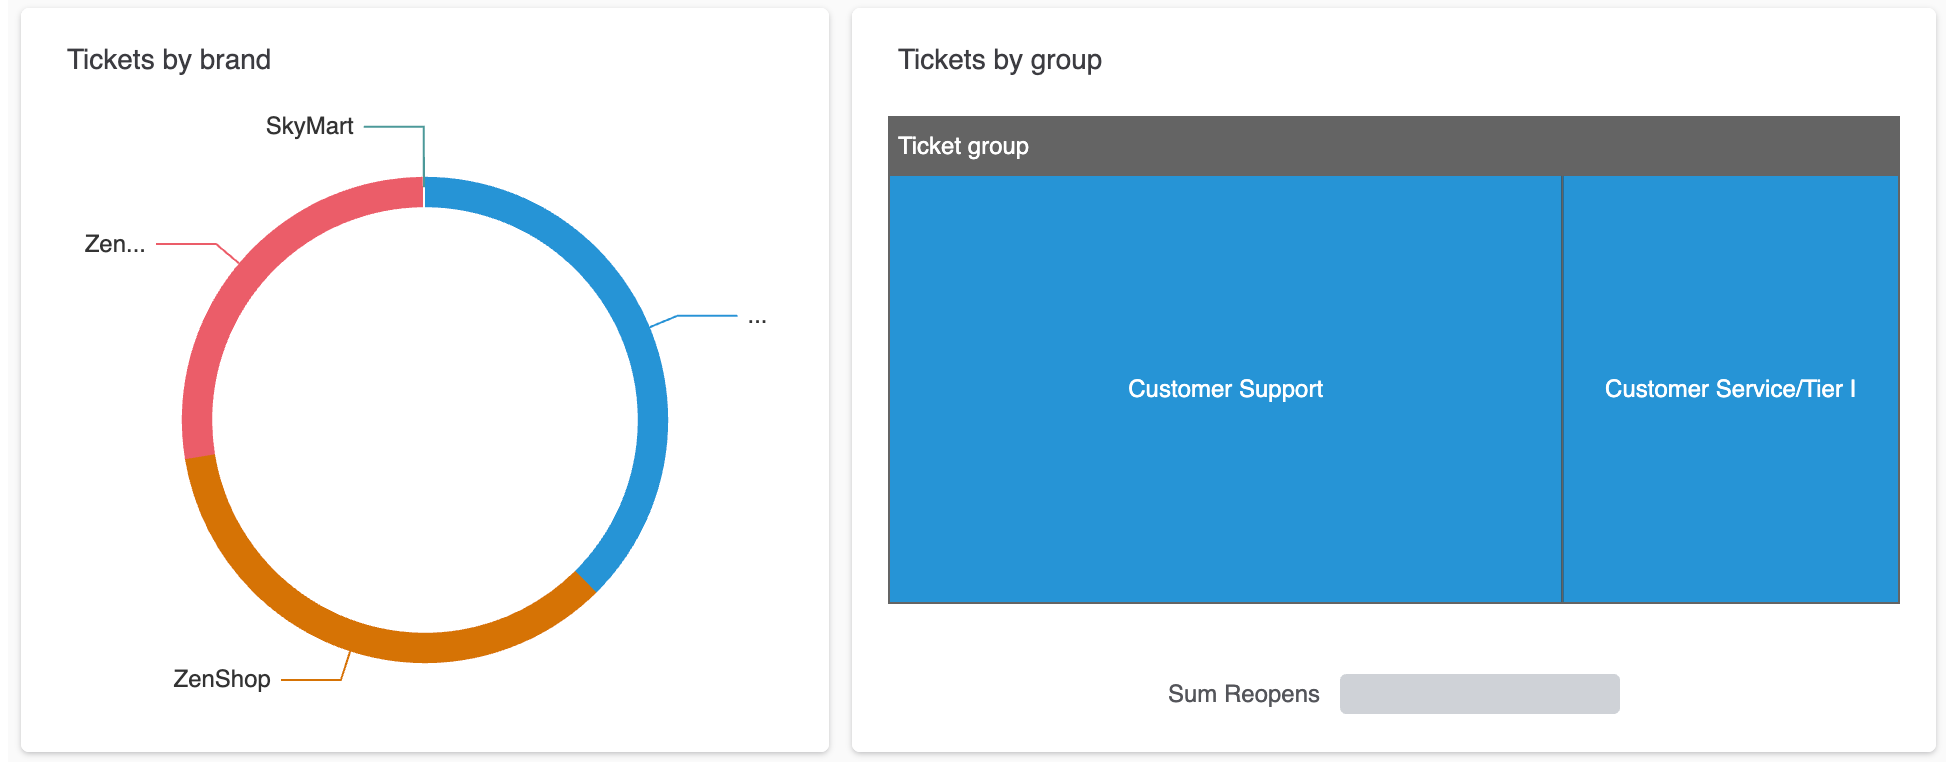
You want to discover which groups tickets in the Zen brand are in.
To cross-filter the report
- With the dashboard in view mode, click the Zen portion of the donut chart.
The Tickets by group report (and all other reports on the dashboard) updates to display only tickets in the Zen brand sorted by group.
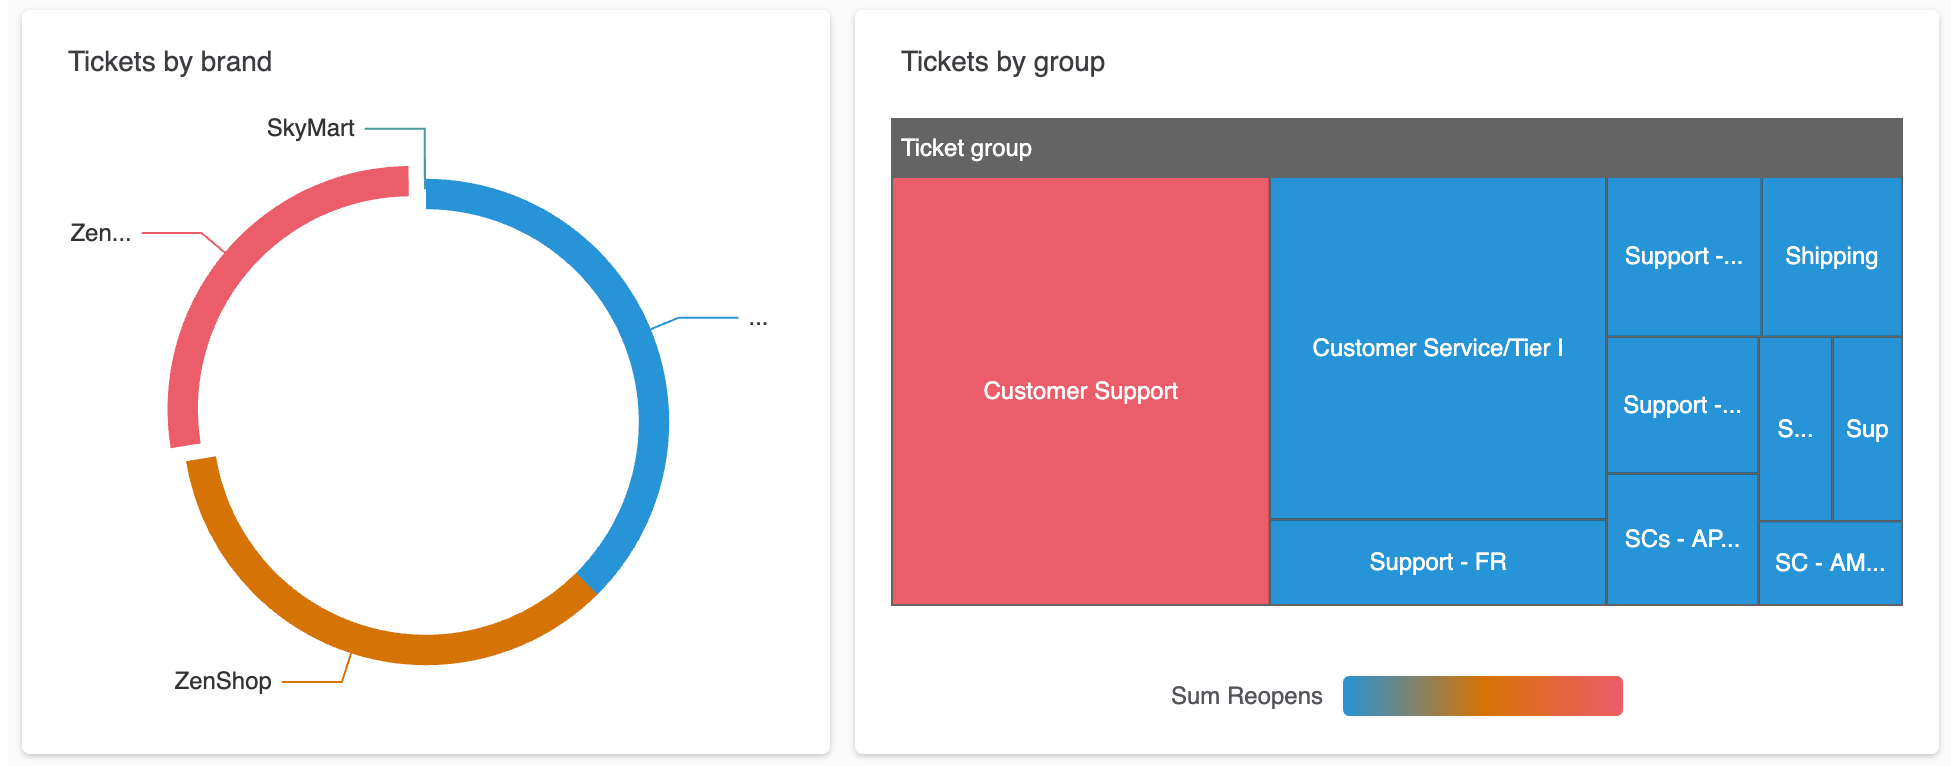
A new filter is added to the dashboard that displays how the report is filtered. If you delete this filter, the dashboard returns to its original state.

Grouping your report results
There are several ways you can group, organize, and limit your report results, including:
- Sort descending: Organizes results in descending order using a selected field as a key.
- Sort ascending: Organizes results in ascending order using a selected field as a key.
- Add filter: Creates a filter based on a selected field.
- Cumulative: Provides a running total of grouping results.
- Rename: Rename a field value.
- Remove: Removes the selected metric. You must have at least one metric in your report.
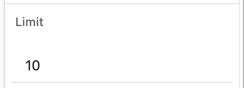
- Limit: Limits the results to a specified number.
To group your report results
- Open a report, then click the down arrow next to a field.
- From the grouping list, select the option you want.
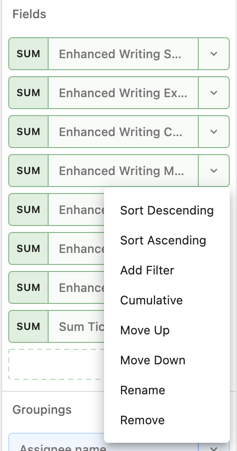
The report updates with the new grouping.
To limit your report results
- In a report, change the Limit value to the number of results you want returned.
The report updates showing only the number of results you specified.
Using drill-in to explore your results
You can further analyze your reports by using drill-in.
To drill into a report
- Open a report, then click one of the results.
For example, a column in your chart.
The drill-in panel opens at the bottom of the page.
- Click Drill-in.

The report updates displaying the item you drilled into. You can click Annotate to add this report to your memories.
Using dashboard interactions
By default, global filters apply only to reports in the same dataset. You can use interactions to connect columns across different datasets so that filters and cross filters affect the entire dashboard, regardless of the dataset each report comes from.
Additionally, interactions can connect similar columns from the same dataset so that they work together. For example, if you connect ticket status updated time, ticket updated time, and ticket assignee updated time, a single filter could be used as 'last time any update was made to the ticket'.
To create a dashboard interaction
- Open a dashboard, then click Edit.
- Click the options menu (
 ), then select Interactions.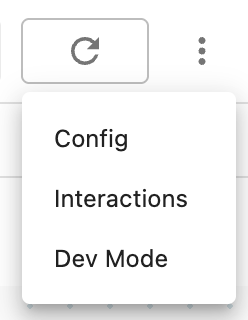
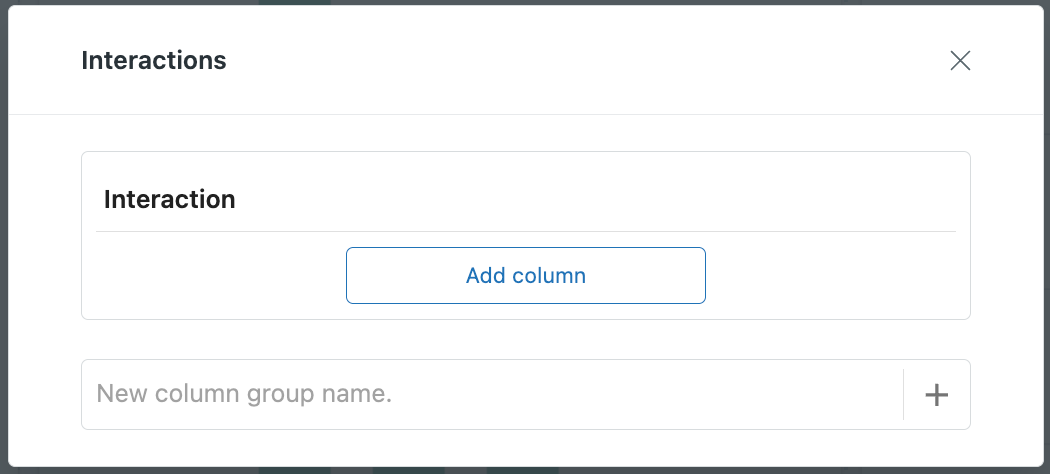
- Enter a name for your column group, then click the add icon (+).
- Click Add column.
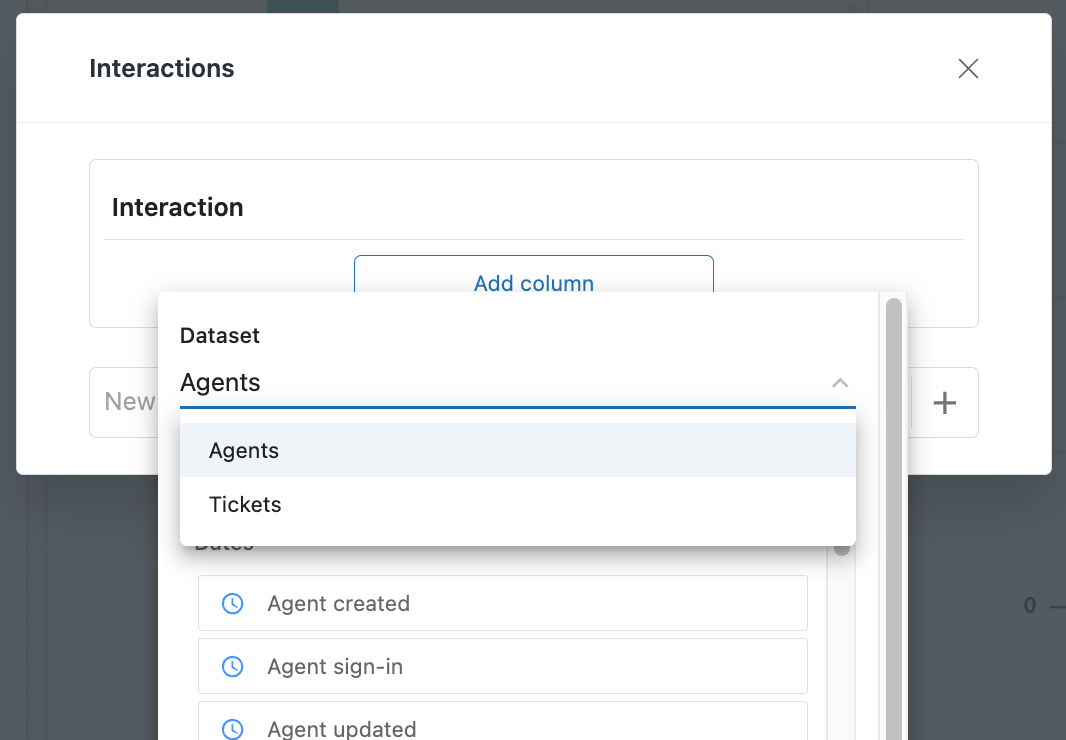
- From the list of columns, choose columns from each dataset you want to connect.
You can change to another dataset by clicking the dataset name at the top of the list.
- Continue to add interactions as needed.
Example
In this example, you've created a dashboard that contains three reports:
- Agent roles: Counts agents grouped by their role. Uses the Agents dataset.
- Tickets by assignee role: Counts tickets grouped by assignee role. Uses the Tickets dataset.
- Assignee role set: A report that uses a custom grouping to indicate whether the role is set or not. Uses the Tickets dataset.
When you change filters, the two reports that use the Tickets dataset will automatically update. However, you must create a column group to connect the report columns that use the Agents dataset so that filtering will work on all reports in the dashboard.
Add the following columns to connect the two reports:
- From the Agents dataset: Agent role
- From the Tickets dataset: Assignee role
Now, when you filter a report, all reports on the dashboard will be affected.