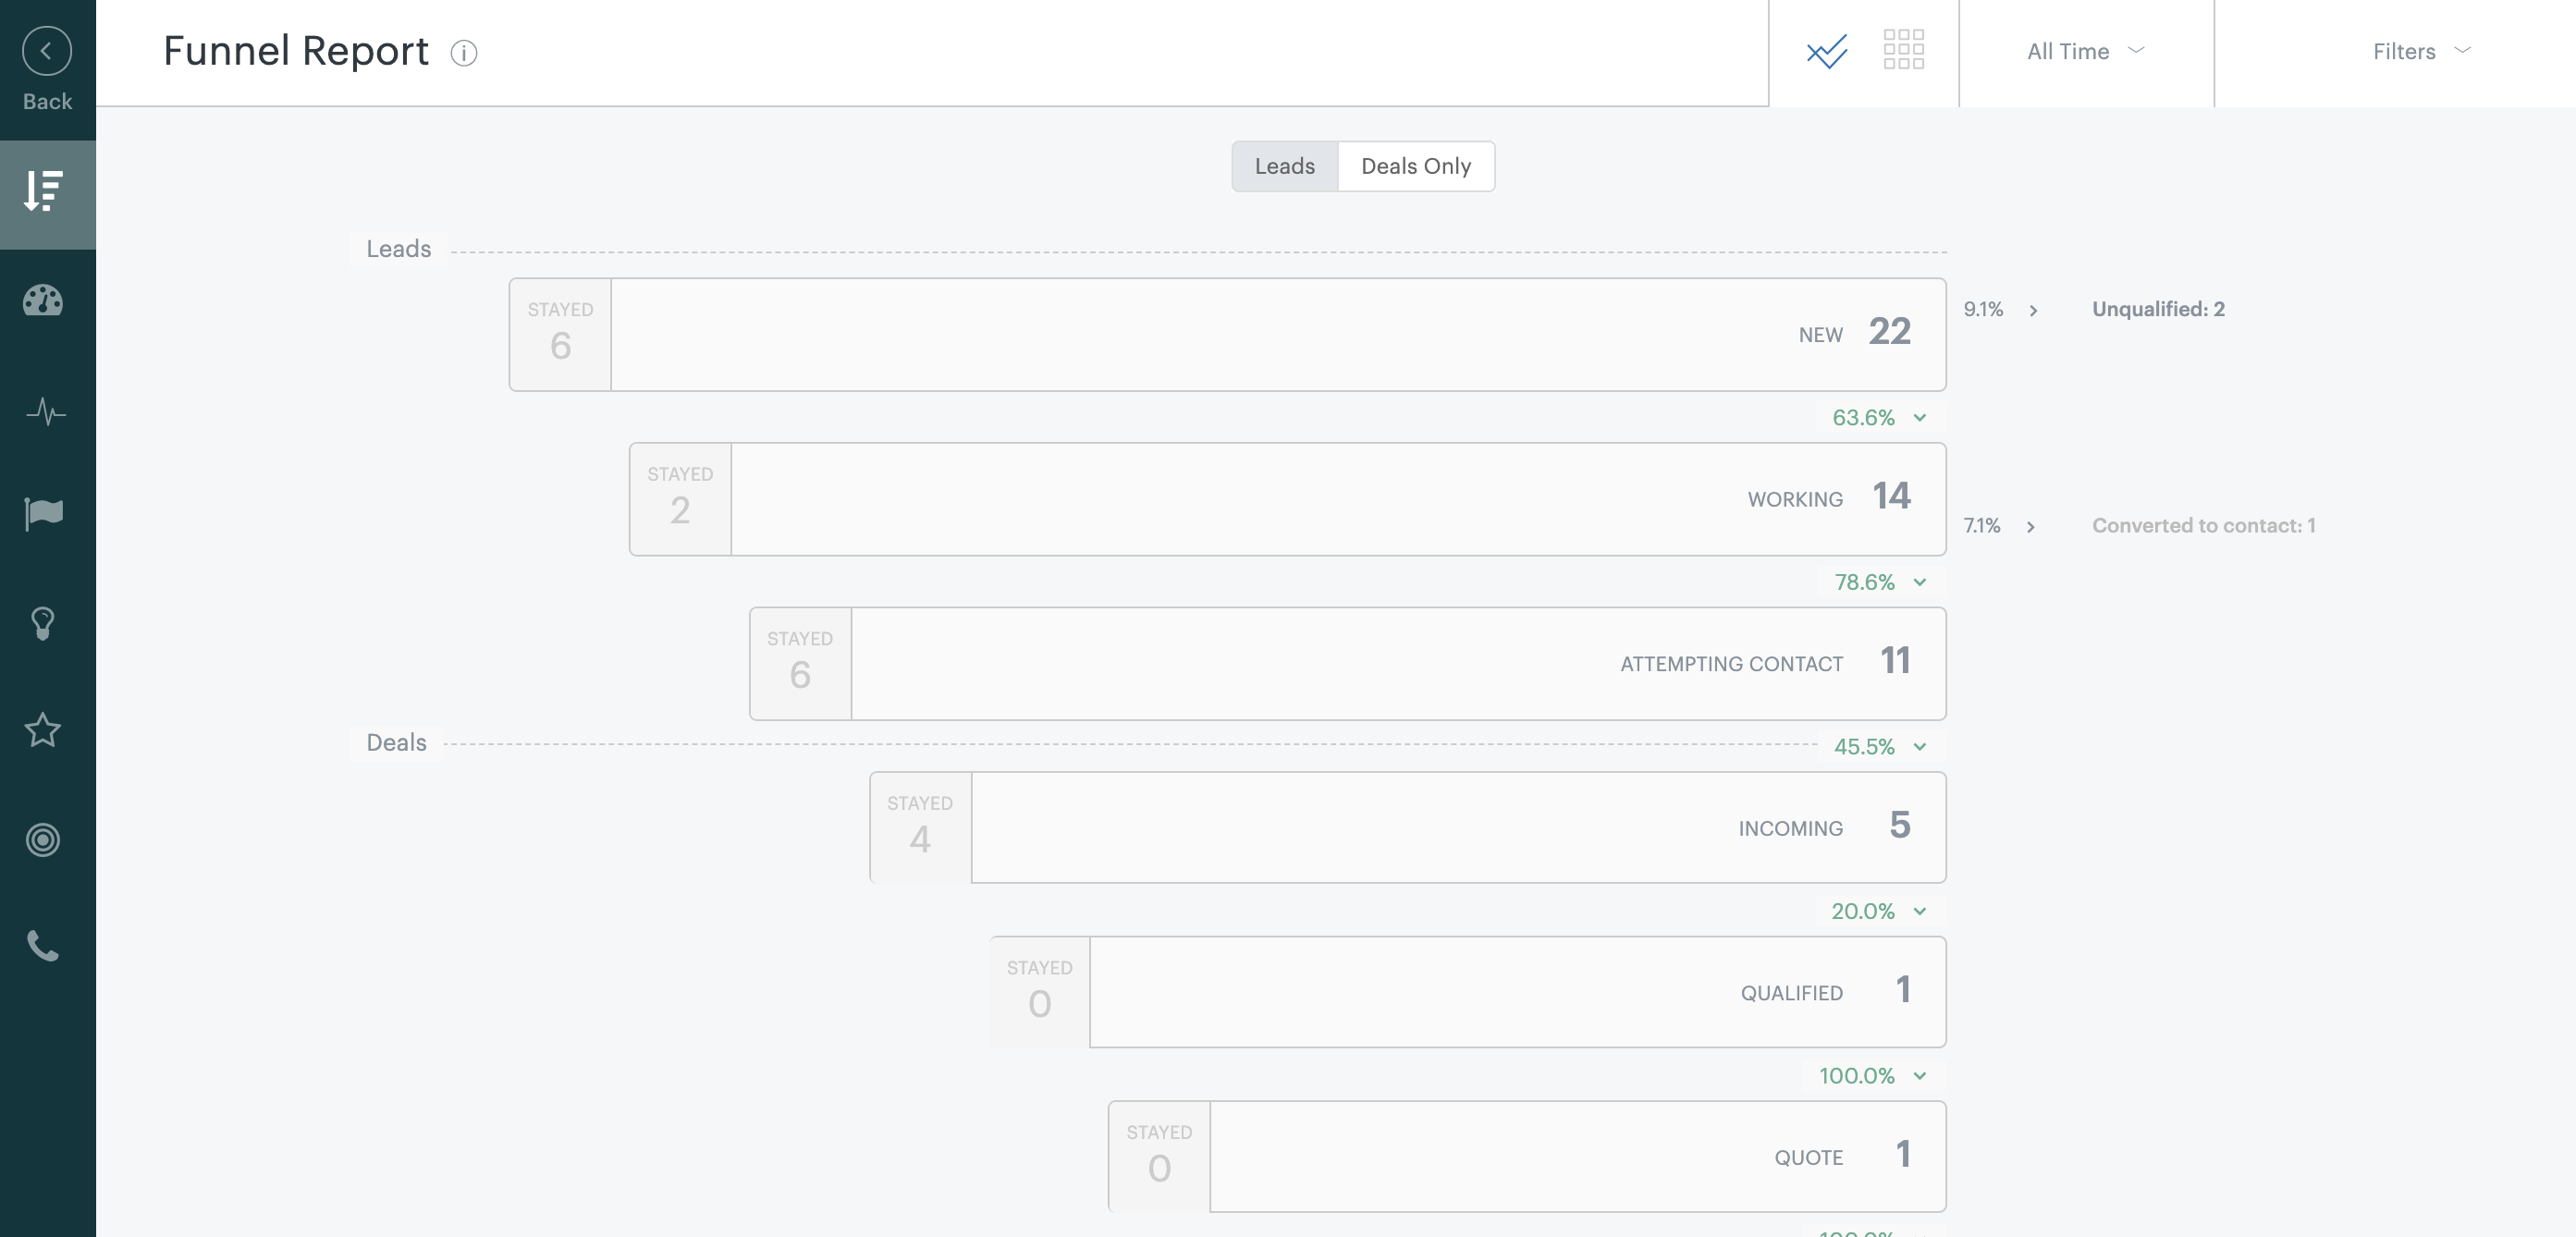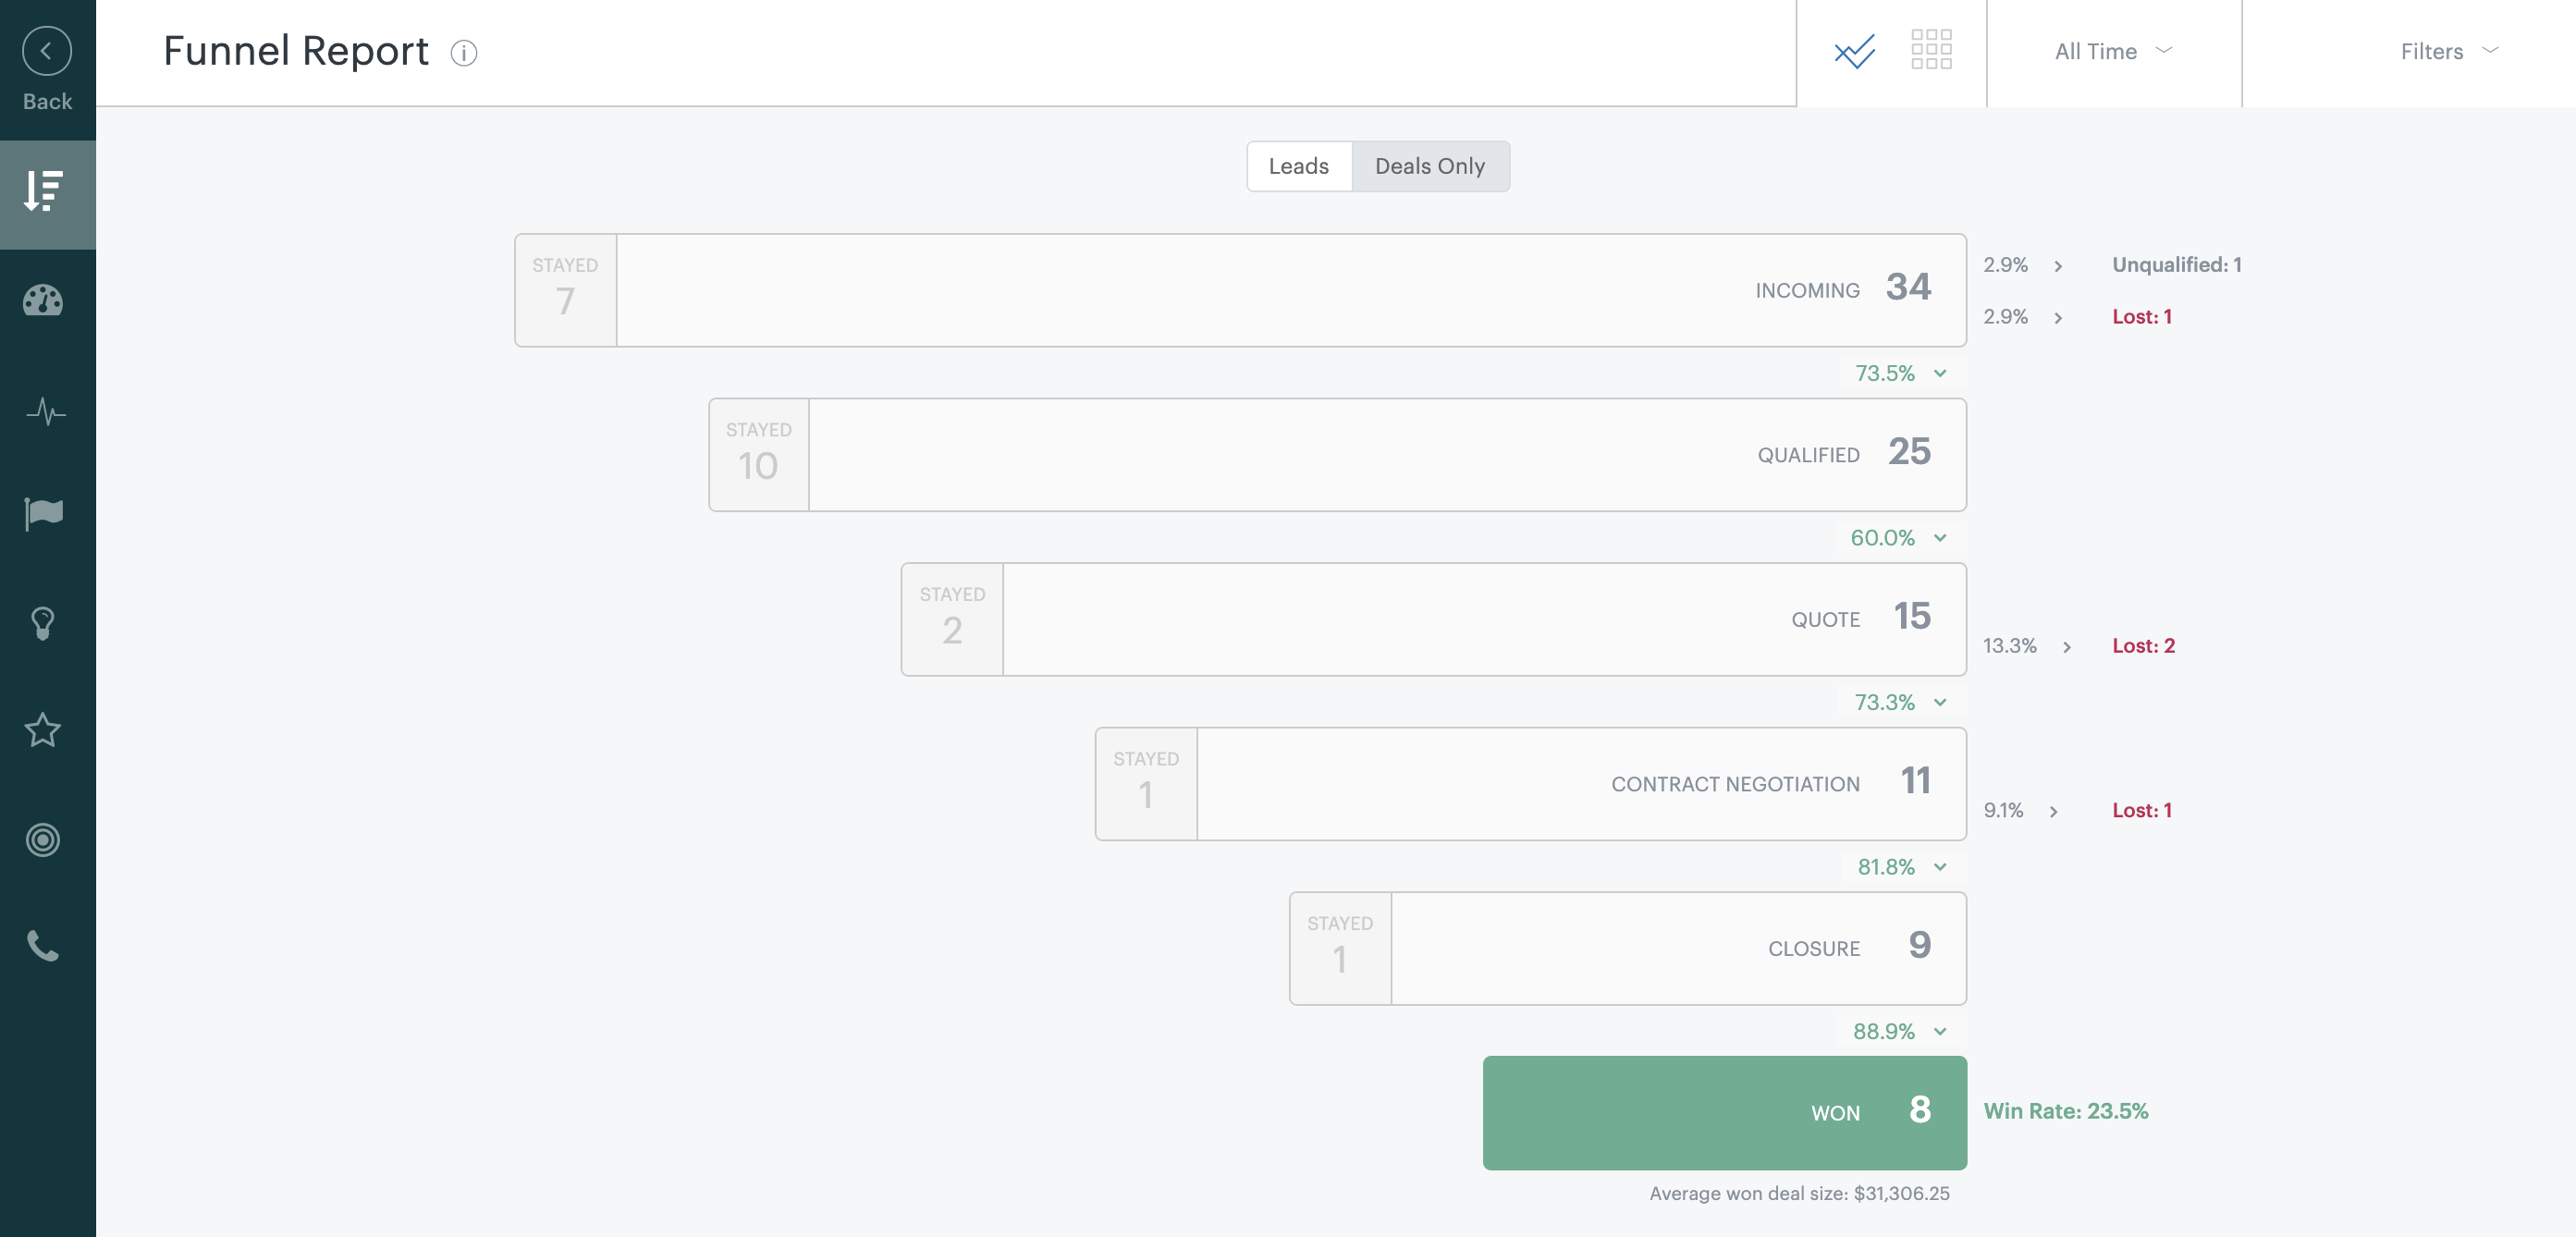
The Funnel report helps you to analyse lead and deal progression through the sales pipeline, so you can see for example how many deals are incoming, how many are in contract negotiation, and so on. The report also gives you insight into the progression of your deals that started as leads.
To view the Funnel report
- From the Reports page, select Pipeline Analysis > Funnel Report.
The Leads view of the report shows you the progression through lead status (such as new, working, attempting contact) and then through the sales pipeline as leads are converted and deals are created.

The report doesn't show leads that are in an Unqualified state. It also doesn't show leads with an Unqualified state that have been converted to a contact (without deal). In these cases, the report will include a note to show you the number of leads that aren't included.
If you only want to see deals, click the Deals Only tab.

This view of the report shows you deals at each stage in your sales pipeline. To see the detail for a pipeline, click the stage and the table view of the report is displayed.

This report shows you deals based on their creation date. For example, if you have your filter set to view deals in October 2019, only the deals that were created in October 2019 are displayed in your report.
Each deal within each pipeline stage lists the deal value, the current stage, and the deal owner. You can view a deal’s card by clicking its name. You’ll also see a summary, for each stage, of which stayed stationary and did not progress in the pipeline, those that progressed, and how many were unqualified or lost.
You can define a different time period and also add the ownership filter to view only one team member or to compare specific team members. You can also add filters to select specific deal sources, tags, and custom fields.