Verified AI summary ◀▼
The Contact Center resolution code dashboard helps you analyze contact resolutions by showing the most used codes, spotlighting unusual usage, and categorizing codes. It provides a summary of metrics like average handle time and contacts handled by channel and network. Use this dashboard to track performance across communication channels and initiation methods, gaining insights into resolution trends and efficiency.
This article outlines the key components of the Contact Center resolution code dashboard, detailing metrics related to contact resolutions and their categories.
Use the dashboard to gain insights on the most used resolution codes, variances in usage, and performance breakdowns across multiple communication channels and methods.
Category summary table
This table shows the summary of the following metrics:
Category
Category path
Contacts Handled by Channel
- Total
- Voice
- Chat
Contacts Handled by Network
- SMS
Contacts handled by initiation method
- Inbound
- Outbound
- Callback
- Transfers
Performance
- Avg handle time
- Avg interaction time
- Avg hold duration
- Avg ACW time
- Avg queue duration
- Longest queue duration
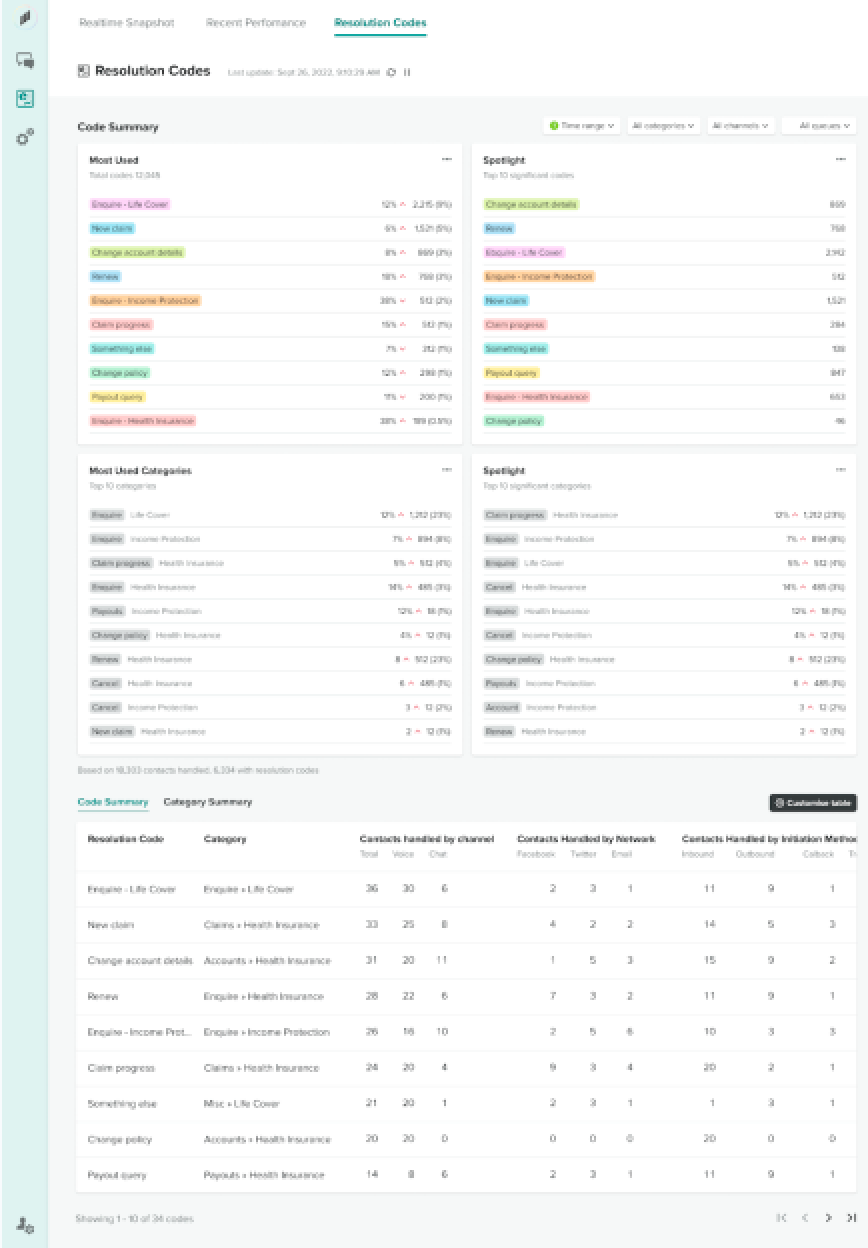
Code summary table
This table shows the summary of the following metrics:
Resolution code
Category
Contacts handled by channel
- Total
- Voice
- Chat
Contacts handled by network
- SMS
Contacts handled by initiation method
- Inbound
- Outbound
- Callback
- Transfers
Performance
- Avg handle time
- Avg interaction time
- Avg hold duration
- Avg ACW time
- Avg queue duration
- Longest queue duration
Most used categories
This section displays up to ten of the most used categories for codes. You can see a total for each category, and whether it has increased or decreased over time.
Spotlight
This section displays the top ten codes whose usage was different than usual, with 1 being the minimum number of codes that can display in the list. Each code displays a percentage of how much it has changed, and whether that change has been an increase or a decrease.
Most Used
Displays the most used resolution codes for the contact. It shows the total number of handled contacts used for the merchant and the list of the most used codes:
- Total number of handled contacts using each code
- Percentage of total handled contacts with that resolution code
- Recent percentage change