Verified AI summary ◀▼
Access real-time monitoring dashboards to track key metrics like ticket queue, agent availability, and average handle time. Use these dashboards to view incoming tickets, ticket progress, and agent productivity. Navigate through detailed reports and drill into specific data points for deeper insights. Customize your view by hiding or showing filters, and explore further details by clicking on hyperlinks within the reports.
The real-time dashboards are found on the real-time monitoring home page of Zendesk analytics.
This article contains the following topics:
Accessing the real-time monitoring home page
To access the real-time monitoring home page
- In the Zendesk product tray, click Analytics.
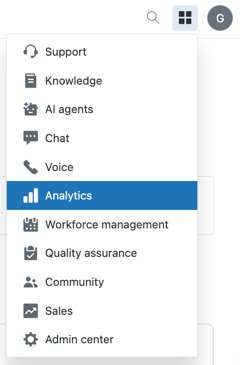
Analytics opens to the dashboards library page.
- Click the real-time monitoring home icon (
 ).
).The real-time monitoring home page opens.
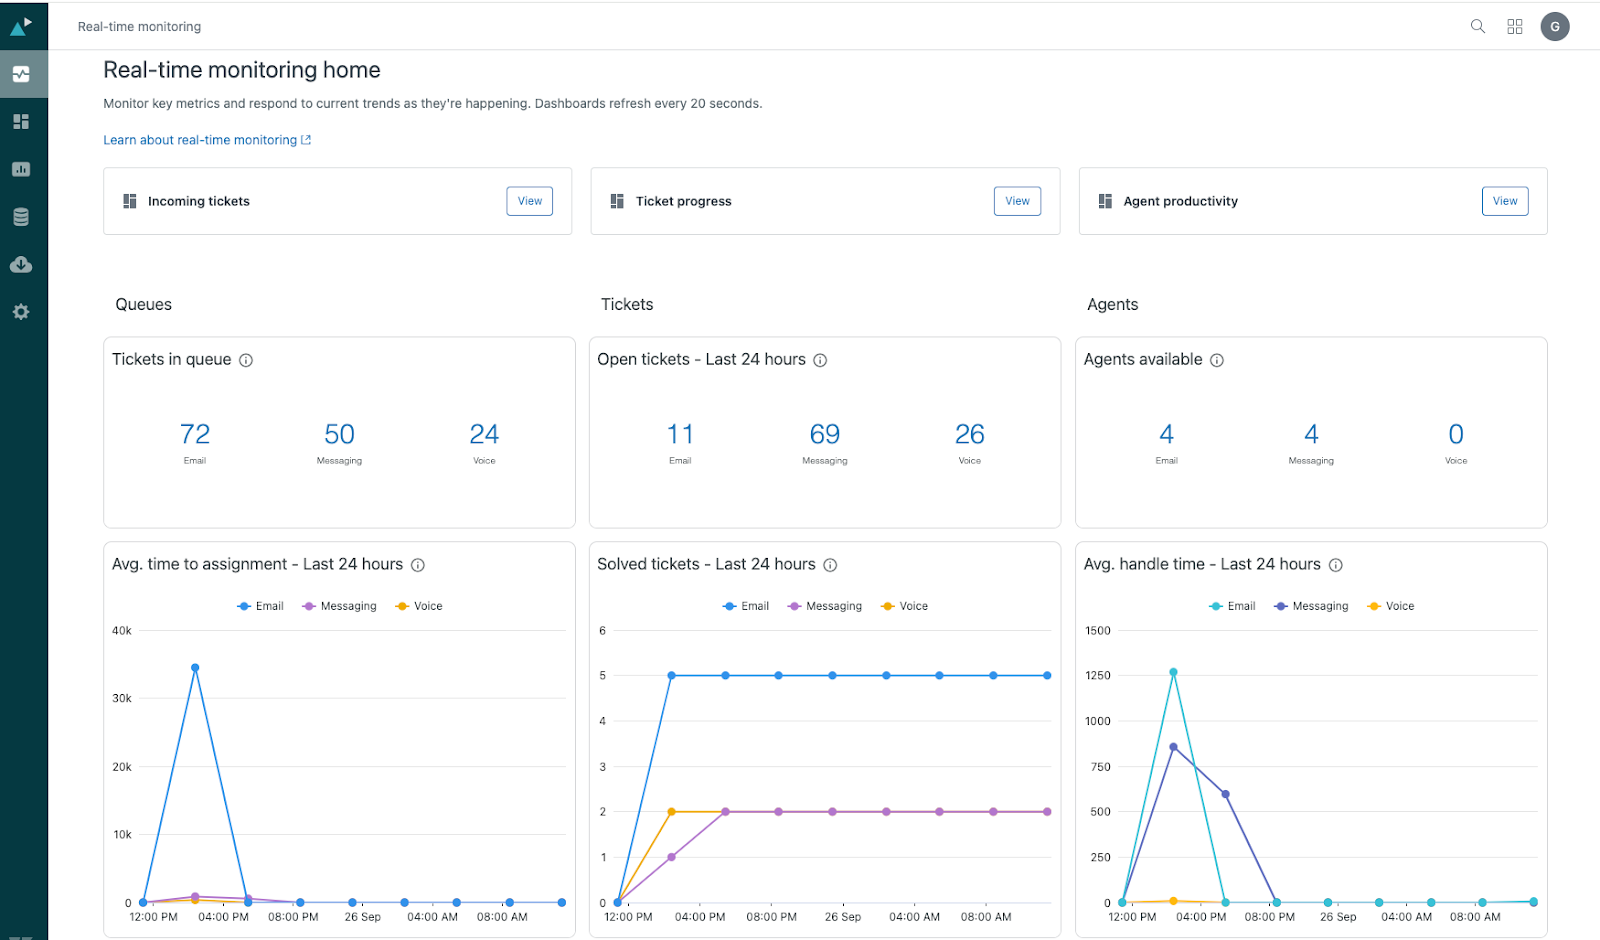 The real-time monitoring home page contains links to the real-time monitoring dashboards and the following summary reports:
- Tickets in queue: Displays the number of email, messaging, and voice tickets that are currently in the queue.
- Open tickets - Last 24 hours: Displays the number of email, messaging, and voice tickets that are in the open ticket status over the last 24 hours.
- Agents available: Displays the number of email, messaging, and voice agents who are currently online and available.
- Avg. time to assignment - Last 24 hours: The average time between when email, messaging, and voice tickets were created and the first time they were assigned to an agent over the last 24 hours.
- Solved tickets - Last 24 hours: Displays the number of solved email, messaging, and voice tickets over the last 24 hours.
- Avg. full resolution time - Last 24 hours: The average time, from start to finish, that a customer was connected with an agent using email, messaging, or voice. This metric only counts duration whilst the ticket is in an open or pending state.
Accessing the real-time monitoring dashboards
After you’ve accessed the real-time monitoring home page, you can open any of the real-time monitoring dashboards.
To open the real-time dashboards
- On the real-time monitoring home page, click View for one of
the following dashboards to open it:
- Incoming tickets
- Ticket progress
- Agent productivity
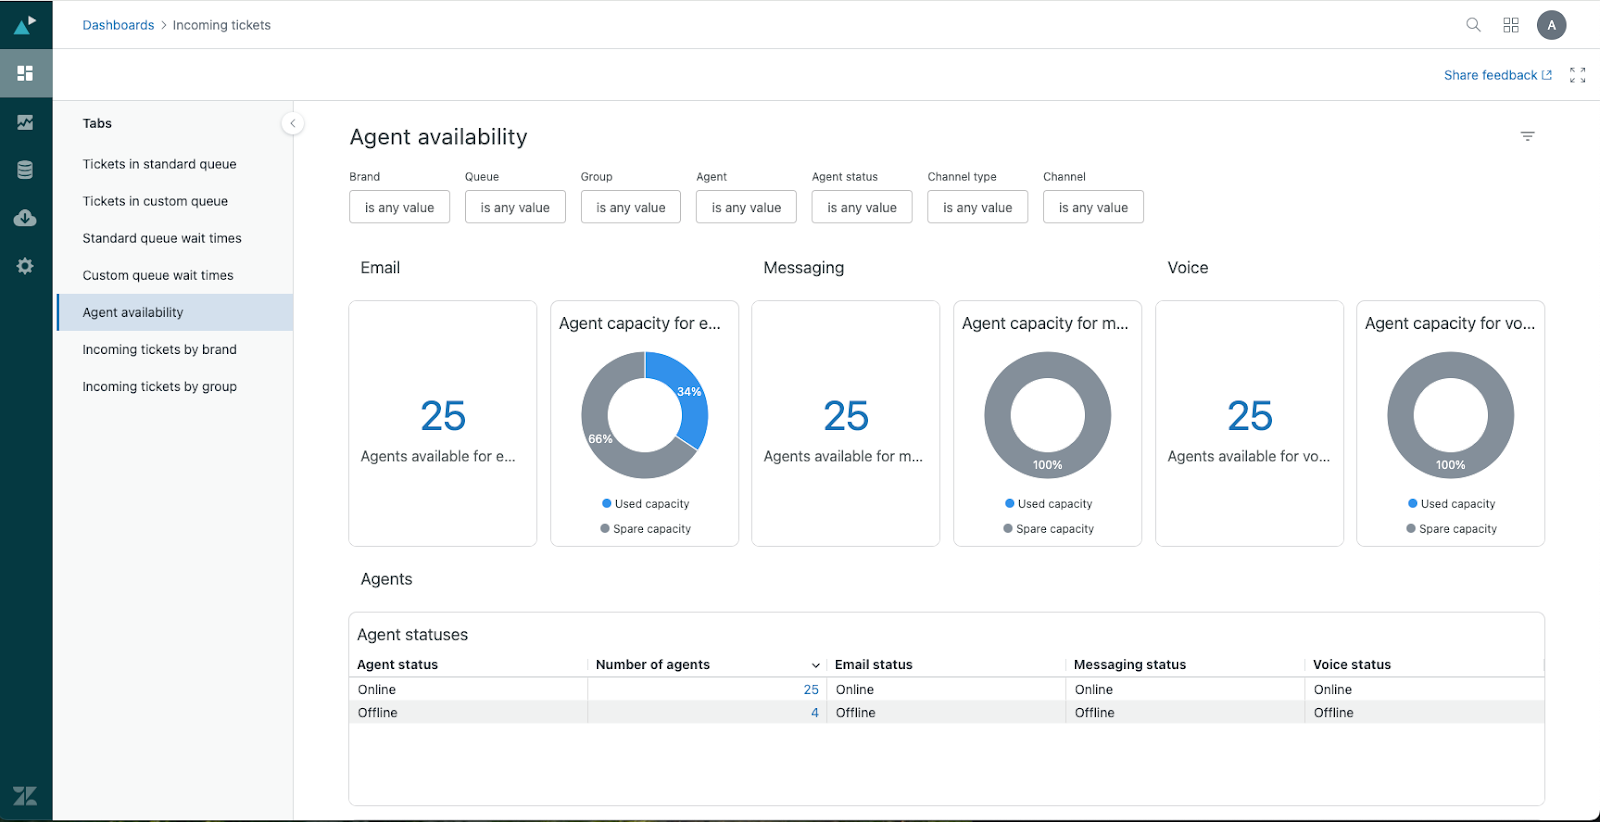
The selected dashboard opens and is ready to use. This example shows the Agent availability tab in the Incoming tickets dashboard.
Tips for using the real-time dashboards
Use the following tips to help you navigate the real-time dashboards:
- Many of the reports are longer than a single page. Scroll down to see all of the reports.
- Many of the tables contain a large number of columns. You might need to scroll horizontally to see all of the information.
- If an item in a report is shown as a blue hyperlink, you can click it to drill
into further information. For example, click the number above New tickets in the
ticket progress dashboard to see a detailed list of all of your tickets with a
status of New.
- From the drill-in page of any dashboard, you can click the ticket ID to open that ticket in Support or the agent name to open the agent's profile.
- In any dashboard, you can hide or show the filters by clicking the filter icon
(
 ).
).