Verified AI summary ◀▼
The Analyst Copilot EAP enhances your analytics experience with AI-driven insights and natural language queries, helping you create reports and dashboards. Key features include project-based organization, memories for persistent insights, and tools for collaboration and data exploration. You can analyze datasets like support tickets and agent activity, manage permissions, and utilize AI suggestions to transform data into actionable stories.
The Analyst Copilot (powered by HyperArc) EAP builds on Zendesk’s analytics capabilities to bring you a powerful, intelligent, and user-friendly analytics experience. The EAP gives you an AI-powered, natural language method of conversing with your data and producing reports.
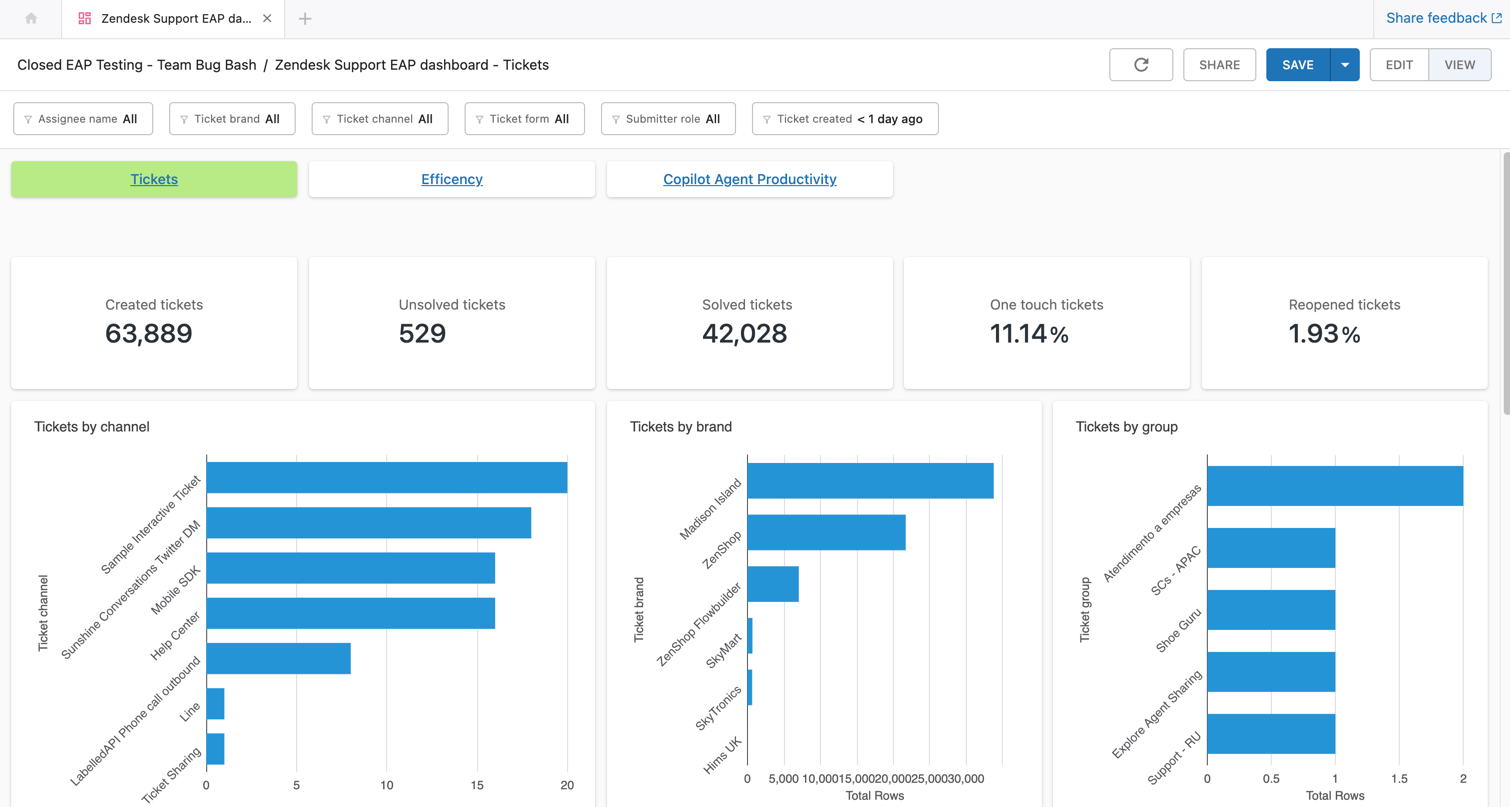
The Analyst Copilot EAP includes the following capabilities:
- A dedicated Analyst Copilot tab within analytics.
- A search-first experience meaning you can explore your data using natural language.
- A modern query-building experience in line with industry standards that enables more intuitive and insightful data interpretation.
- Analyst Copilot records all analysis as memories giving you persistent insights and state saving to enhance continuity.
- Easy collaboration and sharing of findings.
- Advanced filtering and drill-down to deepen exploration of your data.
- AI-driven suggestions and guidance to discover new angles automatically.
- Combines AI and human analysis to transform your data into clear, easy to understand stories that you can act on to improve your service experience.
Currently, the Analyst Copilot EAP includes the following analytics datasets:
- Support tickets: Contains detailed ticket information such as attributes, status, timings, customer and agent metadata, AI-assisted suggestions, and enhanced writing features usage.
- Agent daily snapshot: Contains agent activity metrics such as ticket volumes, resolution statistics, AI and enhanced writing feature usage, roles, groups, and other agent-level attributes.
This article contains the following topics:
Understanding key Analyst Copilot terms
Before you start, review the following terms which will help you understand the building blocks of Analyst Copilot:
- Project: A folder-like container for everything you create (datasets, reports, dashboards, memories) with project‑based sharing and permissions. Projects can be private or you can share them within your organization. All Analyst Copilot assets live in a project.
- Dataset: The data you analyze. For this EAP, Analyst Copilot features two datasets, Support tickets and Agent daily snapshot.
- Report/Query: An analysis you build (using drag‑and‑drop or expressions) that returns results and a visualization. As you create your query, Analyst Copilot creates a HyperGraph containing memories, a record of the steps taken to build the query.
- Dashboard: A canvas where you compose multiple reports into an interactive “app.”
- Memories: An automatically recorded step in your exploration (what you did and found). Memories capture interactions and insights so they’re searchable and reusable later. Users can leverage memories as they explore their question.
- HyperGraph: A visual map of your queries memories. Each node in a HyperGraph is a distinct step (such as a query, metric, or filter) and the links show how those steps relate. This gives you the power to audit and reuse steps, and ask questions grounded in the exact steps that produced your results.
- Natural language questions and answers: Ask questions in plain language. Analyst Copilot finds the best memories to help answer your question.
- Narrate: Turn multiple memories into a coherent story. Extract the common thread and generate a narrative across selected analyses.
- Faceting and Global Filters: Faceting makes visualizations on the same dataset filter one another by default. Global filters apply across widgets and facilitate cross‑dataset interactions. Global filter settings can be carried over between dashboards using links.
- Filter set: A comma-separated list of values that can be used in global and other filters; for example a list of ticket IDs, assignees, or groups.
Understanding Analyst Copilot permissions
To access Analyst Copilot, you must have the following permissions:
- Explore admins have access to all Analyst Copilot projects and content.
Access to Analyst Copilot projects is defined at the group level. Each group can be assigned one of three permission levels on a project, View, Edit, or Admin.
- View: Can view the content within the projects, but cannot modify it. Groups assigned the View permission cannot see project access settings.
- Edit: Can view and modify the content of projects. Groups assigned the View permission cannot see project access settings.
- Admin: Can view and modify the content of projects. Groups assigned the View permission can see project access settings.
During the EAP, because you have Explore admin permissions, you can access all projects.
Opening Analyst Copilot
If you’ve signed up for the Analyst Copilot EAP, you’ll see a new page in Analytics where you can access everything you need.
To access Analyst Copilot
- In the Zendesk product tray, click Analytics.
Analytics opens, on the dashboards library page.
- Click the Analyst Copilot icon (
 ).
).The Analyst Copilot reporting home page opens.
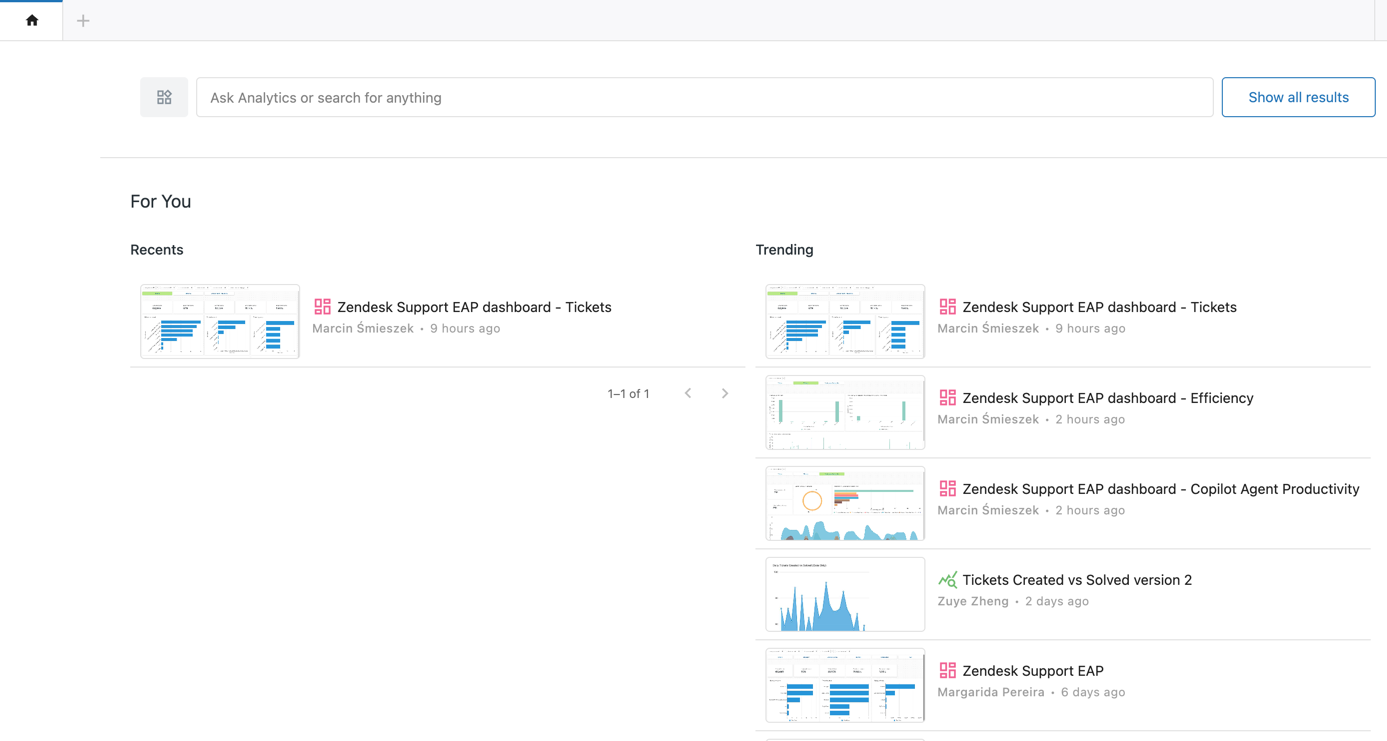
Creating projects
A project is a space to organize your information (datasets, reports, dashboards, memories, and more) with project‑based sharing and permissions. You can keep projects private, share them within your organization, or make them public. All Analyst Copilot assets live in a project.
Project permissions can be either private or Zendesk-only:
- For private projects, the project owner or account admin controls access permissions.
- For Zendesk-only projects, access works like private projects, but all Zendesk users automatically have viewer access by default.
To create a project
- In the Analyst Copilot tab bar, click +.
- On the next page, click + > New project.
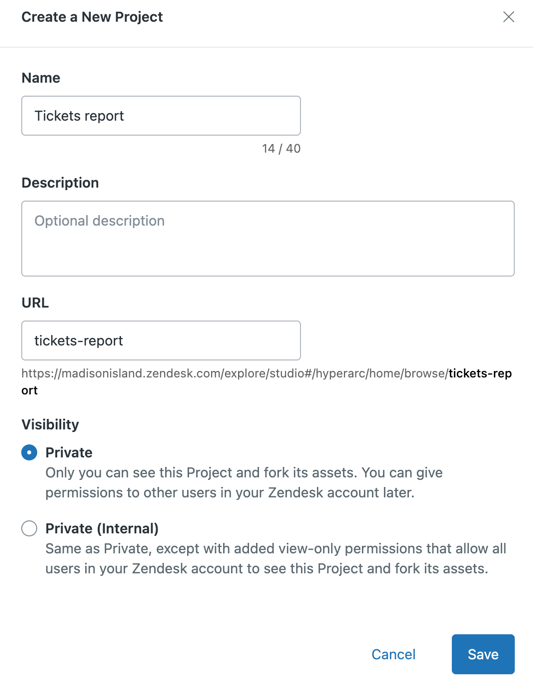
- On the Create a new project page, configure the following:
- Name: Enter a descriptive name for the project.
- Description: Optionally, enter a description for the project to help viewers understand what it contains.
- URL: The URL of the project lets viewers jump directly to it instead of having to navigate to find it. The URL is automatically created based on the project name, but you can edit it to be whatever you want.
-
Visibility: Choose one of the following:
- Private: By default, only you can see the project and its assets. At any time, you can give permission to the project to others.
- Private (internal): Gives read-only permissions to view your project to everyone in your organization.
- Click Save.
The project is created and Analyst Copilot opens the project page.
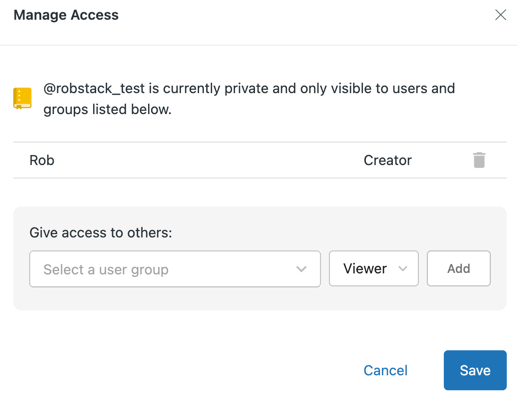
If you want to give others permissions to access the project, you can do this from the Manage access page.
To manage project access permissions
- On the Analyst Copilot home page, scroll down to the All projects section.
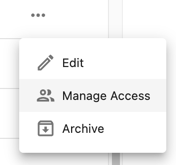
- Hover over the project you want to configure, click the options icon, then click
Manage access.
- On the Manage access page, choose the user or group who you want to give access
to and choose the level of access they need.
- Click Save.
Understanding memories
Memories are a persistent record of all information that Analyst Copilot retains about your business, data, and preferences. They turn one‑off analyses into compounding intelligence, so future questions are answered faster, more accurately, and with consistent definitions.
Examples of Analyst Copilot memories include:
- Business semantics and definitions, for example, the meaning of phrases like “VIP,” “churn,” or “P1”.
- Synonyms and intent (for example, “refunds” and “credits”), plus preferred breakdowns and date ranges.
- Field and entity mappings (which tables or columns represent tickets, customers, products).
- Derived logic (cohorts, thresholds, KPI formulas) and user feedback and corrections.
Memories are created as you use Analyst Copilot from the following events:
- Implicitly, from repeated choices you make (filters, facets, metric definitions).
- Explicitly, when you promote a rule (“Remember this”) with scope controls.
This gives your business the following advantages:
- Disambiguates natural‑language questions using your definitions.
- Enforces KPI consistency across teams, improving trust and comparability.
- Surfaces smarter suggestions and reusable narratives for recurring reports.
Memories can be used to answer many questions. If Analyst Copilot does not have memories relevant to your question, no answer is displayed.
Creating reports
Reports are created from questions you ask about your business information. You can ask natural-language questions, or build reports manually.
For this EAP, the following datasets are available:
- Support tickets: Contains detailed ticket information such as attributes, status, timings, customer and agent metadata, AI-assisted suggestions, and enhanced writing features usage.
- Agent daily snapshot: Contains agent activity metrics such as ticket volumes, resolution stats, AI and enhanced writing feature usage, roles, groups, and other agent-level attributes.
This section contains the following topics:
Creating a report by asking a question
Analyst Copilot understands natural language questions, so the best place to start is to ask it something.
To ask Analyst Copilot a question
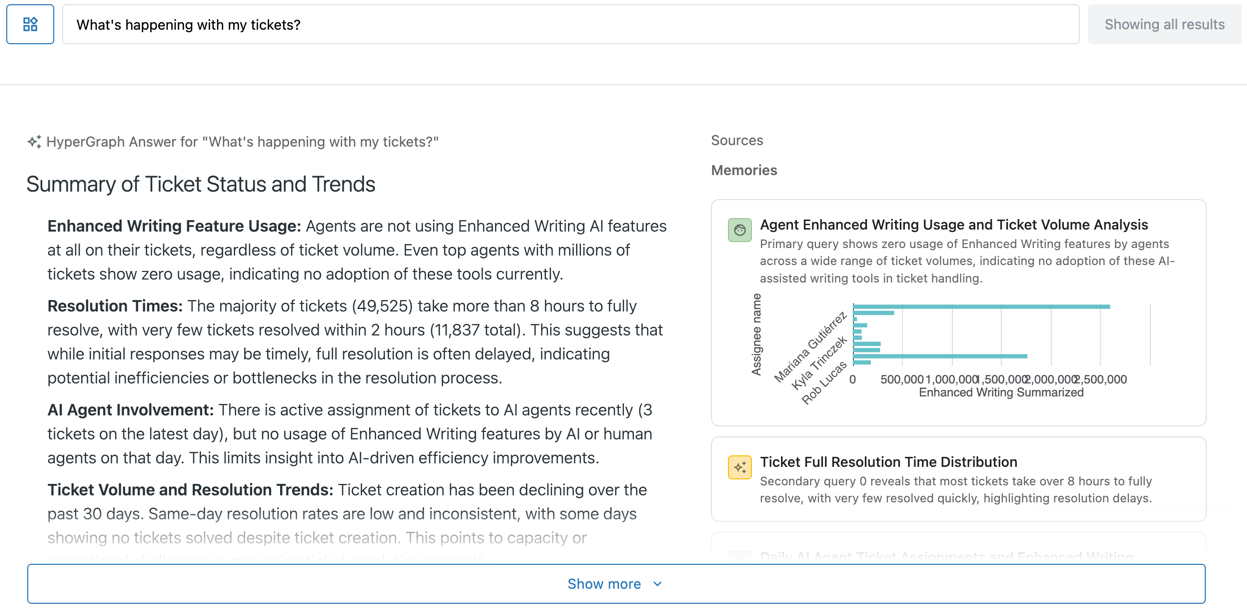
- On the Analyst Copilot home page, in the question field, enter
your question. For example, if you enter “What’s happening with my
tickets?”

Analyst Copilot returns an answer together with any relevant memories.
- Click a memory in the right-hand panel to see further information
about the item.
Below your report, you’ll see a list of assets (such as reports, dashboards, and datasets) related to your question.
Here are more examples of questions you can ask of your data:
- How many unsolved tickets do I currently have?
- Who solved the most tickets last year?
- Show my tickets by status
- How many unsolved tickets are assigned to Rob Stack?
If Analyst Copilot does not have the information to answer your question, no answer or memories are displayed.
Building reports manually
In this section, you’ll create a report using the metrics and attributes in one of your datasets.
Use this procedure to create a simple report containing metrics, attributes, and a filter. This example displays all tickets solved by Rob Waller in 2024.
To create a simple report
- In Analyst Copilot, click +.
- Click New query.
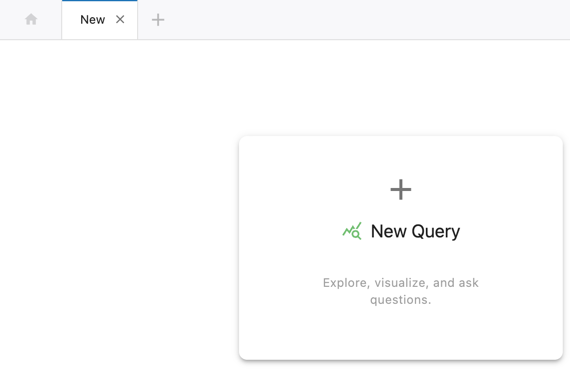
- On the Select a dataset to query page, click the dataset containing the information you want to report. For this example, click Support tickets. A new page opens with a blank report.
- Filter the report to display tickets solved in 2024. Under the filters panel, click +.
- In the filter chooser, click Ticket solved. The filter is added to your report.
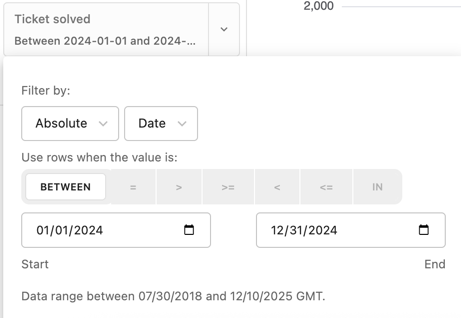
- Next, apply a date range to the filter. Click the Ticket solved filter you just added.
- In the filter options, configure the following settings:
- Filter by: Select Absolute and Date.
- Use rows when the value is: Select BETWEEN.
- Start and end dates: Set these values to the start and end of 2024 as shown in the screenshot below.
- Under the filters panel, click +.
- In the filter chooser, click Assignee name. The filter is added to your report.
- In the filter options, configure the following settings:
- Use rows when the value is: Select IN.
- From the list of names, choose Rob Waller.
- Add a final filter for tickets that are in the Solved state. Click Add filter and select Ticket status.
- From the list of statuses, select Solved (the status name
might vary if you've configured custom ticket statuses).Tip: While you are creating the report, watch the status indicator at the bottom left of the page. This provides helpful suggestions to improve your reporting and also informs you when your actions are added to Analyst Copilot's memories where they can be accessed later.
Managing and analyzing reports
After you've created a report, Analyst Copilot contains a range of tools to help you analyze your data, and edit your report:
- Adding columns
- Changing a report visualization type
- Using report grouping and limiting options
- Filtering reports
- Creating expressions
- Using AI-powered suggestions
- Using drill-in to explore your data
- Navigating memories in a report
- Creating new reports from memories
- Combining memories
- Narrating memories
- Saving reports
- Viewing report versions
- Forking reports
- Archiving reports
- Sharing reports
Adding columns
You can add more columns to a report to show more information.
To add columns to a report
- From the Dataset panel of your report, drag the dimensions you want into the Fields section.
- Drag and drop the dimensions you added into the order you want.
Changing a report visualization type
You can choose from a range of visualization types such as tables, pie charts, and column charts to present your report how you want.
To change the visualization type
- In any report, click the Type drop down in the Visualization section.
- From the list, select the visualization type you want.
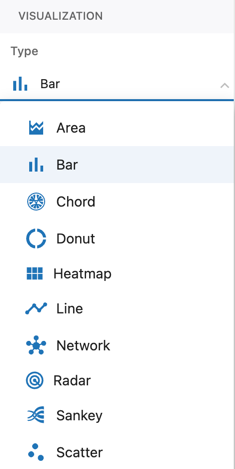
The report updates to display the new visualization type.
Using report grouping and limiting options
Analytics Copilot offers several ways you can group, organize, and limit your report results, including:
- Sort descending: Organizes results in descending order using a selected field as a key.
- Sort ascending: Organizes results in ascending order using a selected field as a key.
- Add filter: Creates a filter based on a selected field.
- Cumulative: Provides a running total of grouping results.
- Rename: Rename a field value.
- Remove: Removes the selected metric. You must have at least one metric in your report.
- Limit: Limits the results to a specified number.
To group your report results
- In a report, click the down arrow next to any field.
- From the grouping list, select the option you want.
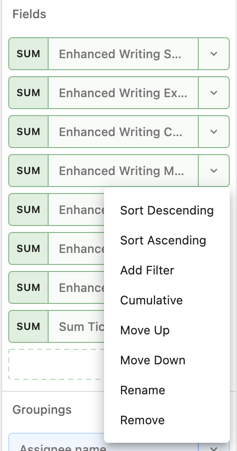
The report updates with the new grouping.
To limit your report results
- In a report, change the Limit value to the number of results you want returned.
The report updates showing only the number of results you specified.

Filtering reports
You can filter a report to show only the information you need, for example, tickets solved by a particular agent, or tickets solved between two dates.
To filter a report
- In the Filters panel of a report, click +.
- From the list of filters, click the one you want to add. The filter is added to your report and the filter options open.
- In the filter options, configure information for the filter, for example, a date range or an agent name.
The report updates to show the filtered results.
Filter expressions
When using more than one filter, you can configure logical dependencies between them. For example, using three filters, you might want them to work together:
Select: “1 AND 2 AND 3”Alternatively, you might want your report to consider results matching the first filter, or any of the following filters:
Select: “1 AND (2 OR 3)”To configure a filter expression
- Add at least one filter to your report.
- In the Filters panel, click the settings icon (
), then click Edit filter expression.
- Enter your filter expression, then click Save.
Creating expressions
In addition to selecting filters from a list, you can also create expression fields that let you use data that might not be available in your prebuilt datasets. For example, you could create a new metric using an expression that subtracts the ticket created date from the ticket solved date to indicate the time the ticket was opened.
To create an expression
- In the Fields panel of a report, click +.
- Click the Create expression field tab.
- On the Edit expression page, configure an expression and a new metric name for it. You can use any field name contained in your query and any column in your dataset.
- In the as: field enter a name for the new metric, such as "Tickets not solved".
You can also use the same method to create custom attributes.
Using AI-powered suggestions
As you work in Analyst Copilot, AI suggestions can be displayed, giving you ideas on further reports you might find useful.
To use AI-powered suggestions
- In any report, a list of AI-powered suggestions are displayed at the bottom of the page when a memory is created. Click a suggestion to learn more.
- The suggestion is expanded with more information. Click Apply
suggestion to update your report or click Try this in a new
query to open the suggestion in a new report.

Additionally, you can manually generate suggestions.
To manually generate suggestions
- Open the memories panel.
- Click a memory for which you want to generate suggestions.
- In the memory narration panel, click the find inspiration icon
.
Using drill-in to explore your data
Analyst Copilot provides tools to further analyze your reports by using drill in.
To drill into a report
- In your report, click one of the results, for example, a column in
your chart.
The drill-in panel opens at the bottom of the page.
- Click Drill-in.

The report updates displaying the item you drilled in to. You can click Annotate to add this report to your memories.
Navigating memories in a report
Analyst Copilot features a number of tools to navigate and manage your memories.
To view and navigate memories
- In any report, click Memory.
- Click a memory to see its details.
- Try using some of the following actions to see how they affect
your memories and reports.
- Click a memory to update the report visualization to match
the memory.
Each memory has a card with a summary and analysis describing what is being shown in the report.
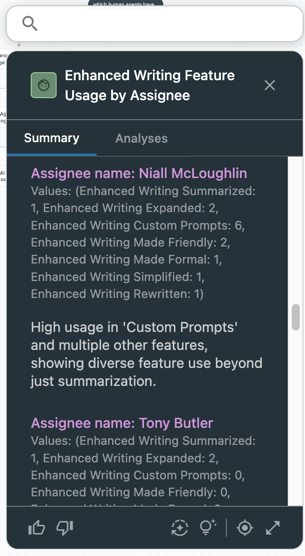
- Click the thumbs up or down icons to indicate to Analyst Copilot if the memory was useful. This helps memories become more accurate over time.
- The Refresh and analyze button (
 ) refreshes the memory
summary with the latest dataset update.
 - The Find inspiration button (
 ) gives you suggestions on
other reports you might find useful.
- Click a memory to update the report visualization to match
the memory.
- Click Memory to close the memories diagram.
Creating new reports from memories
You can use Analyst Copilot memories to create new reports.
To create a new report from a memory
- In a report, click Memory.
- Click one of your memories to see its details.
- In any memory, you can fork the report to create a new one.
- When you are finished, close the memory.
Combining memories
You can combine memories to create new ones. This lets you "pick and choose" metrics and attributes from different memories. For example, one of your memories includes a metric of your solved tickets. The other contains an attribute of the ticket requester's region. You can combine these into a new memory for solved tickets by region.
To combine memories
- In a report, click Memory.
- In the memory panel, select one or more memories, then click Combine.
- On the Combine memories page, enter a description of the report you're trying to create. For example, "Who had the largest workload in each region?"
- Analyst Copilot creates a new report and memory based on the memories you selected and the description you entered.
Narrating memories
From memories you select, you can use one or more of them to create a story. For example, if you ask the question, "My department is very busy. Why is that?", Analyst Copilot creates a report you can use to help you understand reasons why your department is busy.
To narrate memories
- In a report, click Memory.
- In the memory panel, select at least two memories, then click Narrate.
- On the input page, enter the story you want to tell, for example, "When are my busiest periods? When is it quiet?"
- Click Narrate.
Analyst Copilot displays a report containing insights, reasons, and potential actions to help you understand your busiest and quietest periods.
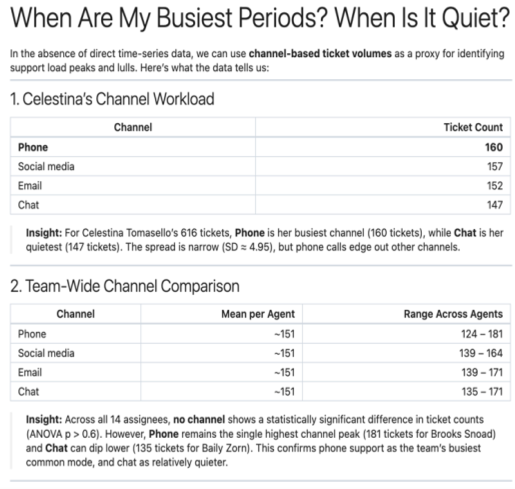
Saving reports
Once you've finished editing your report, you can save it so it's available later.
To save a report
- In a report, click Save or Save as.
- Provide the following information:
- If you're saving a report for the first time:
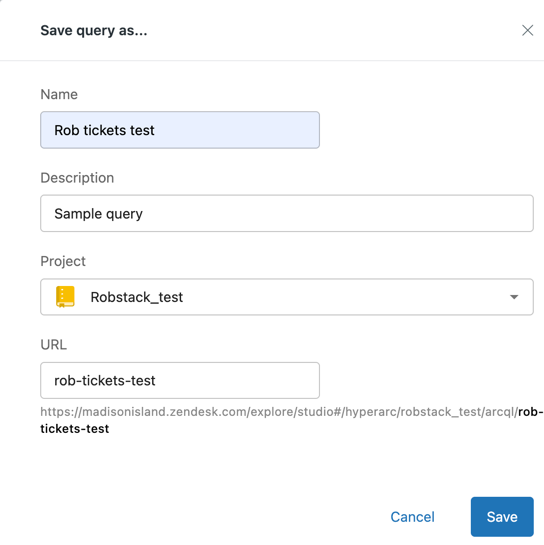
- On the Save query as page, provide the following
information:
- Name: Enter a name for the report.
- Description: Optionally, enter a description for the report.
- Project: Choose the project where your report will be saved.
- URL: The URL for the report is created automatically from the report name, but you can change this if required.
- Click Save.
- On the Save query as page, provide the following
information:
- If you're saving a report that was previously saved:
- On the What's changed page, review the AI-generated summary of changes since you last saved.
- Click Save.
- If you're saving a report for the first time:
Viewing report versions
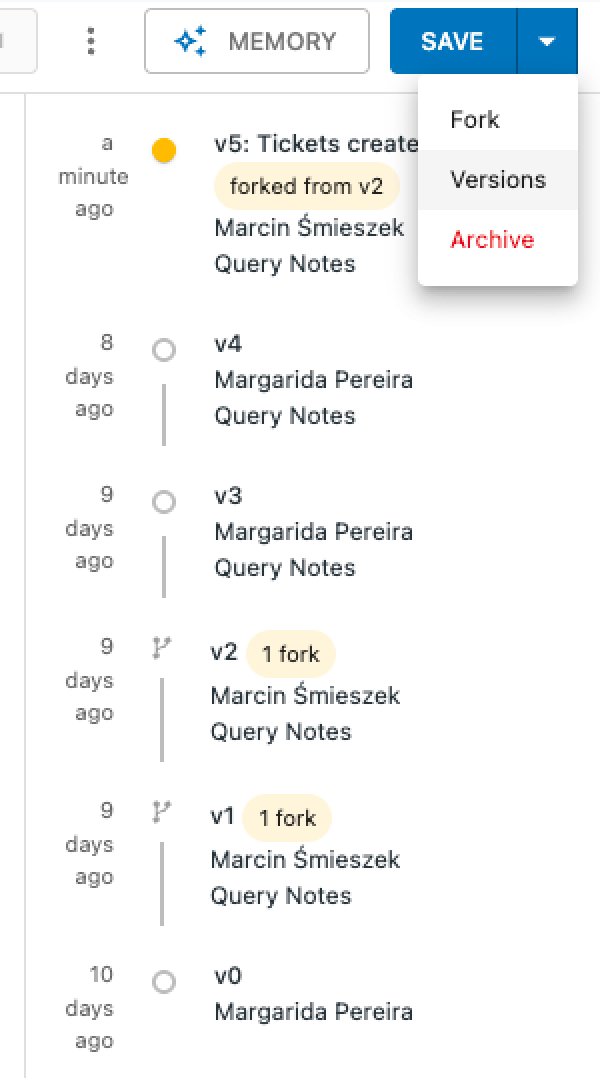
Every time you change or save a report, a new version is created. However, all previous versions of the report and its HyperGraph are retained. This means that you can roll back to a previous version of the report at any time.
You can also go back to an earlier report version, fork it, and save it as a new report. The most recent version of the report is retained.
To view a report's versions
- In a report that was previously saved, click Save >
Versions.
The versions panel opens displaying a history of changes to your report. Each version is described with the date of the change, and the user who made the change. The version will also indicate if the report was forked.
- Click on any version in the list to preview it.
- Click Save while viewing any version to restore it. This version will be saved as the most recent one. The previous version is saved so you can restore it if you need to.
Forking reports
Forking creates a new report from the original report and opens a new tab containing the forked report which you can name and edit as required.
Advantages of forking reports include:
- Retain context: When a user forks a report, the new report retains a memory of the original analysis, including the previous steps, context, intuitions, and references used to generate the initial result.
- Customize and dig deeper: Analysts can take a current data visualization or analysis and use it as a starting point for further customization and deeper investigation, without altering the original report.
- Build an Analytics "page rank": Analyst Copilot uses the relationships between these forked reports (or memories) to build a knowledge graph. This boosts the most relevant memories to the top for future, related questions, making Analyst Copilot get smarter over time.
To fork a report
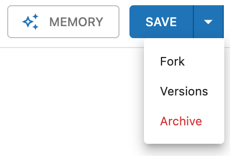
- In a report, click Save > Fork.
A copy of the report is created and opened.
Archiving reports
When you archive a report, it's deleted from the project and the assets list and you can no longer access it.
To archive a report
- From a report. click Save > Archive.
- On the confirmation page, click Archive query.

Sharing reports
You can share your reports with other people as comma-separated-values (CSV) or image (JPEG) files.
To export a report
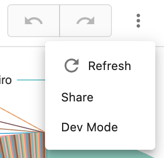
- In a report, click the three dots, then select Share.
- In the export options, select IMG or CSV format for your report export.
Your report is exported. You’ll find the exported report in the Downloads folder of your computer.
Creating dashboards
Dashboards are where you compile your reports into a single space where you can then share them with others. You can enhance dashboards with filters, text, images, and more. You can drag and drop reports and other dashboard components to get the dashboard looking exactly how you want.
This section contains the following topics:
Creating a dashboard
Before you can start adding reports and widgets, you need to create a dashboard.
To create a dashboard
- In Analyst Copilot click +, then click New
dashboard.
A new, blank dashboard opens.

Adding reports to a dashboard
You can add any report you previously created to a dashboard.
To add a report
- In a dashboard, click Chart. The Select a query to add page opens.
- Click the report you want to add. The report is immediately added to the dashboard.
- You can drag and drop to move or resize the report so it looks
just how you want.Tip: If your dashboard contains many components, try holding the shift key down as you drag a component. This can help stop components ‘jumping around’ as the dashboard dynamically rearranges them.
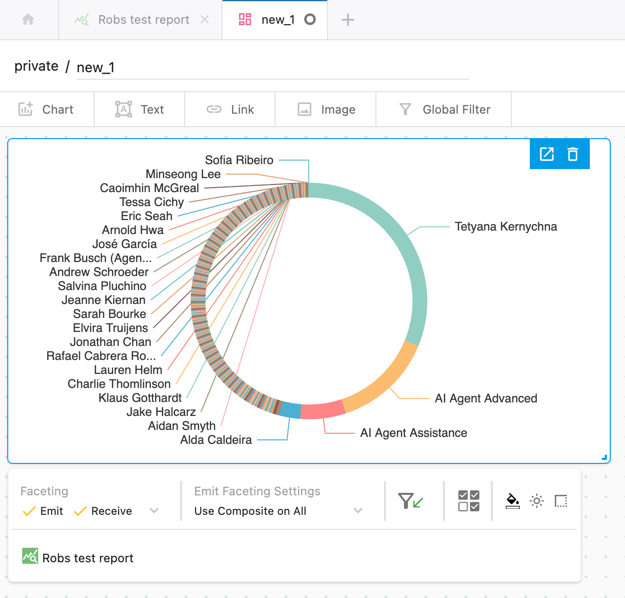
- You can also configure how the report widget interacts with global filters
and faceting. Faceting
- Emit: Selecting a value (for example a column) on the report will send a faceting event to other components on the dashboard, filtering their results by the value selected in this component.
- Receive: When unchecked, the component will ignore faceting events from other components.
-
Emit faceting settings:
- Use composite on all: Use all groupings to facet receiving queries.
- Fact first grouping only: Use the first grouping only to facet receiving queries.
Global filters
Use this option to configure the widget to ignore or respect the dashboard global filters.
Use the undo and redo buttons if you make a mistake.
Removing reports from a dashboard
Use the following procedure if you no longer need a report on your dashboard.
To remove a report from a dashboard
- On the dashboard, click the report you want to delete from the dashboard..
- Click the delete icon (
 ).
).The report is removed from the dashboard.
Saving dashboards
Once you’ve created a dashboard, you can save it so you can continue to work on it later.
To save a dashboard
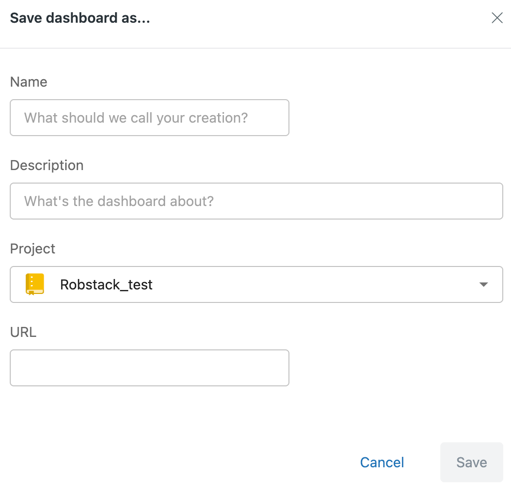
- In a dashboard, click Save or Save as.
- On the save page, enter the following information:
- Name: Enter a descriptive name for the project.
- Description: Optionally, enter a description for the project to make it easier for viewers to understand what it contains.
- Project: From the drop-down, select the project where the dashboard will be saved.
- URL: The URL of the dashboard lets viewers jump directly to it instead of having to navigate to find it. The URL is automatically created based on the dashboard name, but you can edit it to be whatever you want.
Closing dashboards
When you’ve finished working with a dashboard, you can close it. Make sure to save the dashboard before you close it.
To close a dashboard
- In the Analyst Copilot tab bar, find the tab containing your dashboard.
- Click x next to the dashboard name.
The dashboard closes.
Sharing dashboards
You can download a shareable image image of a dashboard, or provide a URL to it.
To share a dashboard
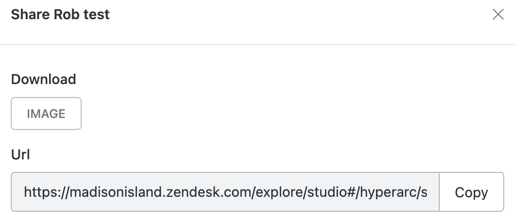
- With your dashboard in View mode, click Share.

- On the Share page, do one of the following:
- Click Image to download your dashboard as a JPEG image. You'll find your image in the Downloads folder on your computer.
- Click Copy to copy the URL of the dashboard to your clipboard. You can then share this URL with others.
Editing dashboards
Once you’ve created a dashboard and added reports, there are a number of editing options you can use.
To edit a dashboard
- From the list of assets on the Analyst Copilot home page, click the dashboard you want to edit.
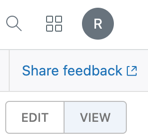
- In the dashboard, set the toggle switch from View to
Edit.
The following topics detail some of the editing options you can use:
Renaming dashboards
If required, you can change the name of a dashboard.
To change a dashboard name
- With a dashboard open and in edit mode, click the dashboard name.
- Enter a new dashboard name.
- Click Save.

Adding images to dashboards
You can add images to your dashboard to give it your company branding or to make the dashboard more visually engaging.
To add an image to a dashboard
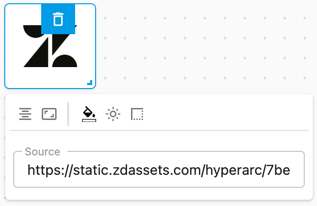
- In a dashboard, drag and drop the image component from the tab bar into the dashboard.
- Click the image component you just added. The following options
are displayed:
- Alignment: Justify the alignment of the image inside its dashboard component.
- Scale: Scale the image to fit the component or revert it to its original size.
- Background color: Configure a background color for the image component.
- Drop shadow: Turn on or off a drop shadow on the image.
- Border: Various options to configure a border around the image.
- Source: Enter a location where Analyst Copilot can find the image.
- After you've confiugred the setting you want, click away from the image settings.
Adding text to dashboards
You can add text to your dashboard to provide further information to viewers.
To add text to a dashboard
- In a dashboard, drag and drop the text component from the tab bar into the dashboard.
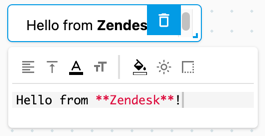
- In the text box, enter the text you want displayed on the dashboard. The text input box supports Markdown formatting. For example, you could enter "Hello from **Zendesk**" to display "Hello from Zendesk".
- Configure the following text component options as required:
- Horizontal alignment: Controls the horizontal alignment of the text inside the text component.
- Vertical alignment: Controls the horizontal alignment of the text inside the text component.
- Font color: Controls the font color of the text.
- Font size: Controls the font size of the text.
- Widget background color: Controls the background color of the text.
- Drop shadow: Adds or removes a drop shadow effect on the text component.
- Border configuration: Creates a border around the text using the selected style.
Click away from the text component to hide the text options menu.
Adding links to dashboards
You can add clickable links to external sites, or to other Analyst Copilot assets.
To add a link to the dashboard
- In a dashboard, drag and drop the link component from the tab bar into the dashboard.
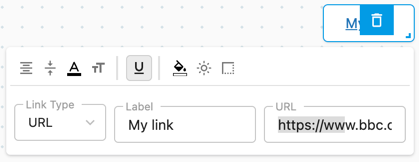
- In the link component choose the link type you want to add. You can add a link to another Analyst Copilot asset (for example another dashboard or report) or link to an external web site using a URL.
- Configure the following information for the link:
For URL links
- Link type: Select URL.
- Label: Enter the text that will appear for the link.
-
URL: Enter the URL for the link.
For asset links
- Link type: Select Asset
- Label: Enter the text that will appear for the link.
- Asset: Opens a list where you can choose the report or dashboard you want to add.
-
Pass state: From the drop down, select if you want
any filters from the selected asset reflected when a user clicks the
link.

- Configure the following formatting options as required:
- Horizontal alignment: Controls the horizontal alignment of the text inside the text component.
- Vertical alignment: Controls the horizontal alignment of the text inside the text component.
- Font color: Controls the font color of the text.
- Font size: Controls the font size of the text.
- Underline: Underlines the current link.
- Widget background color: Controls the background color of the text.
- Drop shadow: Adds or removes a drop shadow effect on the text component.
- Border configuration: Creates a border around the text using the selected style
Click away from the link component to hide the link options menu. Now, when the dashboard is in view mode, clicking the link text will take you to the configured asset or URL.
Refining your results
After you've created a dashboard, Analyst Copilot includes tools you can use to show only the results you want. These tools include faceting and global filters.
This section contains the following topics:
Using faceting
Faceting lets you ask second-order questions about your data by helping you highlight and focus on a specific subset of your data, meaning you can conduct a deep dive into areas of particular interest.
By using faceting, you can ask subsequent questions about your data without having to create a new query.
Before you start, you’ll need a dashboard containing at least two reports that use the same dataset.
To use faceting
- In the dashboard, set the toggle switch to View.
- Click one of the data fields in your dashboard.
The entire dashboard is filtered by the data you selected and an extra filter is added to the dashboard.
Using global filters
When you apply a global filter to your dashboard, it affects all reports on the dashboard. The global dashboard filter works on top of any individual reports filters or settings.
To apply a global filter
- In a dashboard that contains at least one report, click Edit.
- Click Global filter.
- From the list, choose the filter you want to add, then set the
value for the filter. For example, you could choose a date filter to show
only results from the last 30 days.

The dashboard updates to reflect the values you configured.
With the dashboard In Edit mode you can choose from global filters and set their defaults. In View mode you can only choose from filters.