Verified AI summary ◀▼
Use the quick answers dashboard to analyze how customers interact with quick, generative answers in your help center. Gain insights into search volume, answer types, and customer feedback. Identify content areas needing improvement and track which articles generate the most interactions. Filter reports by time, brand, and more to enhance support and boost self-service success.
Zendesk features a prebuilt quick answers dashboard within the Knowledge dashboard that helps you understand how your customers receive quick, generative answers through search. This dashboard provides insights into search volume, the types of answers served, and customer feedback on those answers. It helps you identify which topics generate the most quick answer interactions and highlights areas where content might need improvement to enhance support efficiency and boost self-service success.
In the following topics, you'll learn how to access the quick answers dashboard and see the available reports:
Accessing the quick answers dashboard
Use the following procedure to access the quick answers dashboard.
To access the quick answers dashboard
- Click the Zendesk Products icon (
 ) in the top bar, then select Analytics.
 - From the list of dashboards, select the Zendesk Knowledge dashboard.
- Click the Quick answers tab.
Understanding the quick answers dashboard reports
The quick answers dashboard shows how searches in your help center are being answered, including whether users receive a quick answer, an article-only result, or no result. You can filter the reports by time, brand, search channel, user role, and locale.
Use this dashboard to get a detailed picture of your help center’s performance, including:
- Which result types are most common (quick answers, article-only results, or no result).
- Where users are frustrated or unable to find information by viewing quick answer feedback (by giving a thumbs up or down). This helps you identify content that needs to be improved.
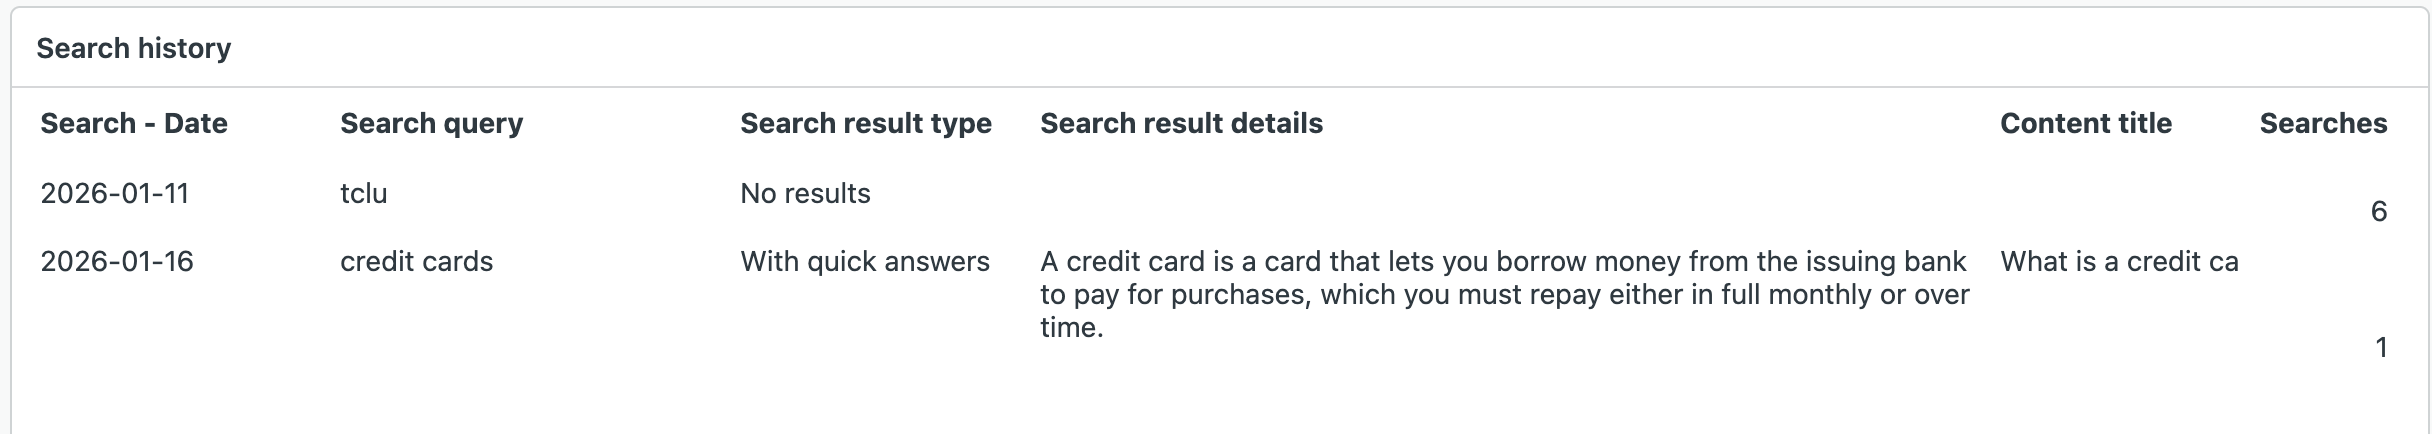
- A full search history for each query, including the search term, the type of result shown, when a quick answer was returned, and the answer text and source article used to generate it.
- Which articles are most frequently used to generate quick answers, giving you insight into the articles customers visit most often.
Quick answers dashboard headline metrics
This dashboard displays the following headline metrics (KPIs) for the time range you specify:
- Searches: The total number of searches users performed in your knowledge base.
- Searches with quick answer: The number of searches that returned a quick answer.
- Searches with article-only results: The number of searches that returned related articles but did not generate a quick answer.
- Searches with no results The number of searches that returned no results.

Quick answers dashboard reports
This dashboard includes the following reports for the time range and filters you specify:
-
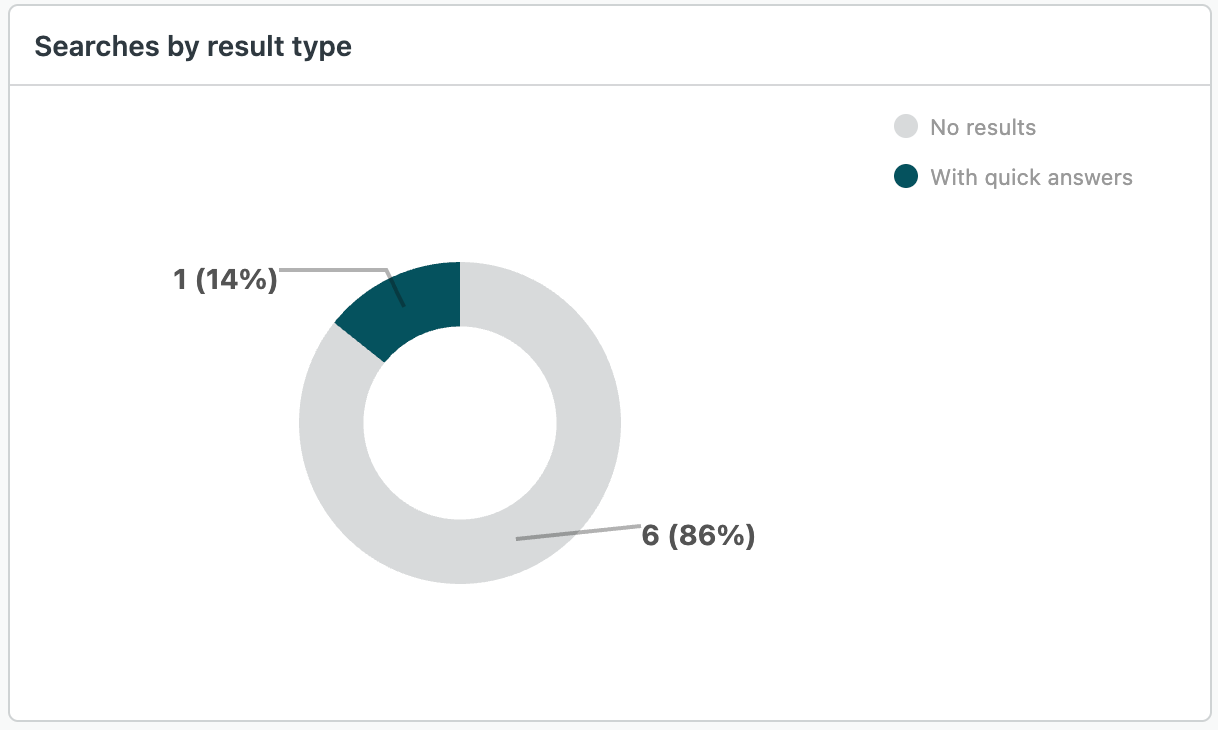
Searches by result type: Shows the distribution of searches by
result type (quick answer, article-only, no result), so you can quickly see how
often quick answers are delivered.
-
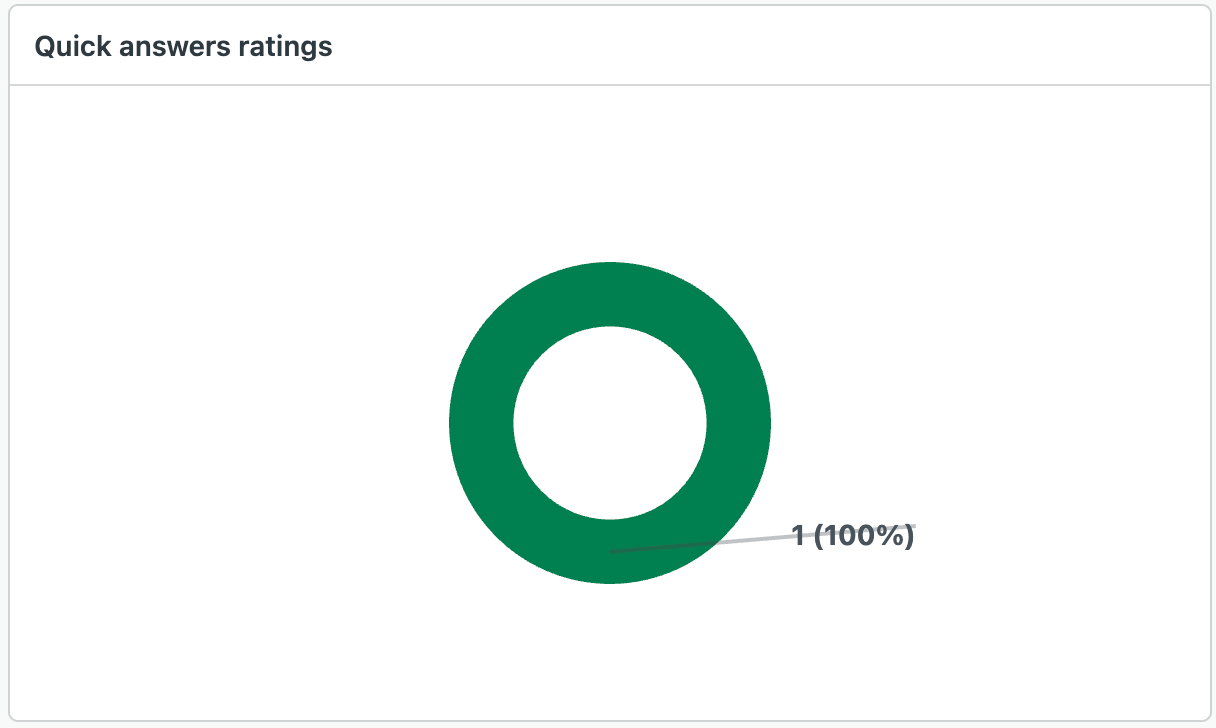
Quick answers ratings: Displays thumb up or thumb down feedback
for quick answers, helping you measure the customer satisfaction with quick
answers.
-
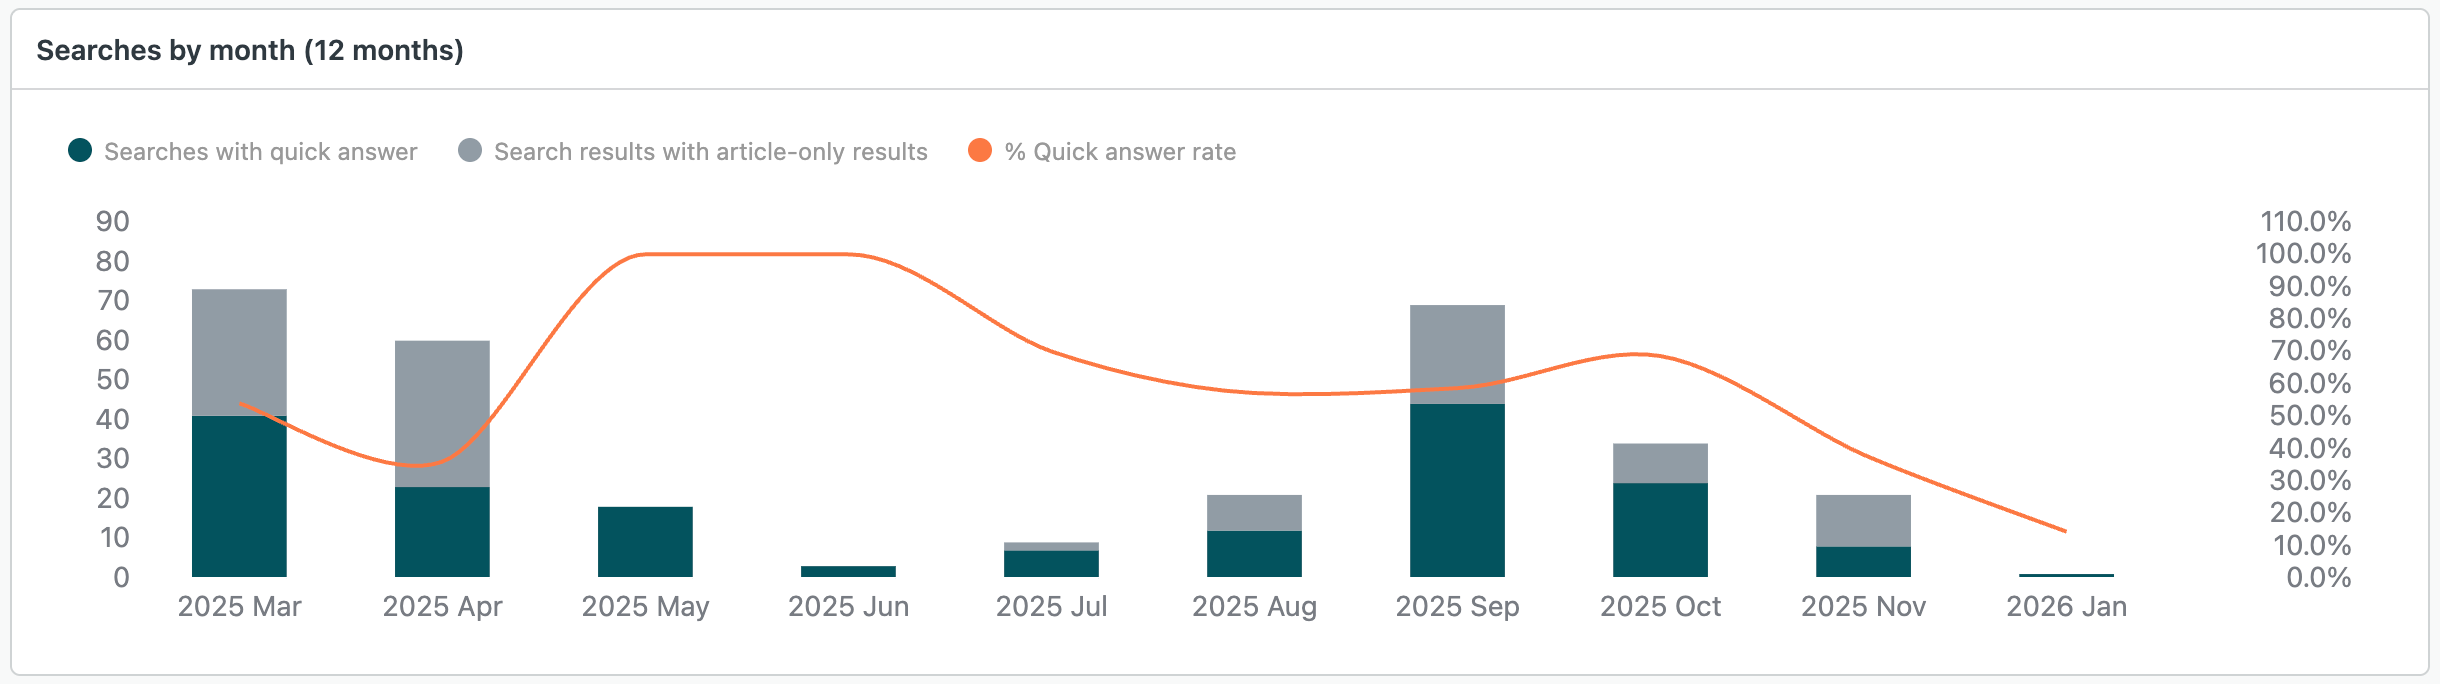
Searches by month (12 months): A month-by-month view of search
activity to help you identify trends.
-
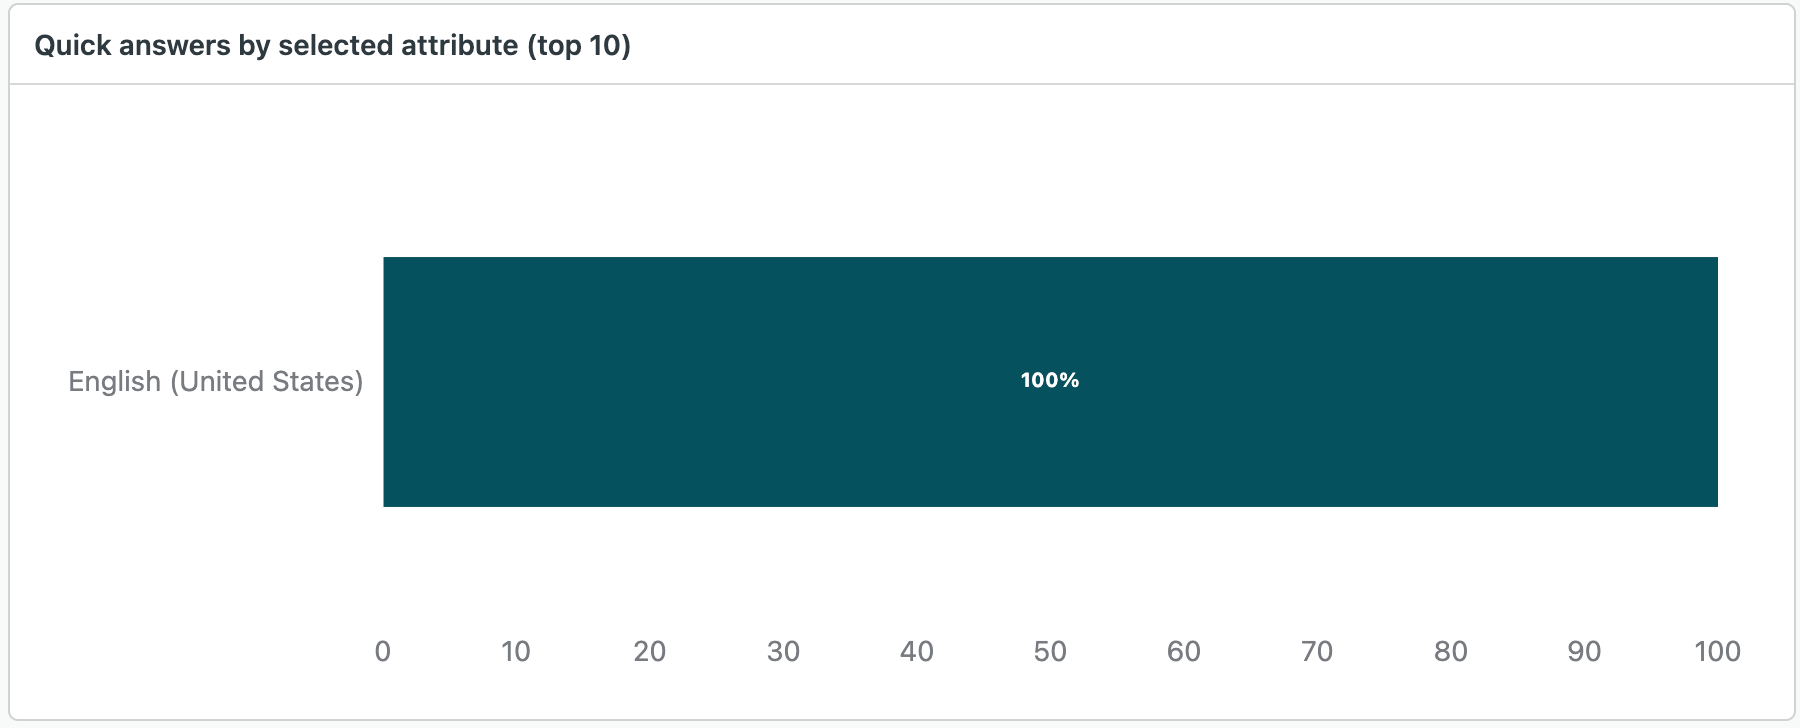
Quick answers by selected attribute (top 10): Ranks the top 10
values for a selected attribute (for example: content language, brand, content
type) that generate quick answers.
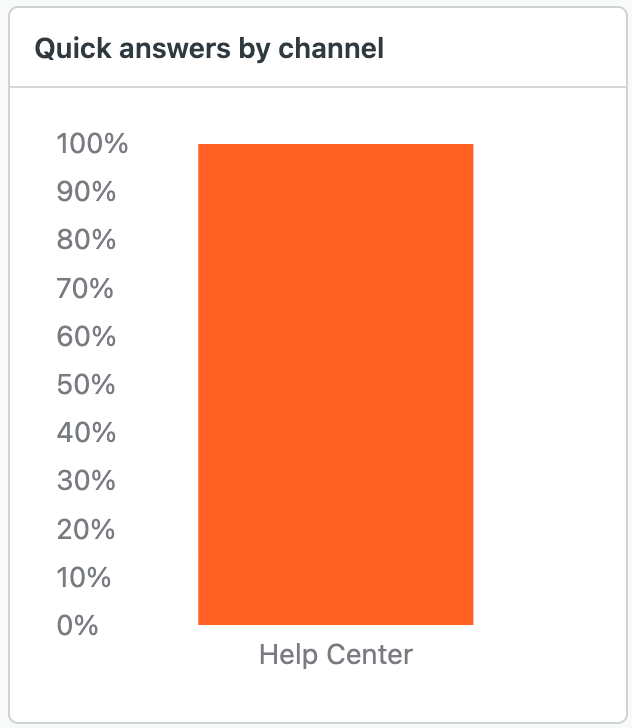
- Quick answers by channel:
-
Search history: A detailed table of search queries showing the
query string, result type returned, search channel, and, when applicable, the
quick answer text and the source article.
-
Content used to provide quick answers: Lists the articles and
content most frequently used to create quick answers, giving you a clear view of
the topics driving self-service interactions.
