Summary: ◀▼
Create analyst copilot dashboards to combine reports, KPIs, text, images, and links in one view. You can drag and drop components, add tabs, apply filters and cross-filters, share dashboards by URL or image, and save versions to track changes. View and edit modes, permissions, and advanced settings help you tailor dashboards for reporting, analysis, and team collaboration.
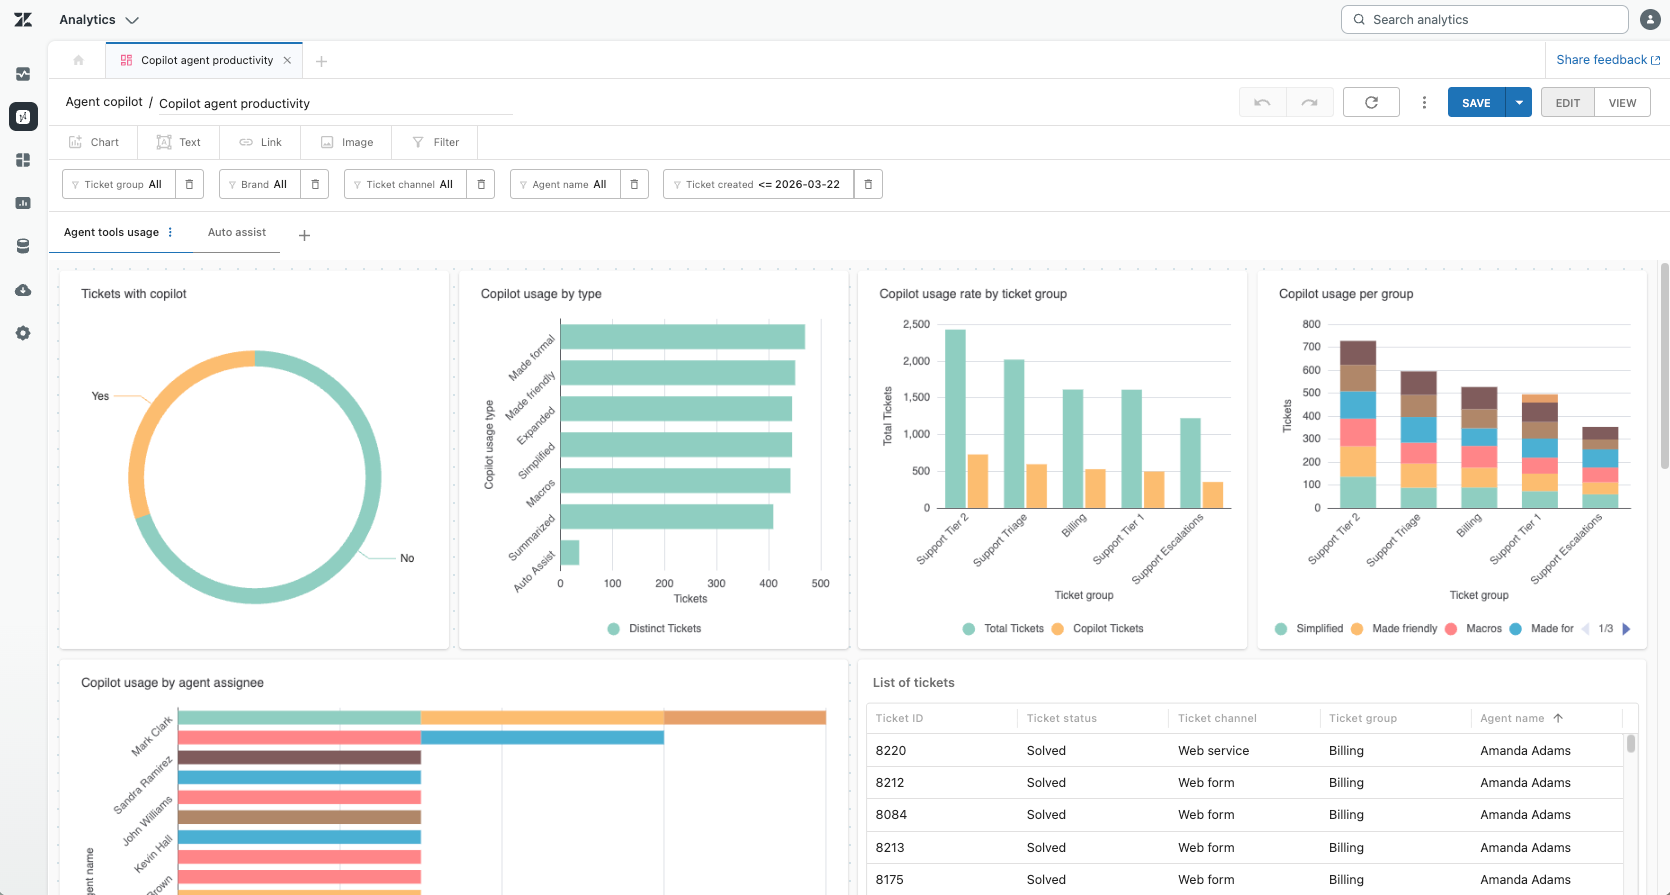
Dashboards serve as a customizable canvas where you can combine multiple reports (for example, charts, tables, or KPIs) and interactive elements, allowing you and your stakeholders to see key metrics and analyses in a single, consolidated view. They are highly interactive, supporting features like filters and drill-downs, enabling users to analyze data from different angles without needing to build custom reports every time. You create and view dashboards in analyst copilot.
This article contains the following topics:
About dashboards
Analyst copilot includes several prebuilt dashboards covering useful scenarios. In addition to these, you can also create your own custom dashboards using analyst copilot to suit your business needs.
Key features of dashboards include:
- Pulls together your most useful reports in one place.
- Drag-and-drop editing. Coding or database skills are not required to build dashboards.
- Cross-filters and filters affect all or specific dashboard components, making it easy to slice your data by date range, agent, team, region, and more. Cross-filtering allows interactive filtering; clicking one visualization updates others in real time.
- Supports branded images, narrative text blocks (with Markdown formatting), and links to external resources or other assets.
- Dashboards can be saved to projects, shared as URLs, or exported as images for use in presentations or with external audiences. Permissions are managed so only authorized users can edit or view dashboards.
- Every save creates a new version, making it simple to track changes or revert to previous states.
Creating dashboards
Dashboards compile your reports into a single space where you can then share them with others. You can enhance dashboards with filters, text, images, and more. You can drag and drop reports and other dashboard components to get the dashboard looking exactly how you want.
This section contains the following topics:
Creating a dashboard
Before you can start adding reports and other components, you need to create a dashboard.
To create a dashboard
- In Analytics, click the Home (
 )
icon in the sidebar.
)
icon in the sidebar. - Click the create icon (+), then select New
dashboard.
A new, empty dashboard opens.

Adding reports to a dashboard
You can add reports you previously created to a dashboard.
To add a report
- Open a dashboard, then click Chart.
- Click the report you want to add. The report is immediately added to the dashboard.
- You can drag and drop to move or resize the report so it looks
just how you want.Tip: If your dashboard contains many components, hold the Shift key as you drag a component to help prevent components from dynamically rearranging.
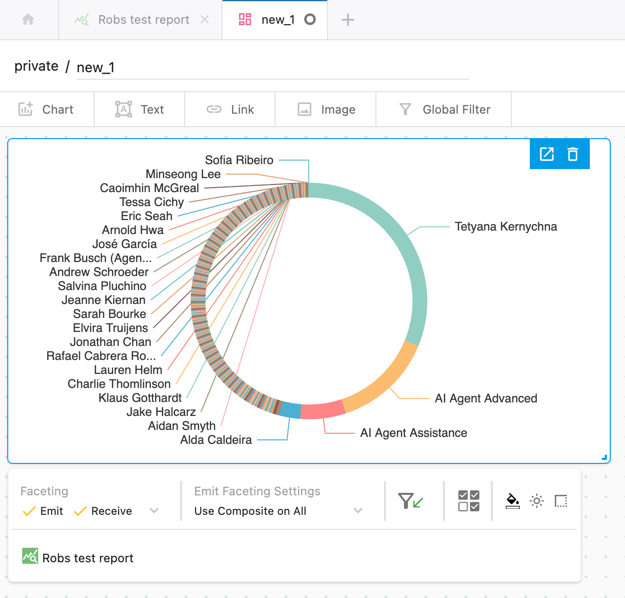
- Use the undo and redo buttons if you make a mistake.Important: You can only undo up to the last save point.
Removing reports from a dashboard
Use the following procedure if you no longer need a report on your dashboard.
To remove a report from a dashboard
- On the dashboard, click the report you want to delete from the dashboard.
- Click the delete icon (
 ).
).The report is removed from the dashboard.
Using dashboard tabs
When you create dashboards containing a lot of information, it can be beneficial to arrange this information into pages, or tabs.
A new dashboard contains a single tab named Tab 1. You can add, reorder, and manage tabs to get the dashboard layout you need.
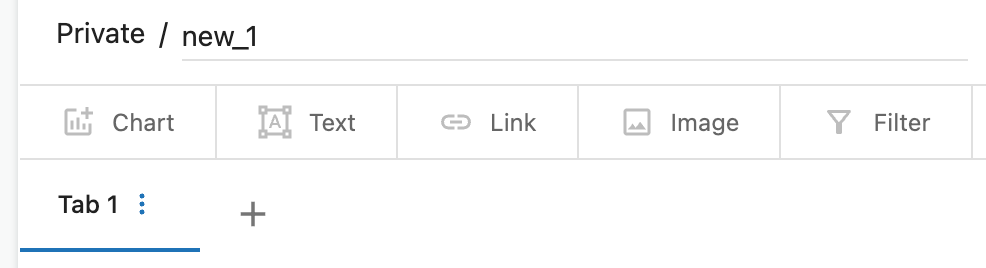
To create a new dashboard tab
-
Open a dashboard then, on the
dashboard tab bar, click the add icon (+).
A new dashboard tab is created.
To manage dashboard tabs
- Click the options menu (
 ) next to a tab.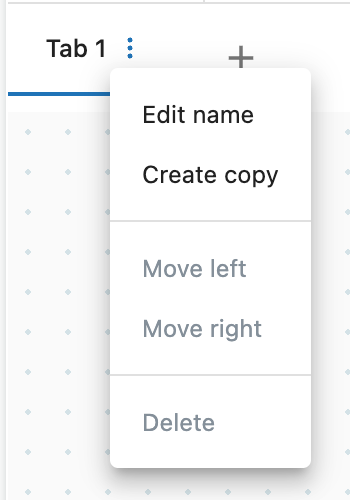
- From the menu, select one of the following options:
- Edit name: Enter a new name for the dashboard. You can also double-click the tab name to change it.
- Create copy: Creates a copy of the tab name.
- Move left: Moves the selected tab one place to the left. You can also drag-and-drop tabs to reorder them.
- Move right: Moves the selected tab one place to the right.
- Delete: Deletes the selected tab.
Saving dashboards
Once you’ve created a dashboard, you can save it so you can continue to work on it later.
To save a dashboard
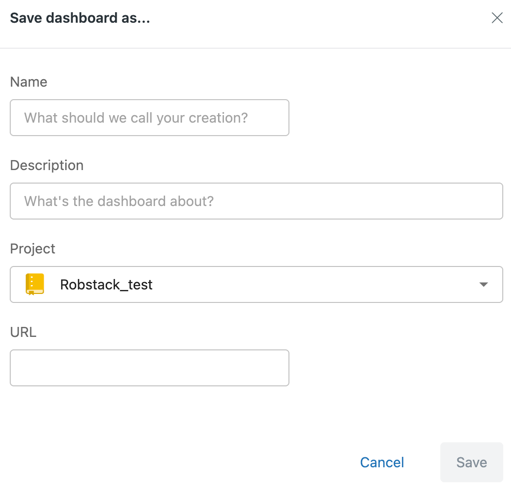
- In a dashboard, click Save or Save as.
- Enter the following information:
- Name: Enter a descriptive name for the dashboard.
- Description: Optionally, enter a description for the dashboard to make it easier for viewers to understand what it contains.
- Project: From the drop-down, select the project where the dashboard will be saved.
- URL: Optionally, edit the URL, which was automatically created based on the dashboard name. The URL of the dashboard lets viewers jump directly to it instead of having to navigate to find it.
Closing dashboards
When you’ve finished working with a dashboard, you can close it. When you close a dashboard, any unsaved changes are lost.
To close a dashboard
- In the analyst copilot tab bar, find the tab with the dashboard you want to close, then click X next to the dashboard name.
The dashboard closes.
Sharing dashboards
You can download a shareable image of a dashboard, or provide a URL to it.
To share a dashboard
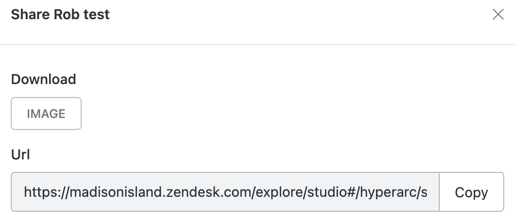
- With your dashboard in view mode, click Share.

- On the Share page, do one of the following:
- Click Image to download your dashboard as a JPEG image. You'll find the image in your Downloads folder.
Editing dashboards
Once you’ve created a dashboard and added reports, there are a number of editing options you can use.
The following topics detail some of the editing options you can use:
Switching between view and edit mode
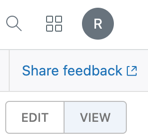
Dashboards feature two modes, view, and edit. To make changes to a dashboard, it must be in edit mode.
To switch between view and edit modes
- In a dashboard, set the toggle switch to View or
Edit.
Renaming dashboards
You can change the name of a dashboard, as needed.
To change a dashboard name
- With a dashboard open and in edit mode, click the dashboard name.
- Enter a new dashboard name.
- Click Save.
Adding images to dashboards
You can add images to your dashboard to give it your company branding or to make the dashboard more visually engaging.
To add an image to a dashboard
- Open a dashboard, then drag and drop the image component from the tab bar into the dashboard.
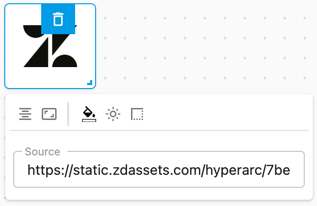
- Click the image component you just added. The following options
are displayed:
- Alignment: Justify the alignment of the image inside its dashboard component.
- Scale: Scale the image to fit the component or revert it to its original size.
- Background color: Configure a background color for the image component.
- Drop shadow: Turn on or off a drop shadow on the image.
- Border: Configure a border around the image.
- Source: Enter a location where analyst copilot can find the image.
- After you've configured the setting you want, click away from the image settings.
Adding text to dashboards
You can add text to your dashboard to provide further information to viewers.
To add text to a dashboard
- Open a dashboard.
- Drag and drop the text component from the tab bar into the dashboard.
- In the text box, enter the text you want displayed on the
dashboard.
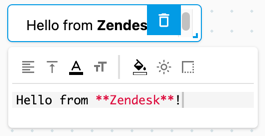
The text input box supports Markdown formatting. For example, you could enter "Hello from **Zendesk**" to display "Hello from Zendesk". dir="ltr">
- Configure the following text component options as required:
- Horizontal alignment: Controls the horizontal alignment of the text inside the text component.
- Vertical alignment: Controls the horizontal alignment of the text inside the text component.
- Font color: Controls the font color of the text.
- Font size: Controls the font size of the text.
- Component background color: Controls the background color of the text.
- Drop shadow: Adds or removes a drop shadow effect on the text component.
- Border configuration: Creates a border around the text using the selected style.
- Click away from the text component to hide the text options menu.
Adding links to dashboards
You can add clickable links to external sites, or to other analyst copilot assets.
To add a link to the dashboard
- Open a dashboard
- Drag and drop the link component from the tab bar into the dashboard.
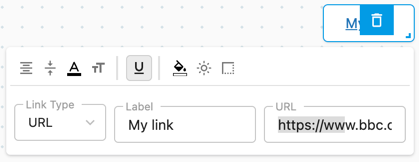
- In the link component choose the link type you want to add. You can add a link to another analyst copilot asset (for example another dashboard or report) or link to an external web site using a URL.
- Configure the following information for the link:
For URL links
- Link type: Select URL.
- Label: Enter the text that will appear for the link.
-
URL: Enter the URL for the link.
For asset links
- Link type: Select Asset
- Label: Enter the text that will appear for the link.
- Asset: Opens a list where you can choose the report or dashboard you want to add.
-
Pass state: From the drop down, select if you want
filters from the selected asset reflected when a user clicks the
link.

- Configure the following formatting options as needed:
- Horizontal alignment: Controls the horizontal alignment of the text inside the text component.
- Vertical alignment: Controls the horizontal alignment of the text inside the text component.
- Font color: Controls the font color of the text.
- Font size: Controls the font size of the text.
- Underline: Underlines the current link.
- Component background color: Controls the background color of the text.
- Drop shadow: Adds or removes a drop shadow effect on the text component.
- Border configuration: Creates a border around the text using the selected style
Click away from the link component to hide the link options menu. Now, when the dashboard is in view mode, clicking the link text will take you to the configured asset or URL.
Configuring advanced dashboard options
You can fine-tune your dashboard configuration and presentation as needed.
To configure advanced dashboard options
- Open a dashboard and switch to Edit mode.
- Click the options menu (
 ) , then select one of the following
options:
) , then select one of the following
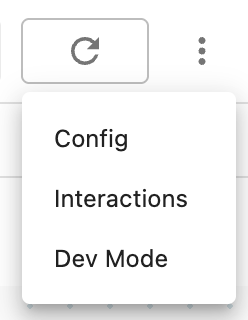
options:- Config: Opens a panel containing layout and component options for your dashboard. For example, you can change component spacing, display colors, and border styles.
- Interactions: Connects columns across different datasets so that filters affect the entire dashboard, regardless of the dataset each report comes from. By default, dashboard filters apply to reports in the same dataset only. See Grouping and filtering analyst copilot results.
- Dev mode: Displays the dashboard configuration in JSON format. You can modify the configuration as needed, then click Apply to save it.