Summary: ◀▼
Use the Support: Tickets dashboard to track solved and open tickets, monitor backlog, and review agent productivity. You get headline metrics like created, solved, unsolved, one-touch rate, reopened rate, and first reply time, plus reports by date, hour, day, group, brand, channel, and ticket status to spot trends and manage unsolved tickets.
The analyst copilot Support: Tickets dashboard features a number of reports to help you track your solved and open tickets. These reports can help you monitor your ticket backlog and agent productivity.
This article contains the following topics:
Accessing the Support: Tickets dashboard
You can access the Support: Tickets dashboard from the analyst copilot home page using the following procedure:
To access the Support: Tickets dashboard
- In Analytics, click the Home (
 ) icon
in the sidebar.
) icon
in the sidebar. - On the analyst copilot home page, search for, then click Support:
Tickets.
The dashboard opens on the Tickets tab.
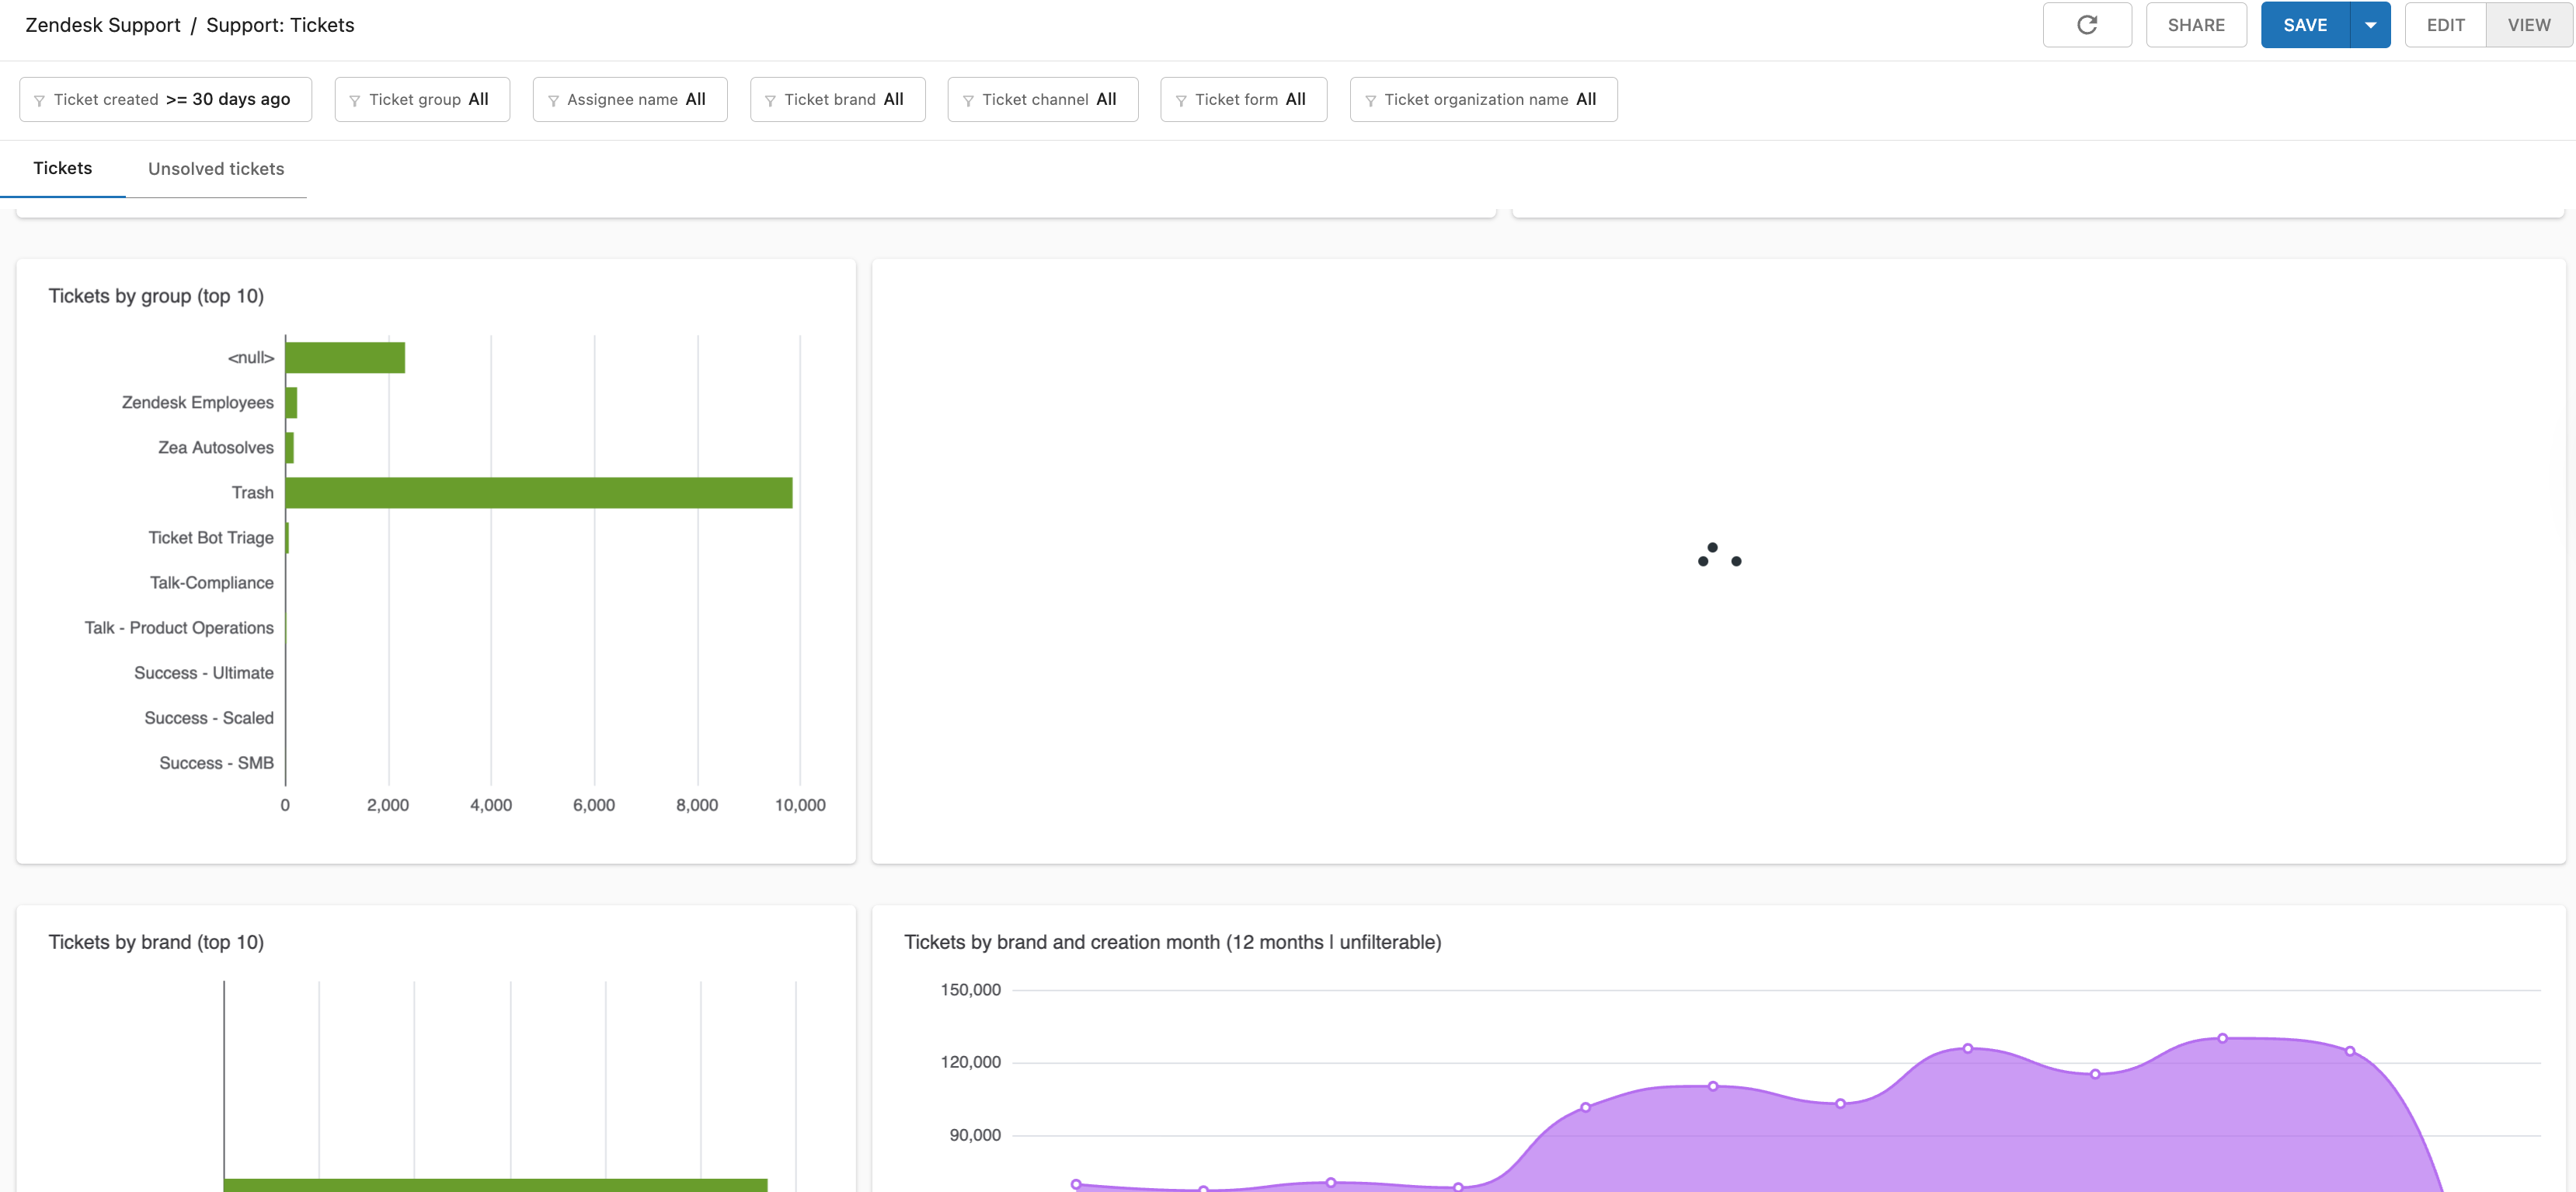
Understanding the Support: Tickets dashboard reports
The Tickets tab contains reports about tickets created in your Zendesk account.
Tickets tab headline metrics
The tickets tab contains the following headline metrics based on the filters you configured:
- Created tickets: The number of tickets created.
- Solved tickets: The number of solved tickets. These are tickets that have a Solved or Closed status.
- Unsolved tickets: The number of unsolved tickets. These are tickets that do not have a Closed or Solved status.
- One-touch rate: The percentage of tickets that were solved with one agent reply.
- Reopened rate: The percentage of reopened tickets that were previously marked as Solved.
- First reply time median: The median time from when the ticket was first created until an agent first replied.

Tickets tab reports
The Tickets tab contains the following reports:
-
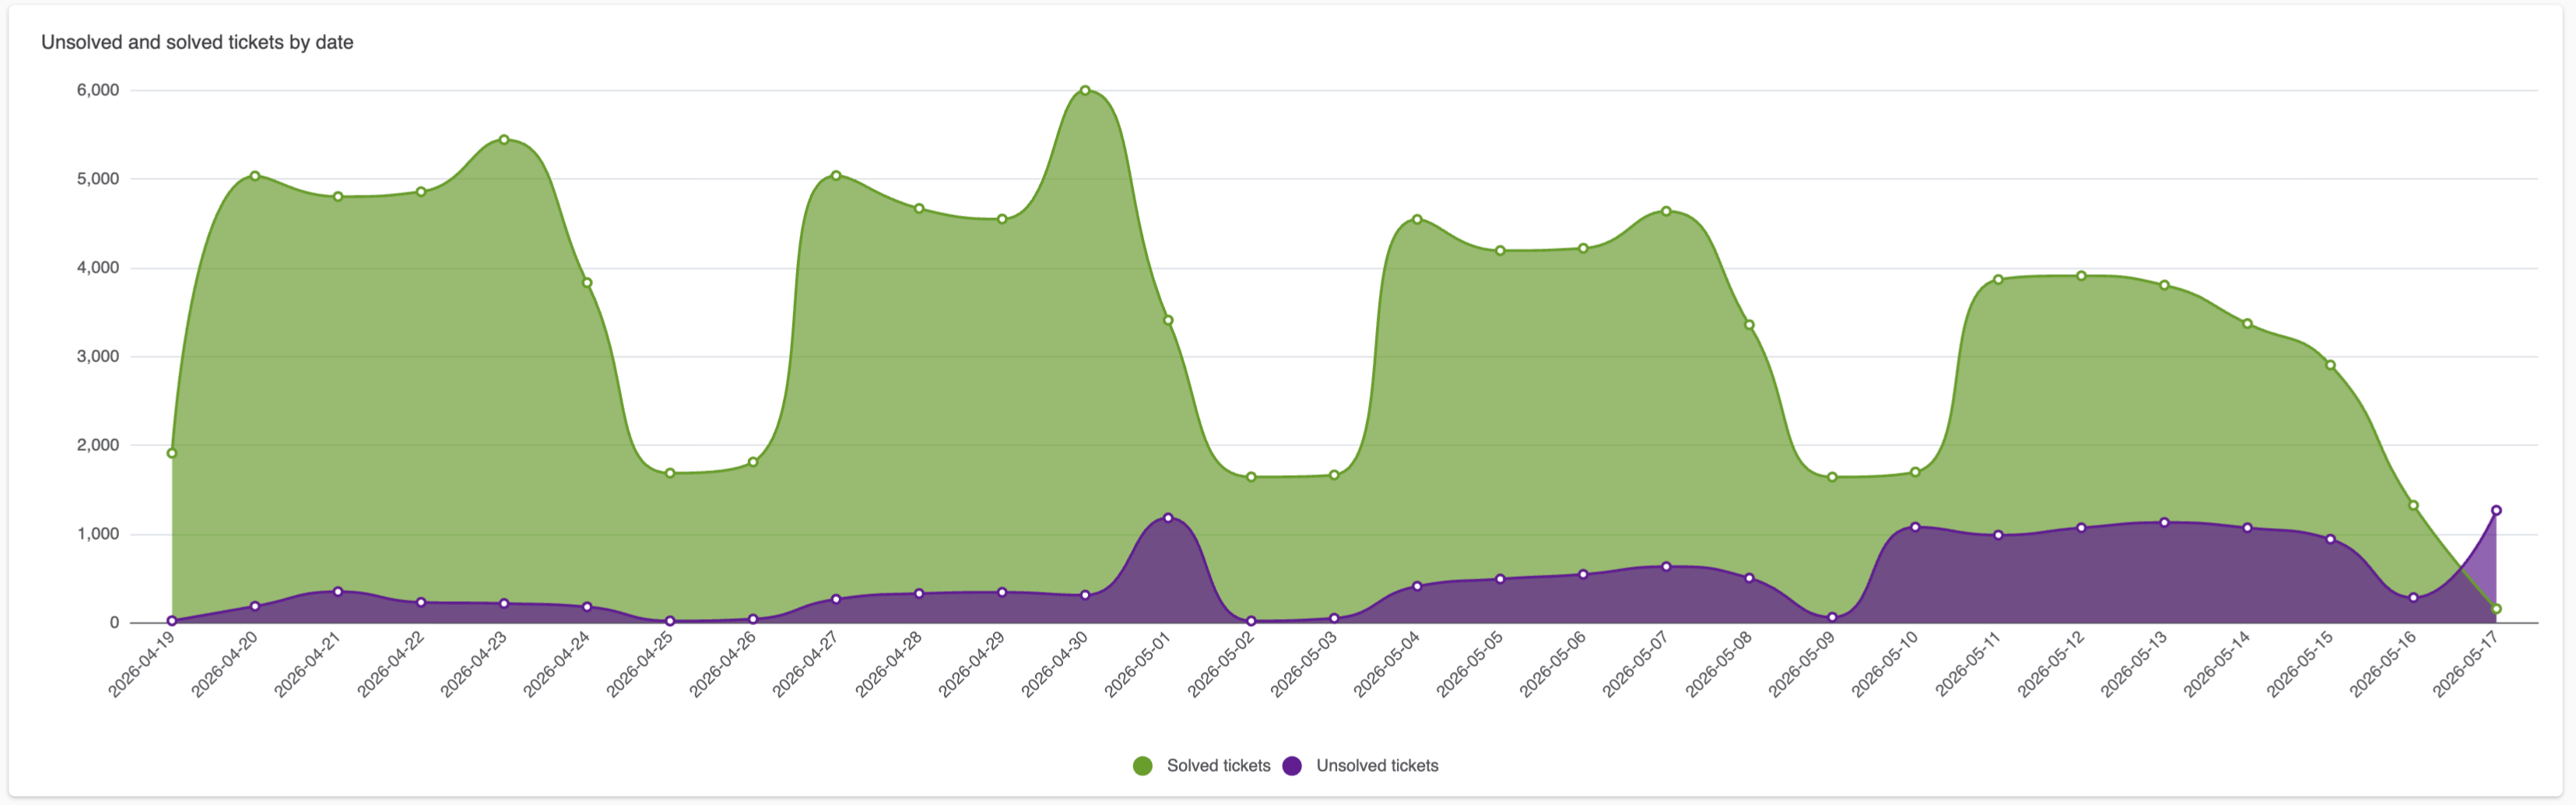
Unsolved and solved tickets by date: An area chart displaying solved
and unsolved tickets over time.
-
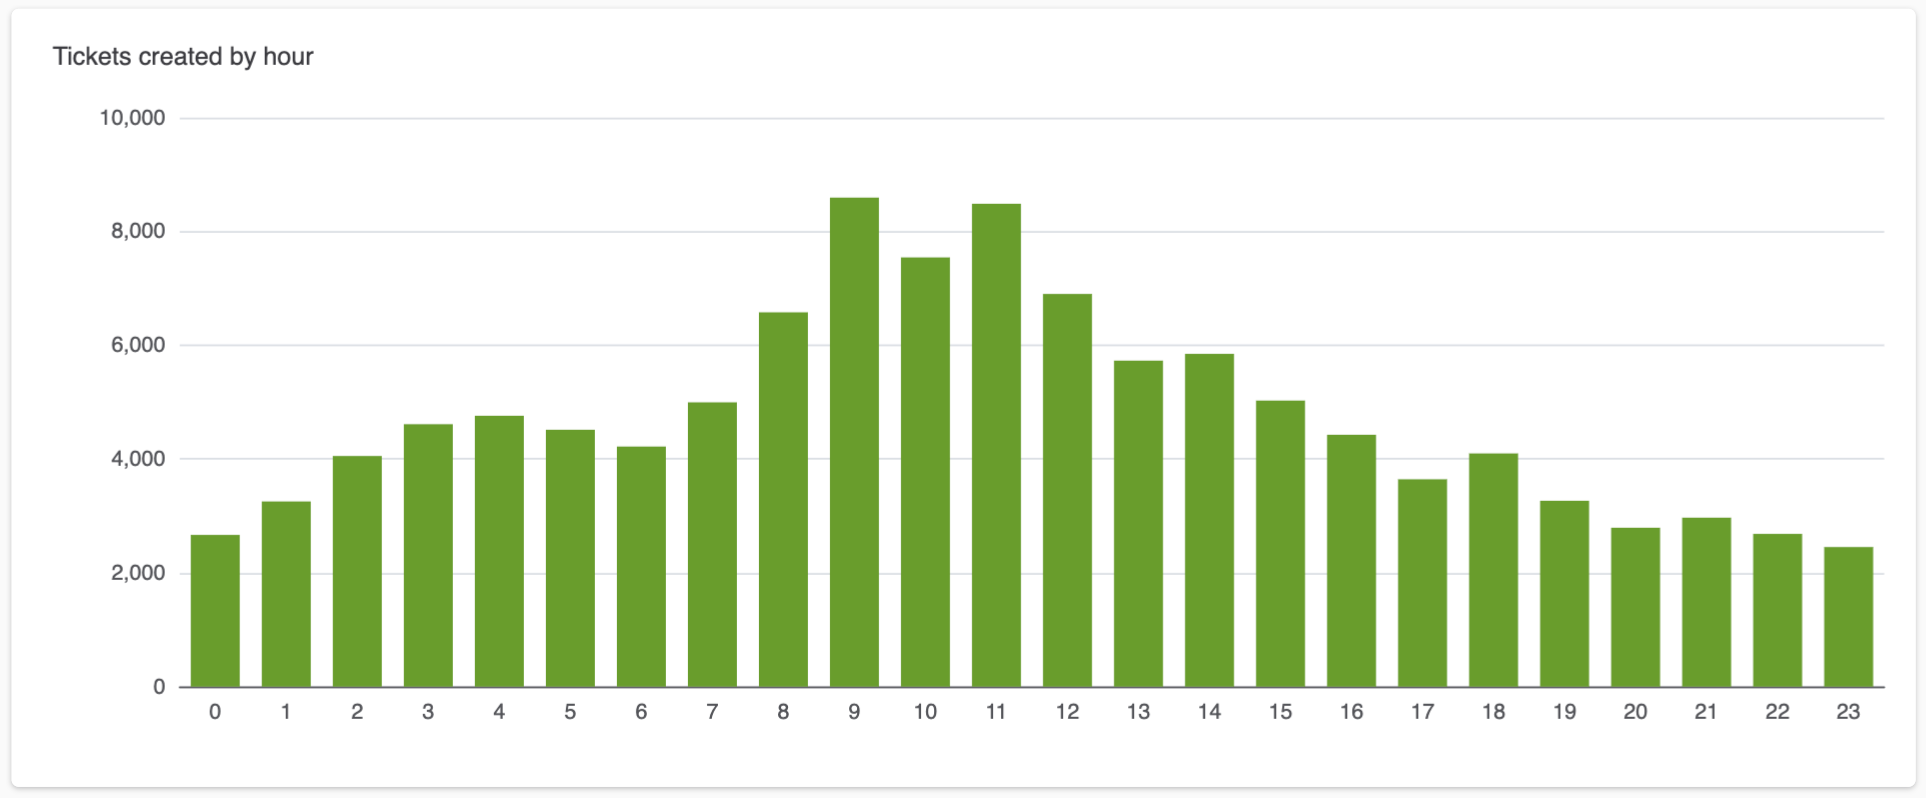
Tickets created by hour: A column chart displaying the percentage of
tickets created each hour (0-23).
-
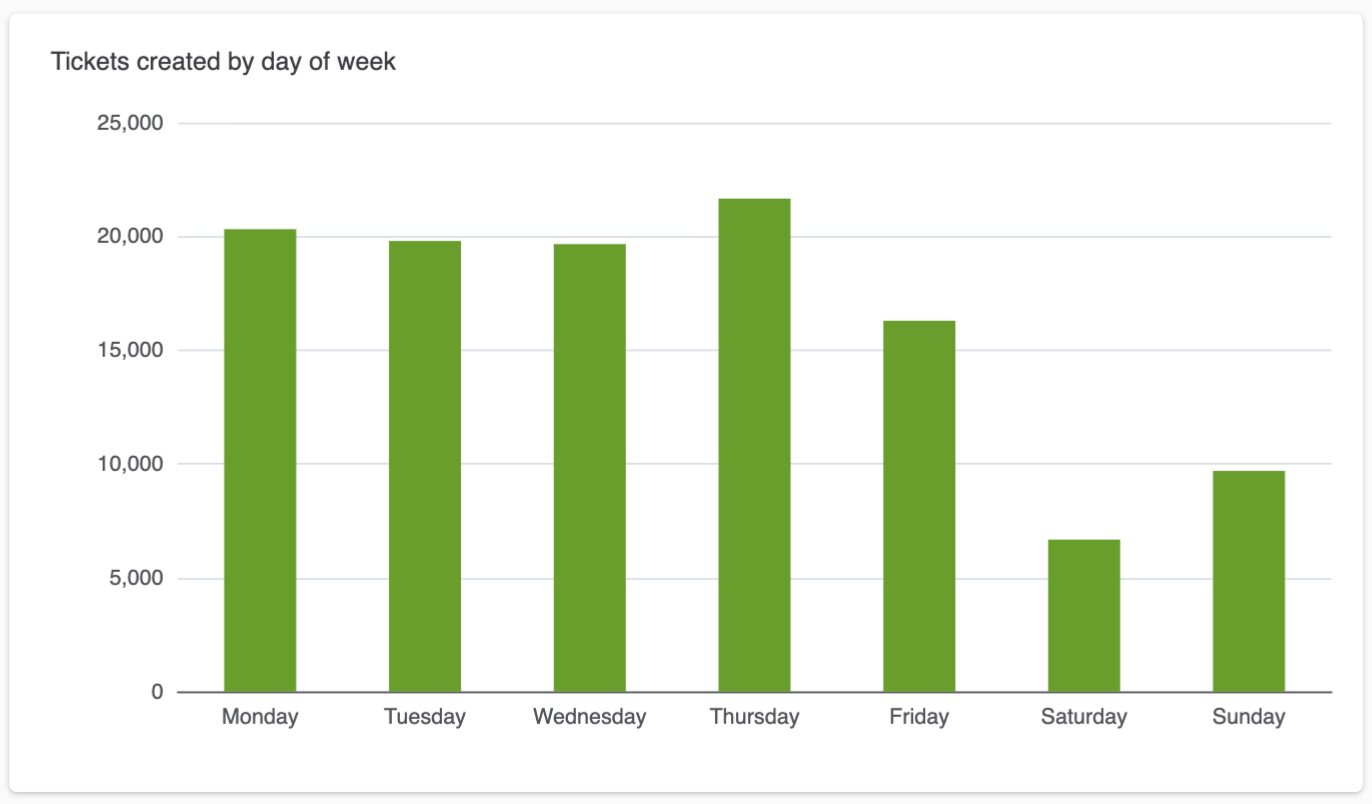
Tickets created by day of week: A column chart displaying the number
of tickets created each day of the week.
-
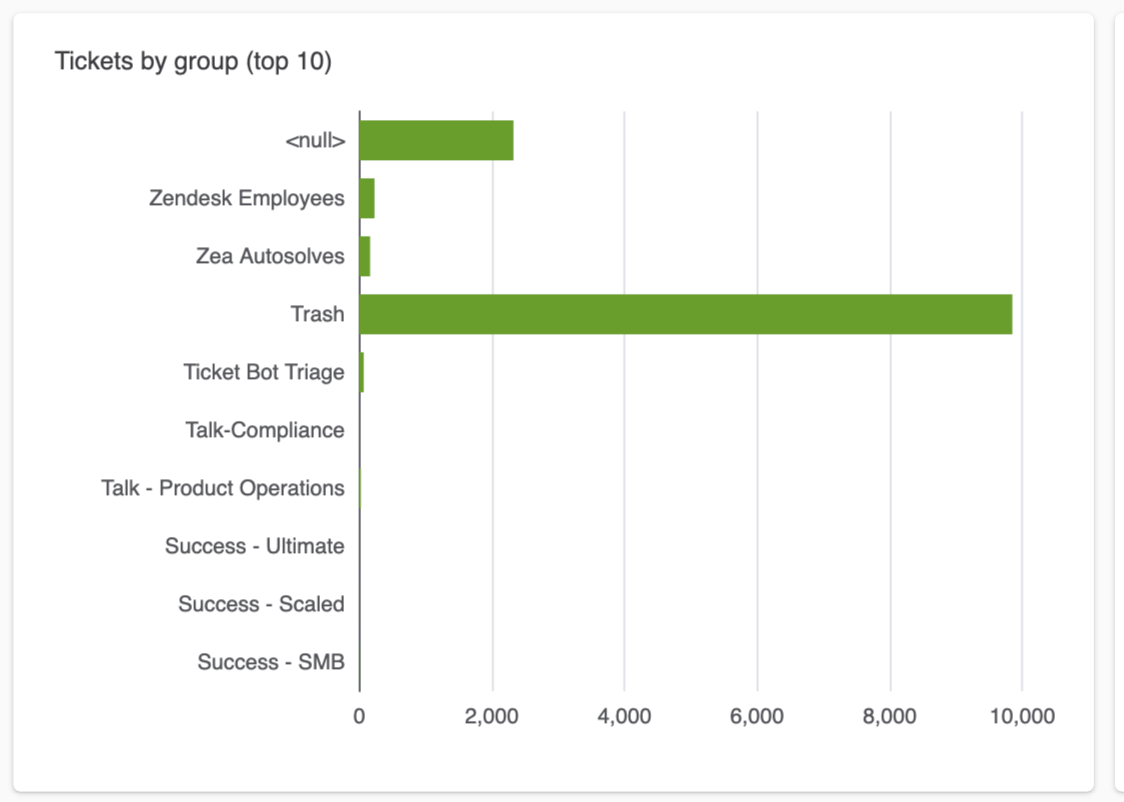
Tickets by group (top 10): A bar chart displaying the top 10 groups
with the most tickets.
-
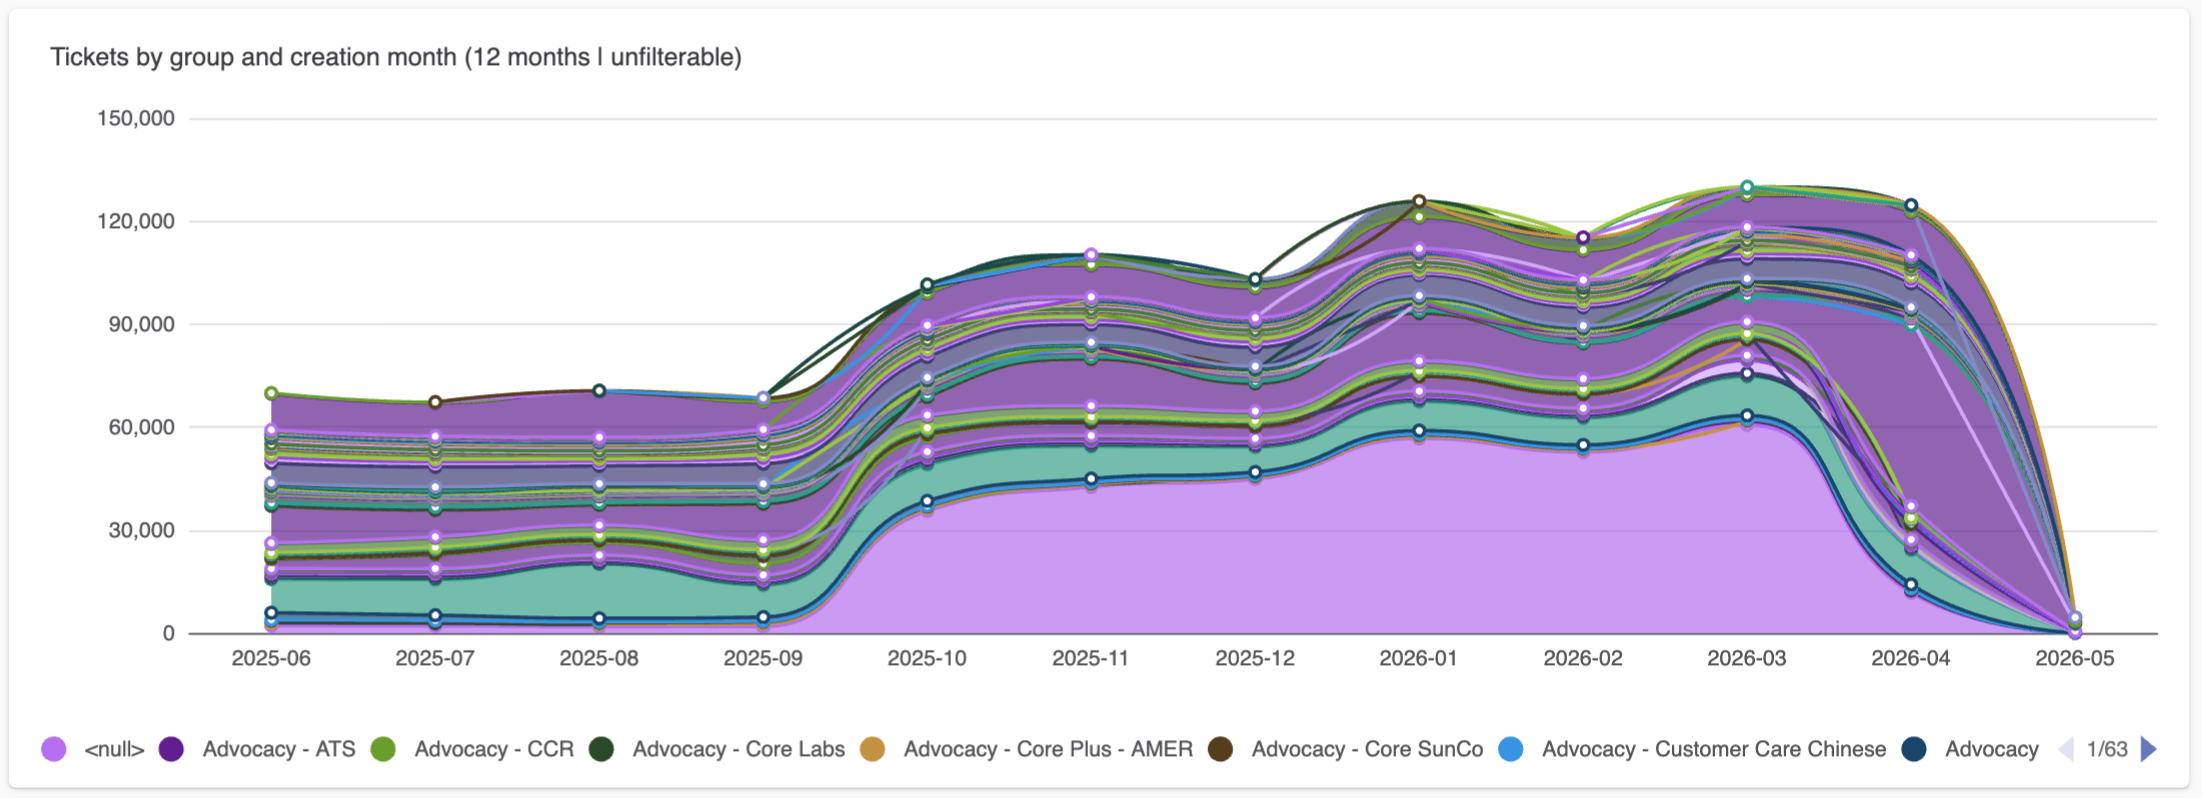
Tickets by group and creation month (12 months unfilterable): A
stacked area chart displaying tickets created in each group over the last 12
months.
-
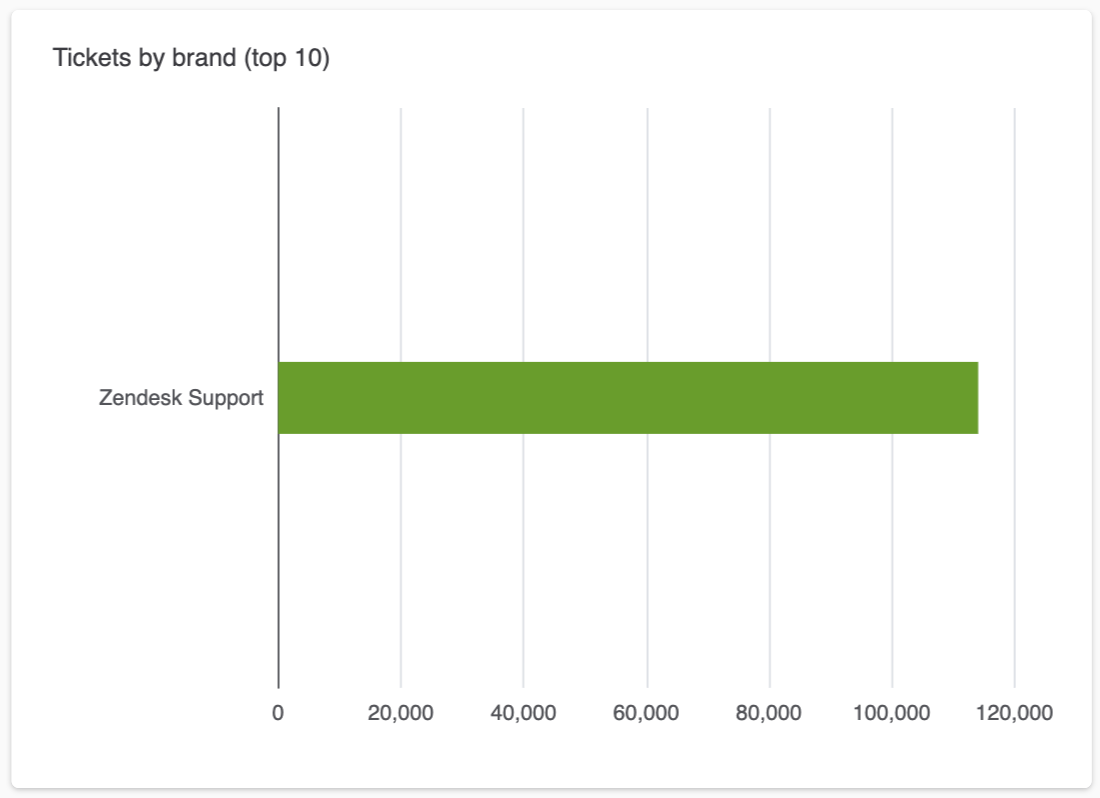
Tickets by brand (top 10): A bar chart displaying your top 10 brands
by number of tickets.
-
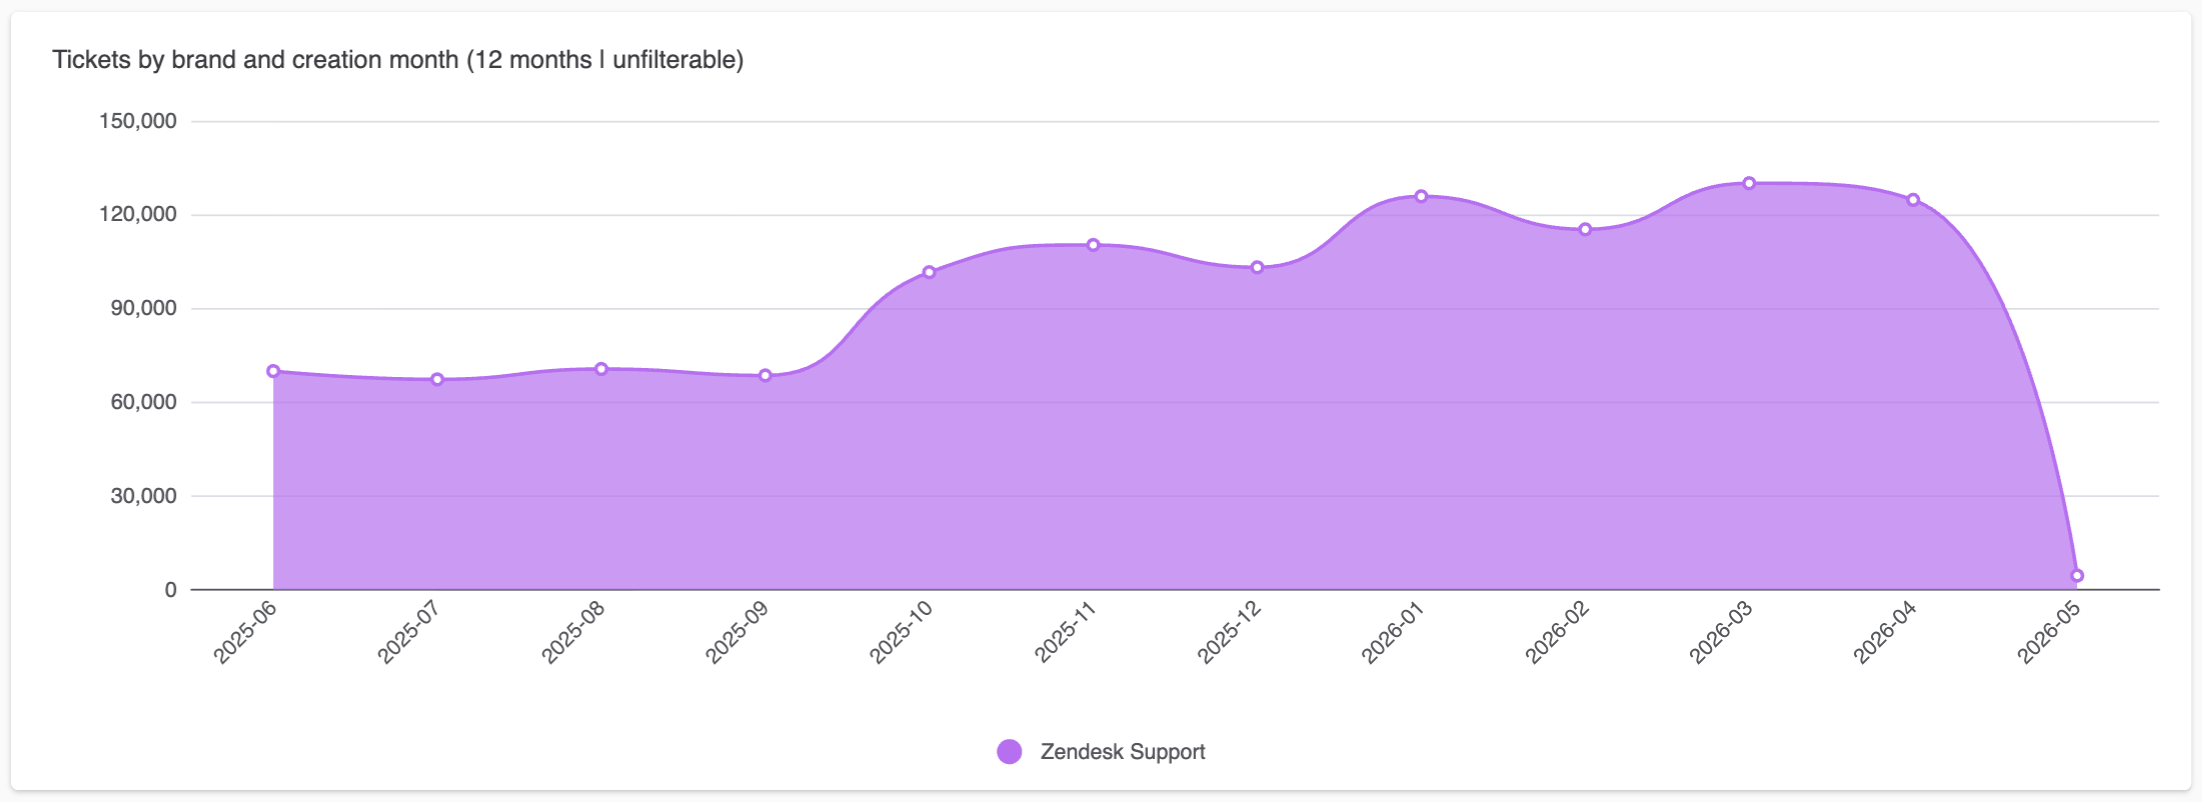
Tickets by brand and creation month (12 months unfilterable): An area
chart displaying tickets created in each brand over the last 12
months.
-
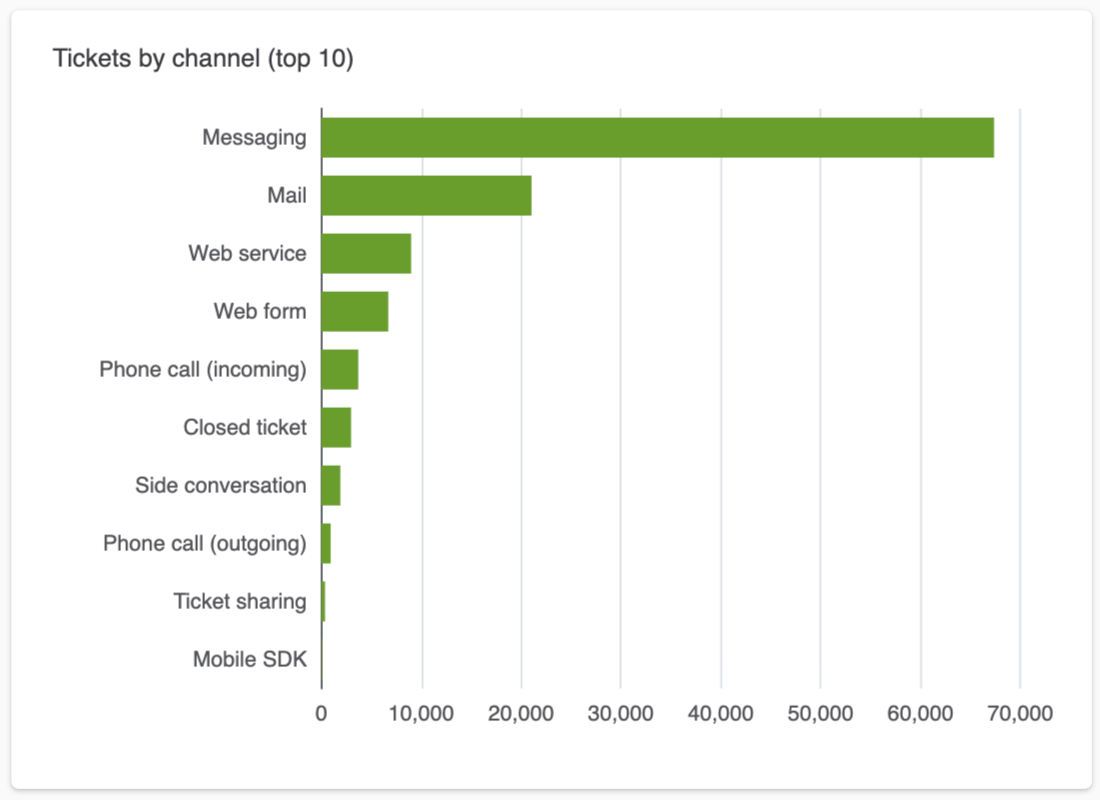
Tickets by channel (top 10): A bar chart displaying your top 10
channels by number of tickets.
-
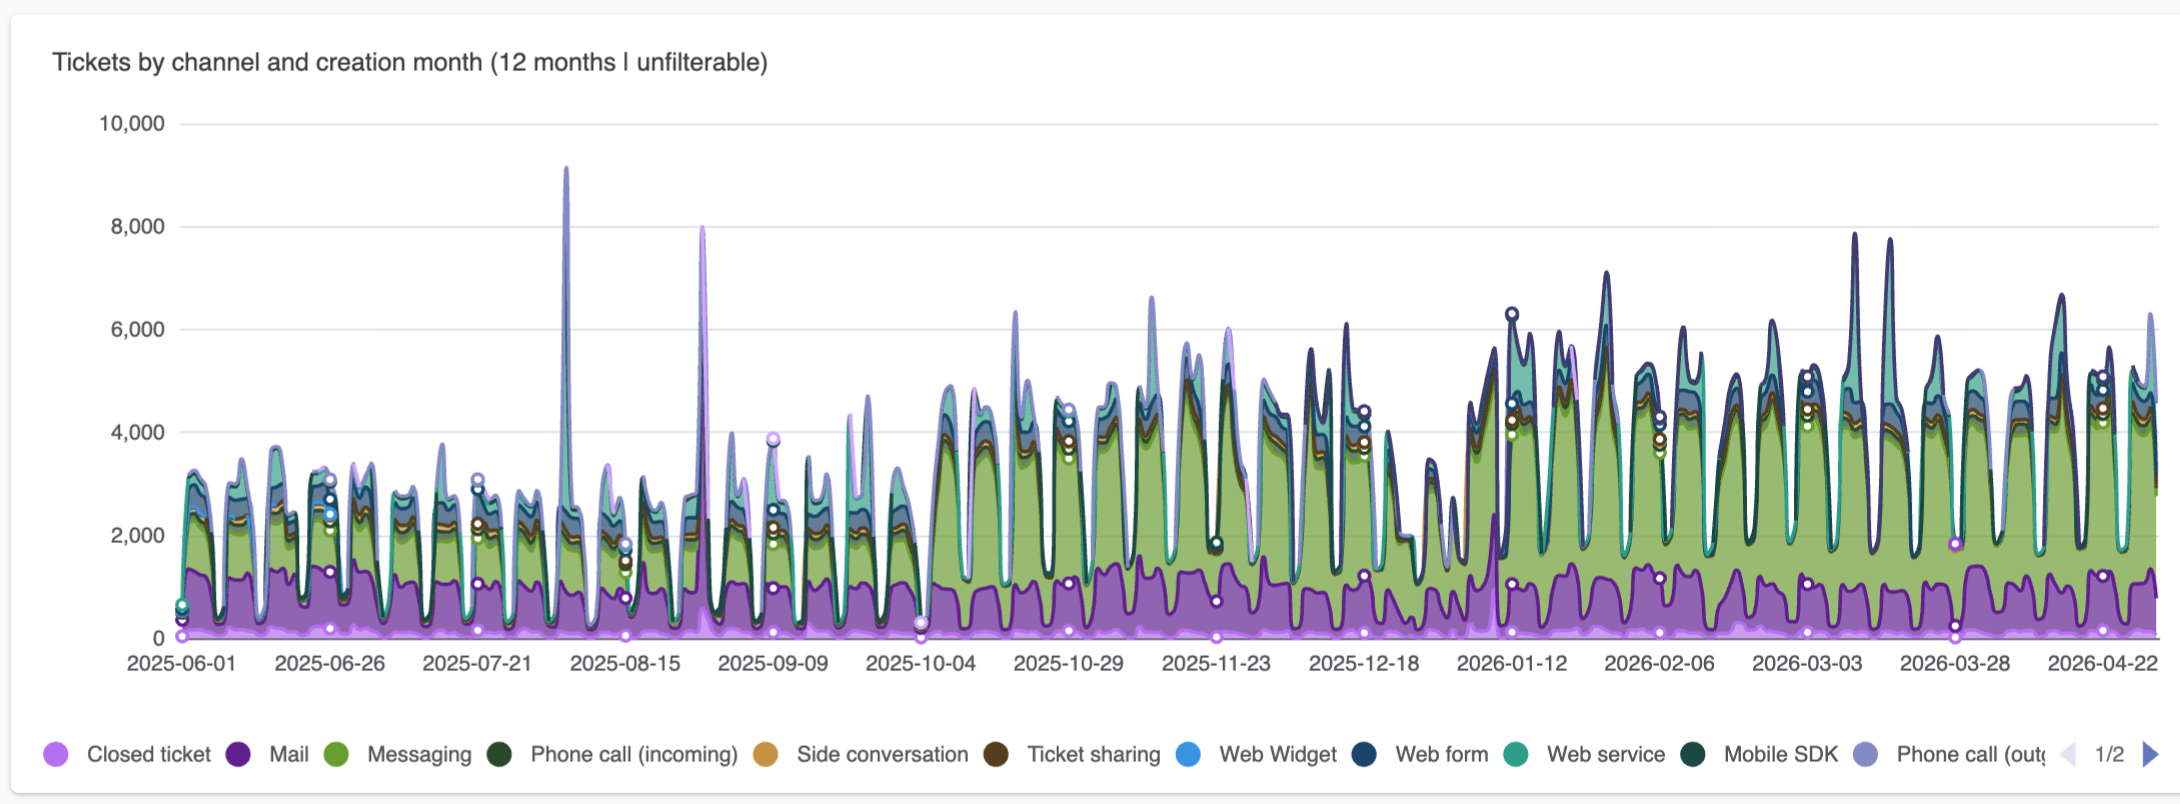
Tickets by channel and creation month (12 months unfilterable): A
stacked area chart displaying tickets created in each channel over the last
12 months.
-
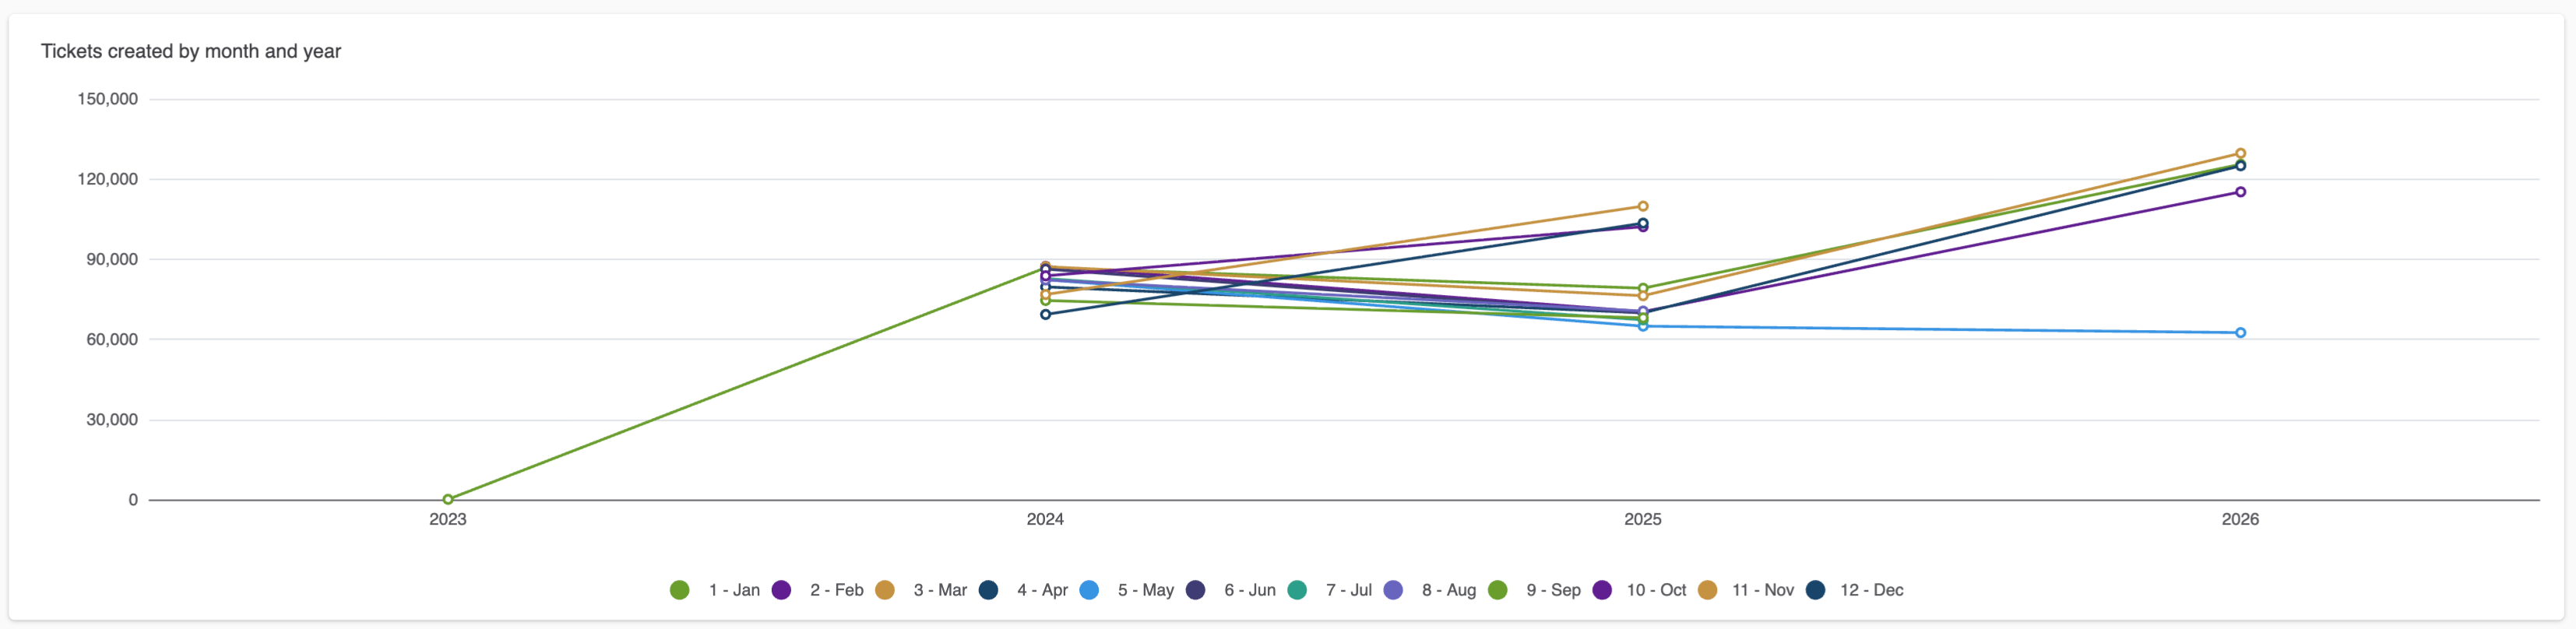
Tickets created by month and year: A line chart displaying the number
of tickets created by month and year.
Unsolved tickets tab headline metrics
The unsolved tickets tab contains the following headline metrics:
- Unsolved tickets: Tickets that are not in a Solved or Closed status.
- New and open tickets: Tickets that are in a New or Open status.
- Unreplied unsolved tickets: Unsolved tickets with no agent replies.
- Unassigned unsolved tickets: Unsolved tickets that are not assigned.
- Time since update median: The median time since unsolved tickets were last updated.
- Unsolved tickets age median: The median time in days since unsolved tickets were created.

Unsolved tickets tab reports
The Unsolved tickets tab contains the following reports:
-
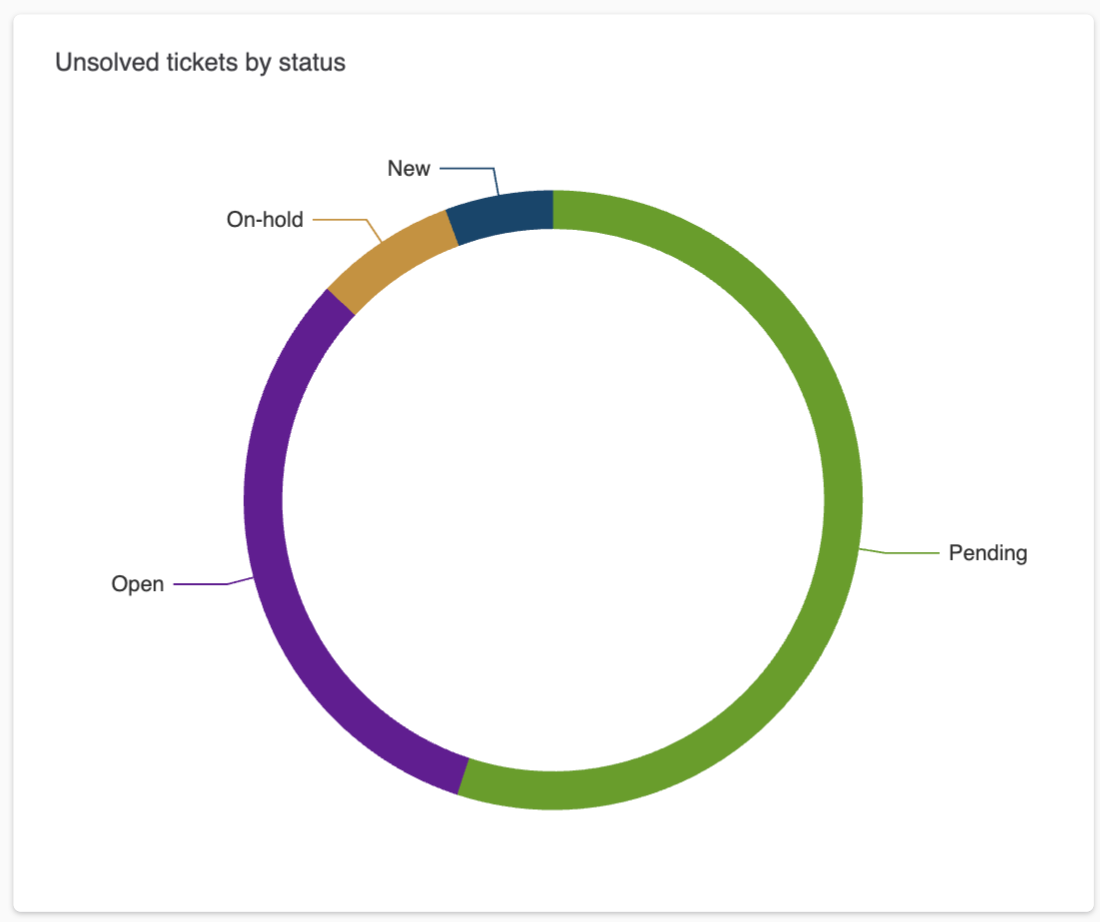
Unsolved tickets by status: A donut chart showing the percentage of
tickets that are in a New, Open, Pending, or On-hold status.
-
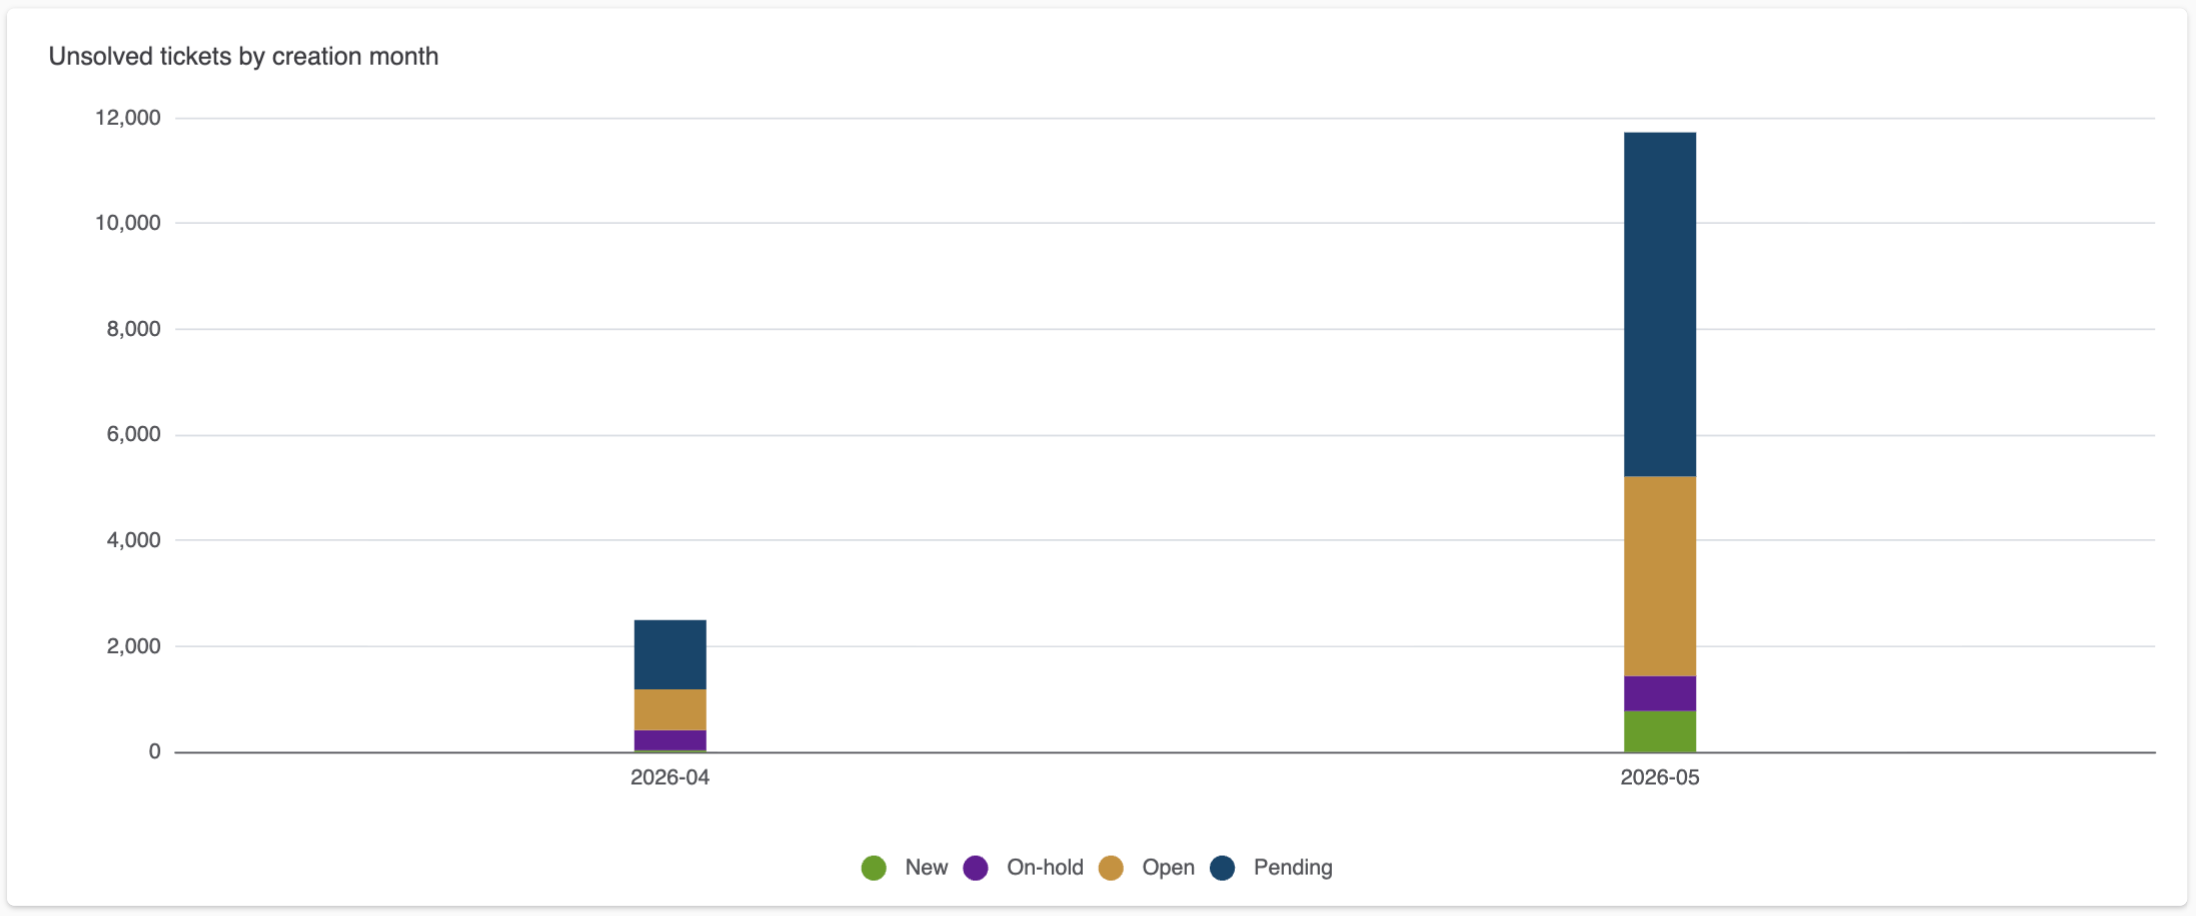
Unsolved tickets by creation month: A stacked column chart displaying
unsolved tickets and their status and by the month they were
created.
-
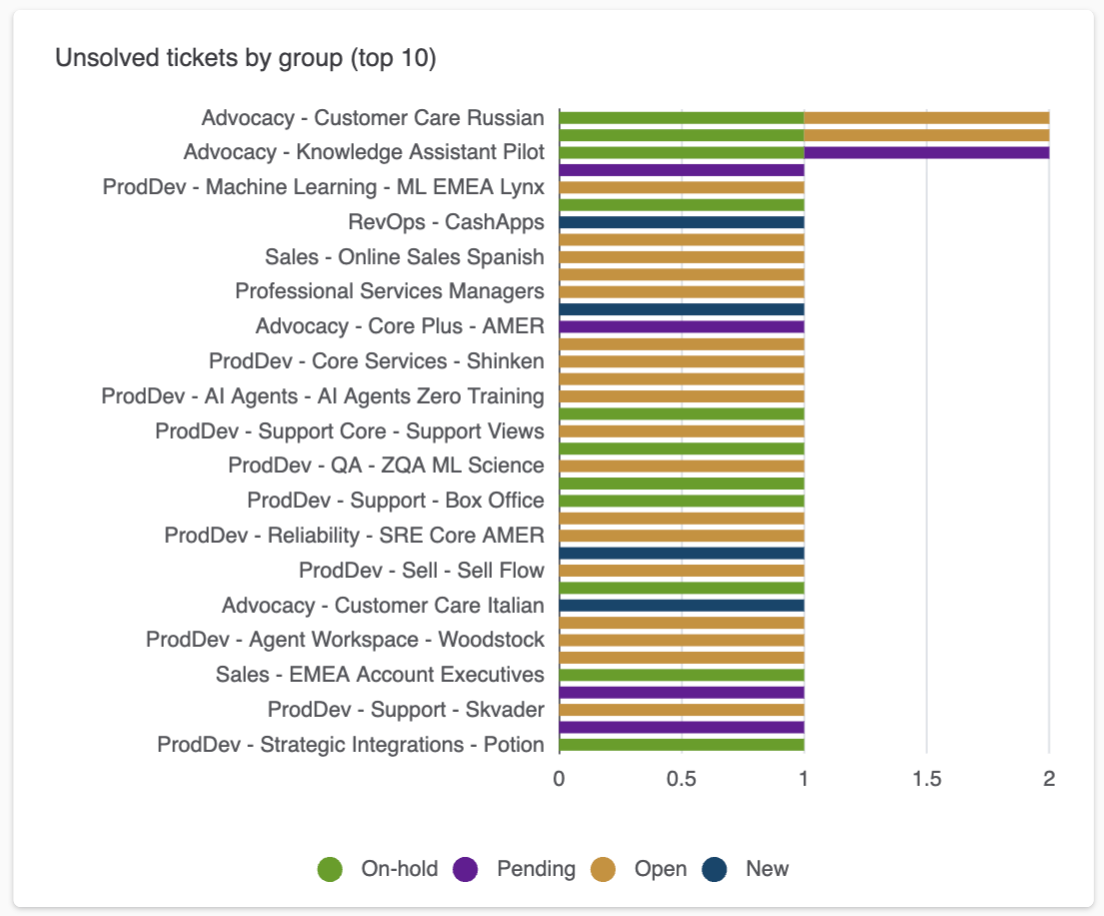
Unsolved tickets by group (top 10): A stacked bar chart displaying
the top 10 groups by unsolved tickets and their status.
-
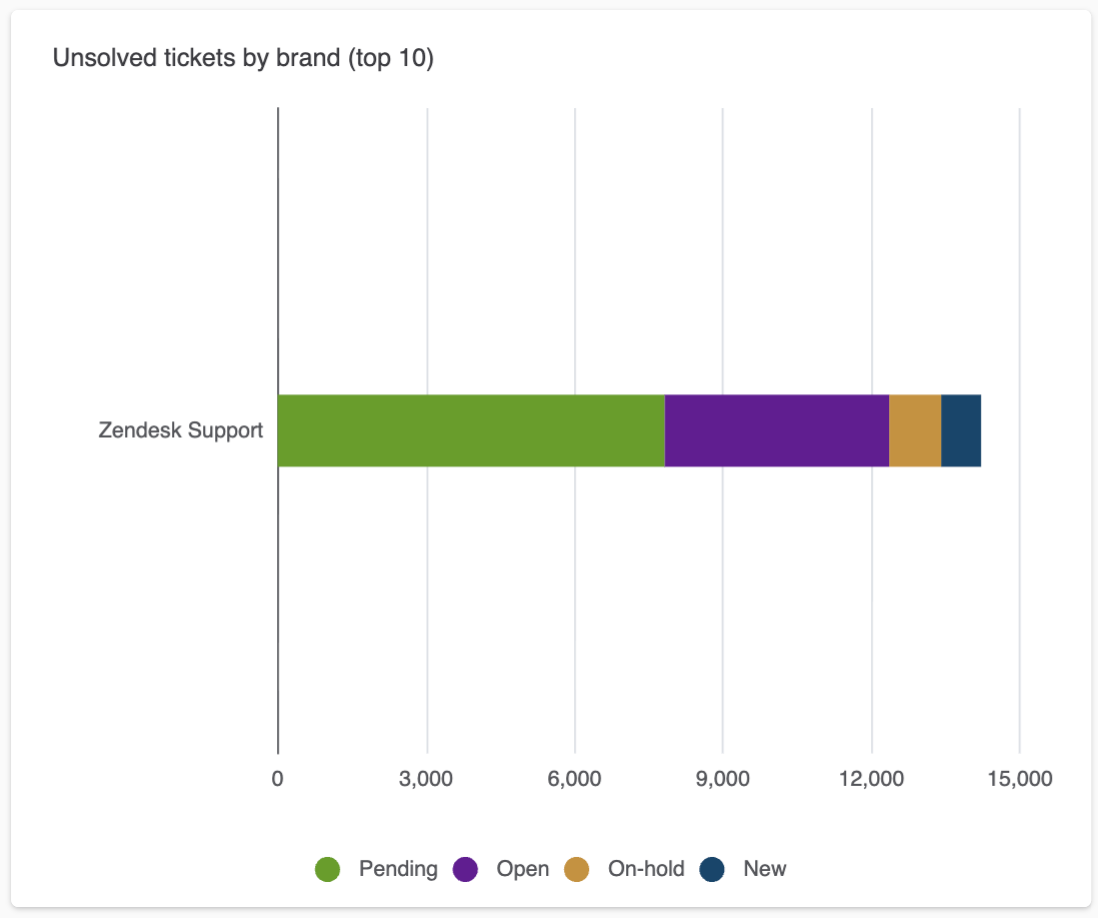
Unsolved tickets by brand (top 10): A stacked chart displaying the
percentage of tickets in the new, open, pending and on-hold statuses for
each of your brands.
-
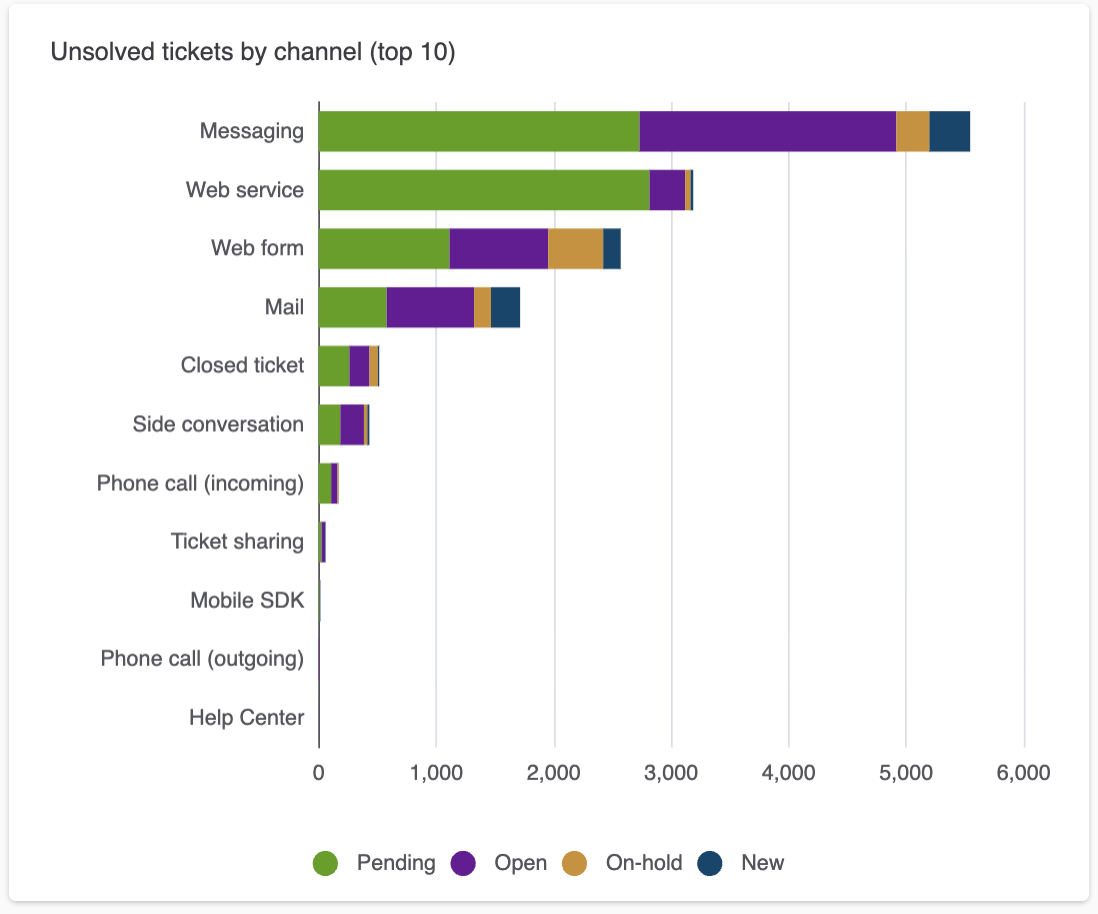
Unsolved tickets by channel (top 10): A stacked chart displaying the
percentage of tickets in the new, open, pending and on-hold statuses for
your top 10 most used ticket channels.
-
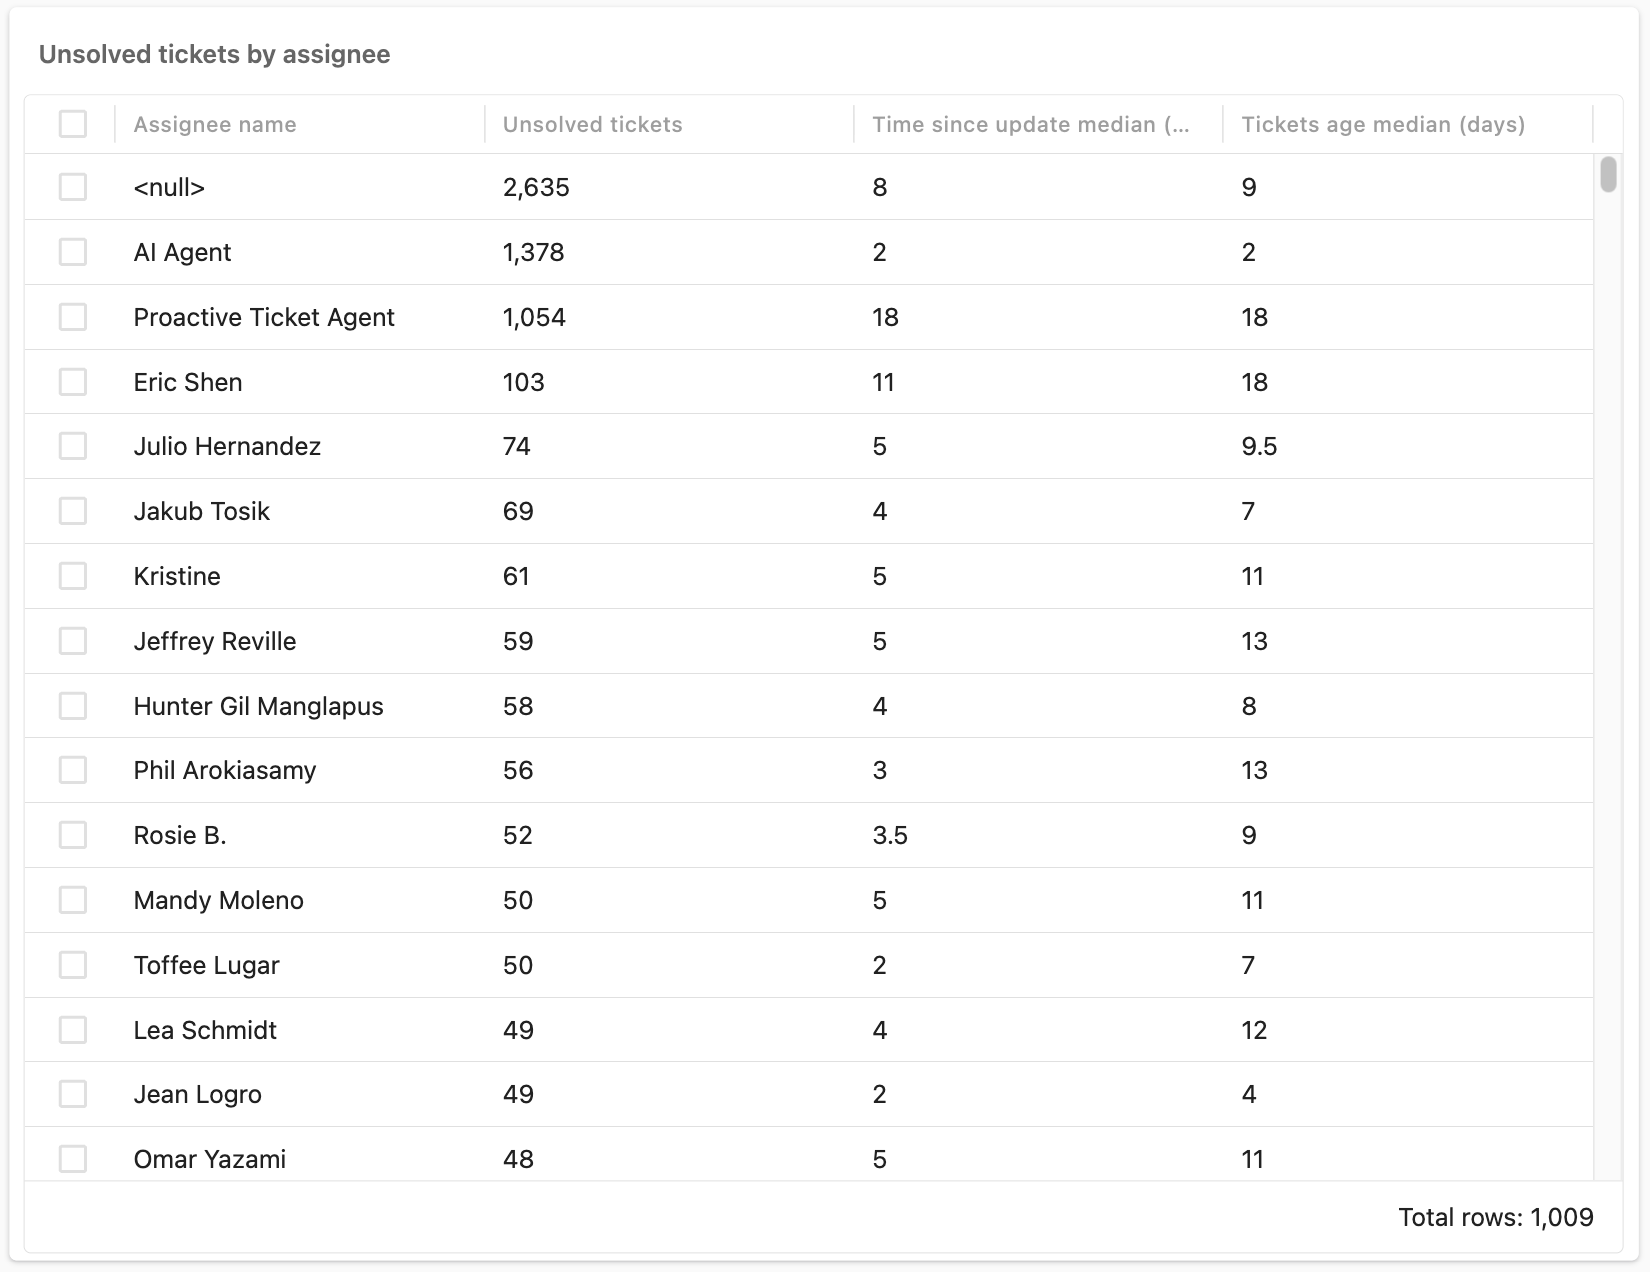
Unsolved tickets by assignee: A table showing your top assignees by
unsolved ticket count and their median ticket age and median time since
their last ticket update.
-
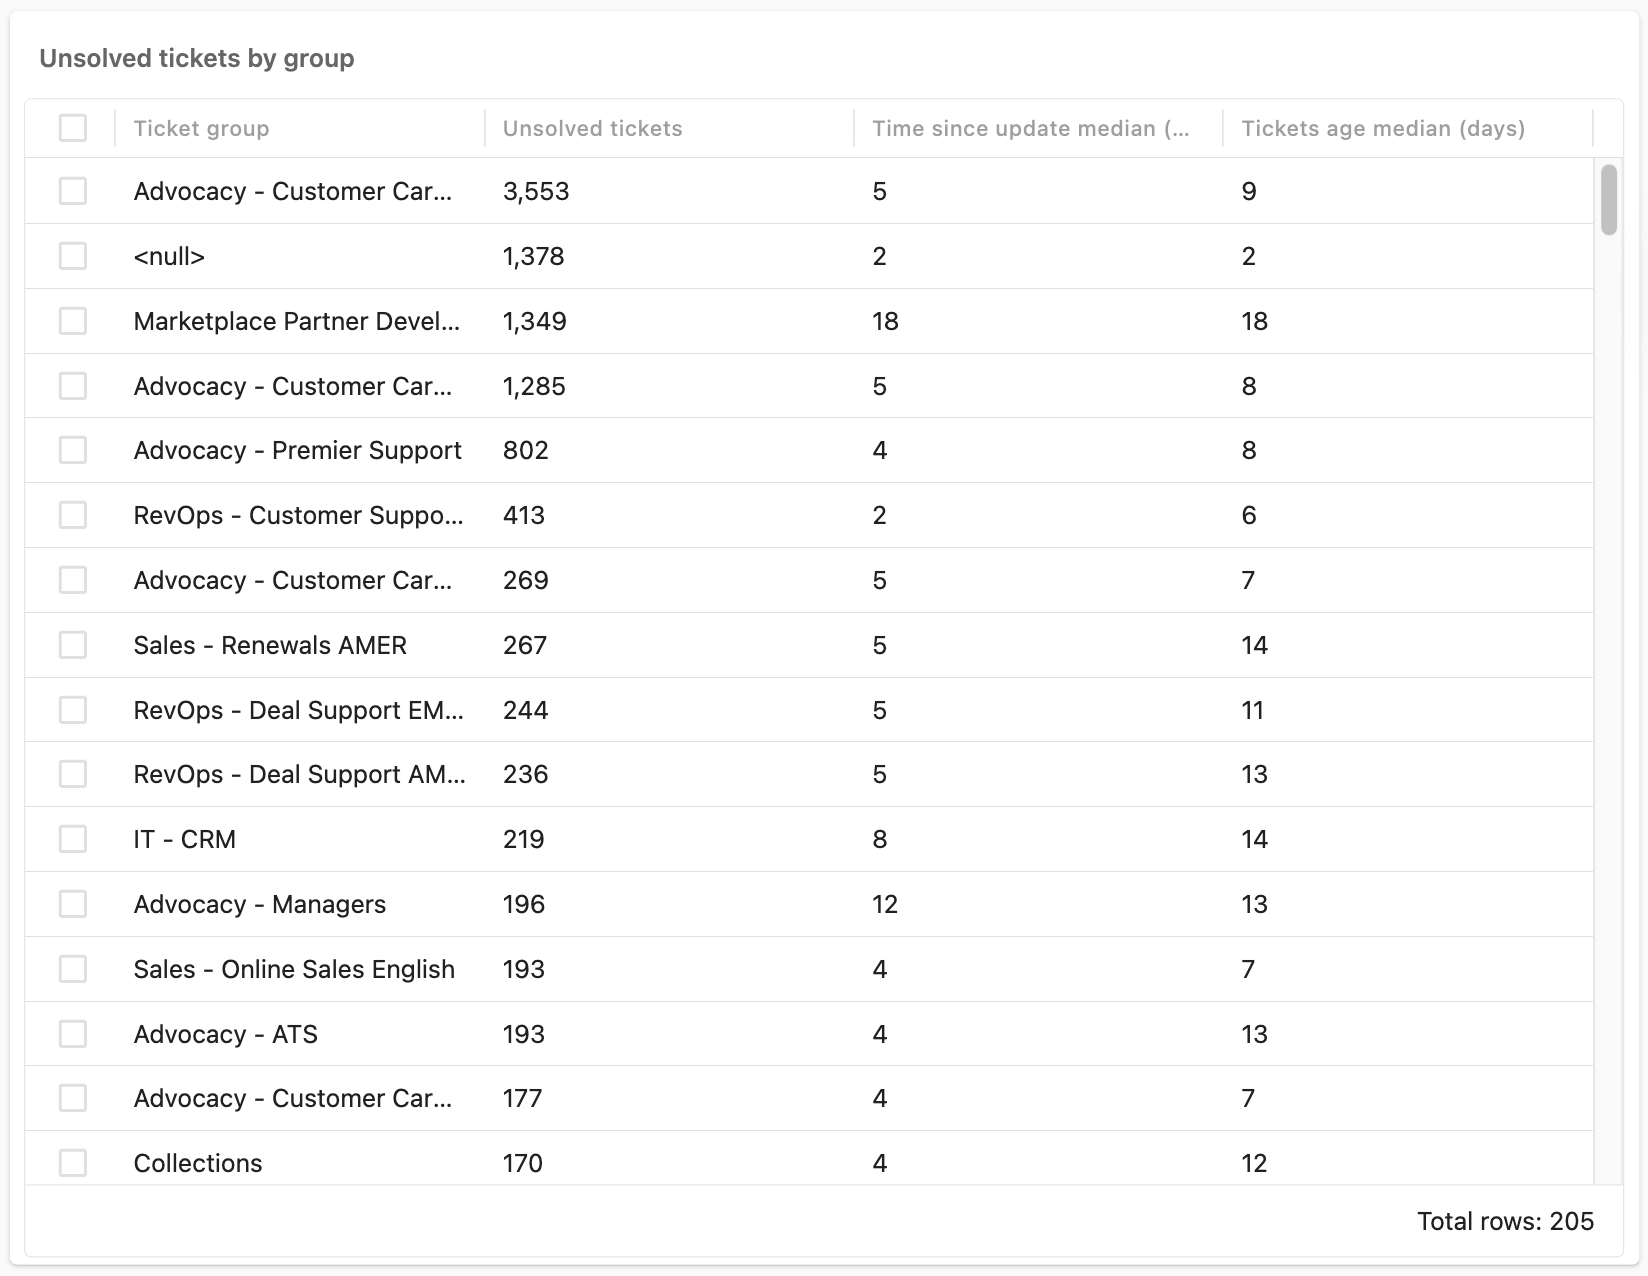
Unsolved tickets by group: A table showing your top groups by
unsolved ticket count and their median ticket age and median time since
their last ticket update.