Summary: ◀▼
Use the intelligent triage dashboard to monitor tickets enriched with topic, sentiment, language, and entities. You can review overview, intent, sentiment, and language reports, filter by channel, group, form, brand, status, and date, and track key metrics like ticket volume, first reply time, and full resolution time to spot trends and compare classified vs. not enriched tickets.
Analyst copilot features a prebuilt dashboard to help you monitor your intelligent triage activity. The intelligent triage dashboard can help you identify tickets classified by customer topic, sentiment, language, and entities.
This article contains the following topics:
Accessing the Copilot: Intelligent triage dashboard
You can access the Copilot: Intelligent triage dashboard from the analyst copilot home page using the following procedure:
To access the Copilot: Intelligent triage dashboard
- In Analytics, click the Home (
 ) icon
in the sidebar.
) icon
in the sidebar. - On the analyst copilot home page, search for, then click Copilot: Intelligent
triage.
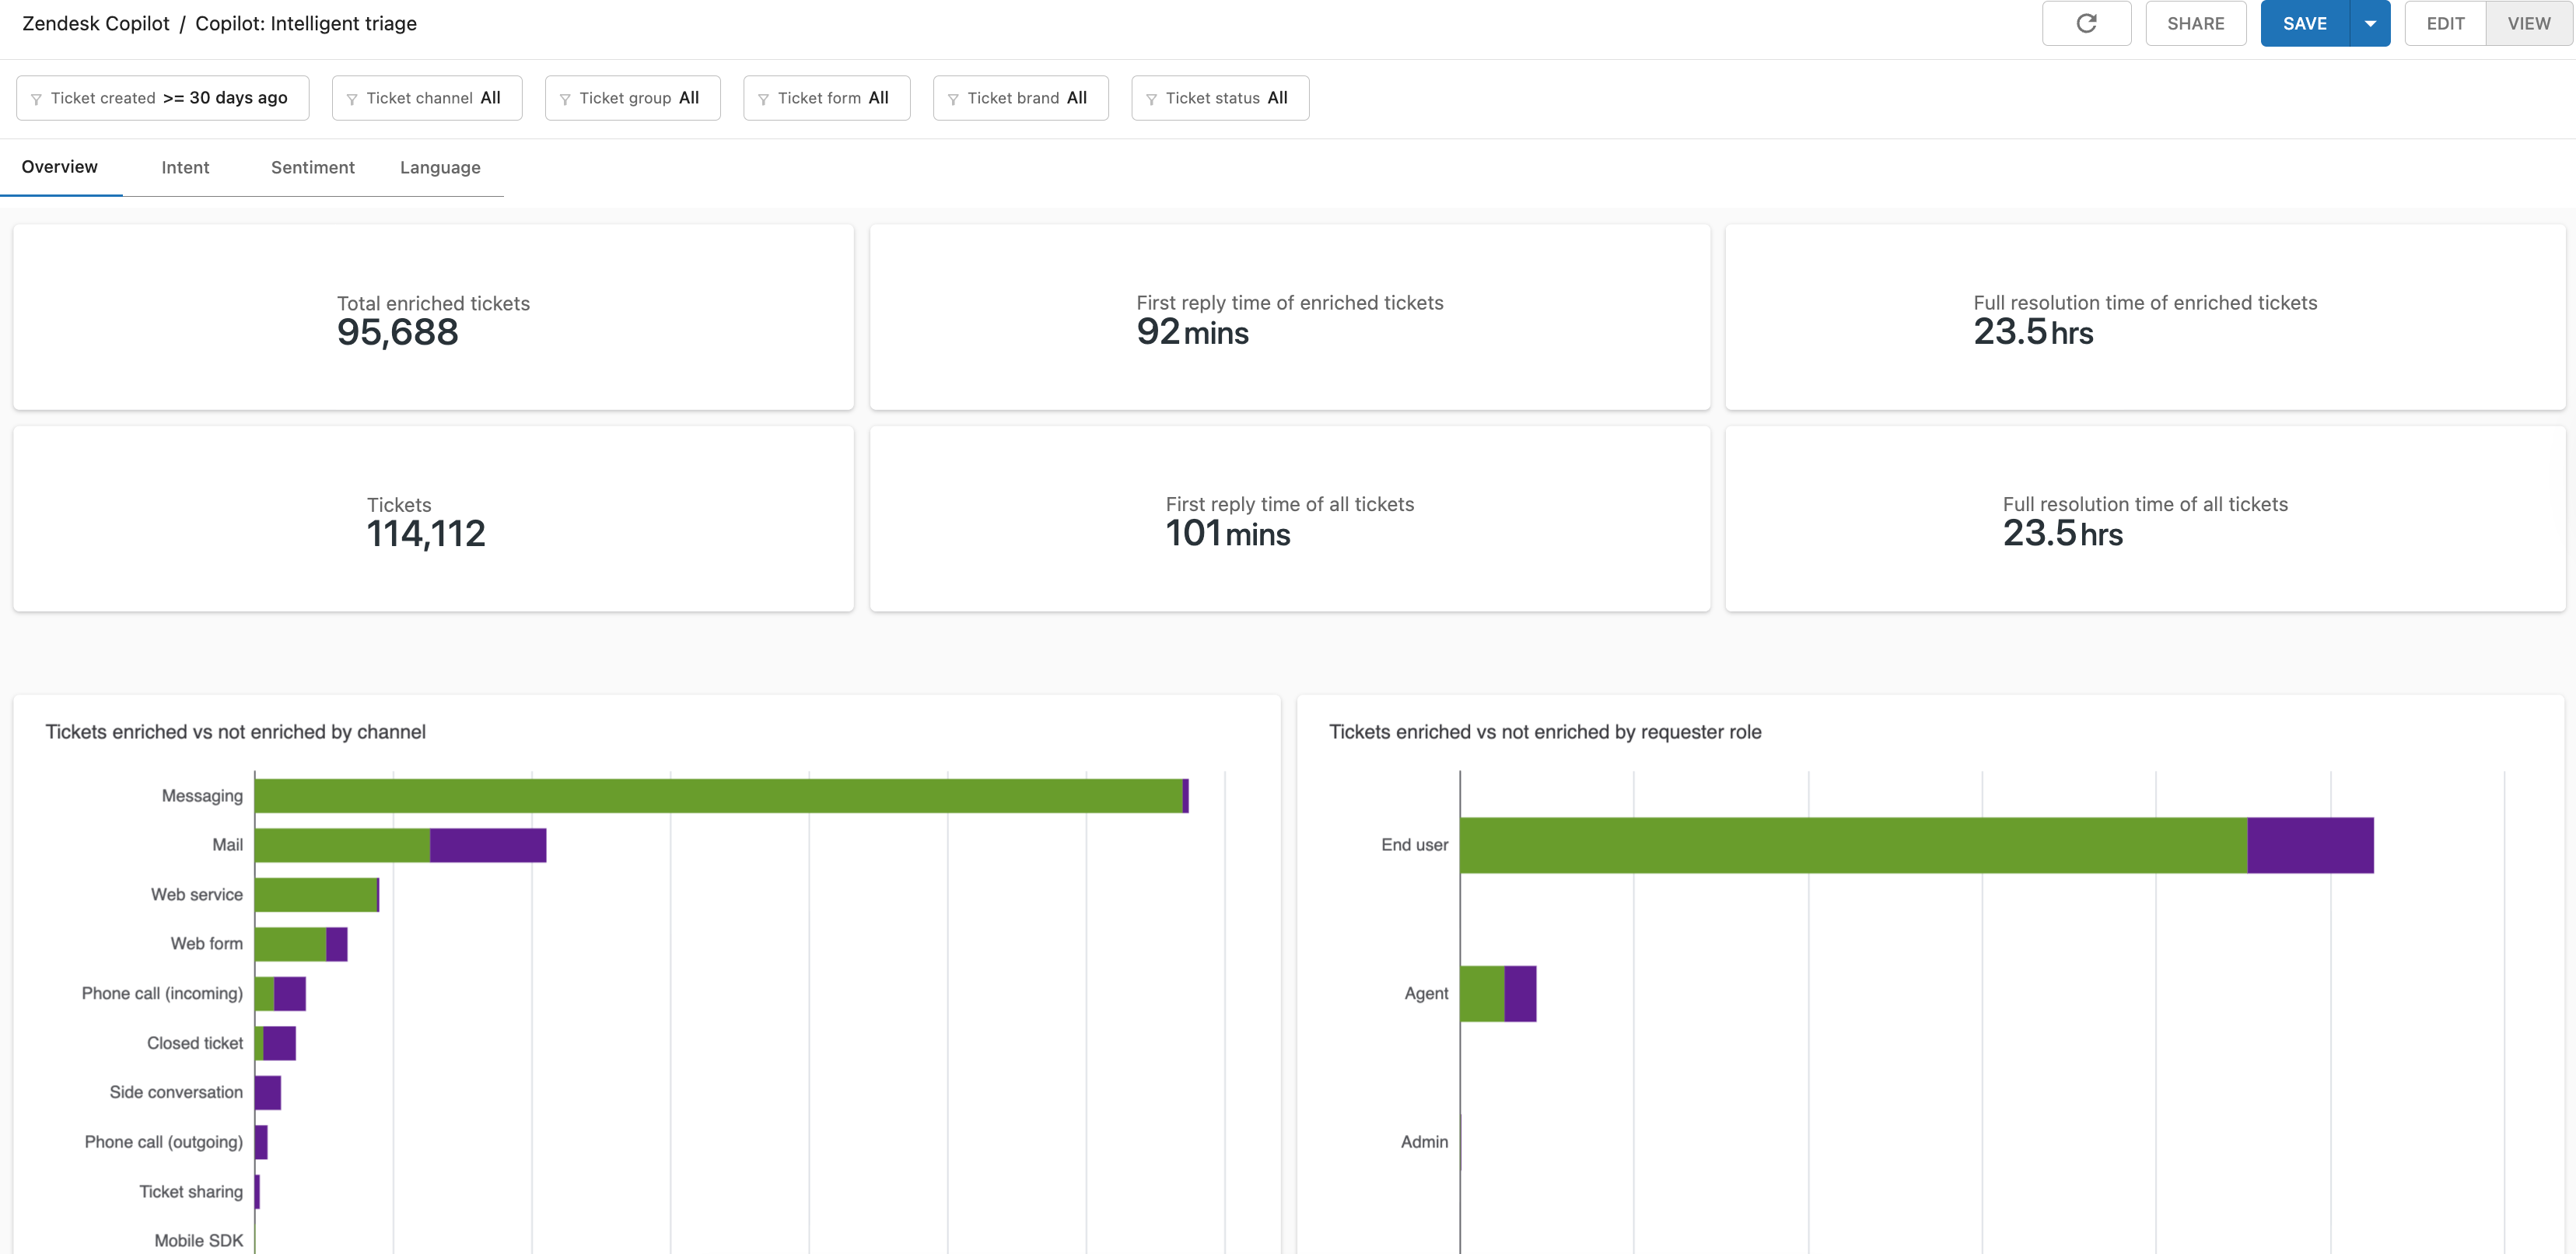
The dashboard opens on the overview tab.
Understanding the Copilot: Intelligent triage dashboard reports
The Copilot: Intelligent triage dashboard contains the following tabs:
- Overview: Reports that help you understand which tickets were classified by intelligent triage.
- Intent: Reports that help you understand where and how tickets were classified by topic.
- Sentiment: Reports that help you understand where and how tickets were classified by sentiment.
- Language: Reports that help you understand where and how tickets were classified by language.
All reports can be filtered by ticket created date, ticket channel, ticket group, ticket form, ticket brand, and ticket status.

Understanding the Overview tab
The overview tab contains information about tickets classified by topic, entity, language, and sentiment.
Overview tab headline metrics
The overview tab contains the following headline metrics (KPIs):
- Total enriched tickets: The total number of tickets enriched with topic, language, or sentiment
- First reply time of enriched tickets: The median first reply time for all enriched tickets.
- Full resolution time of enriched tickets: The median full resolution time for all enriched tickets.
- Tickets: A count of all created tickets.
- First reply time of all tickets: The median first reply time for all tickets.
- Full resolution time of all tickets: The median full resolution time for all tickets.

Overview tab reports
The overview tab contains the following reports:
-
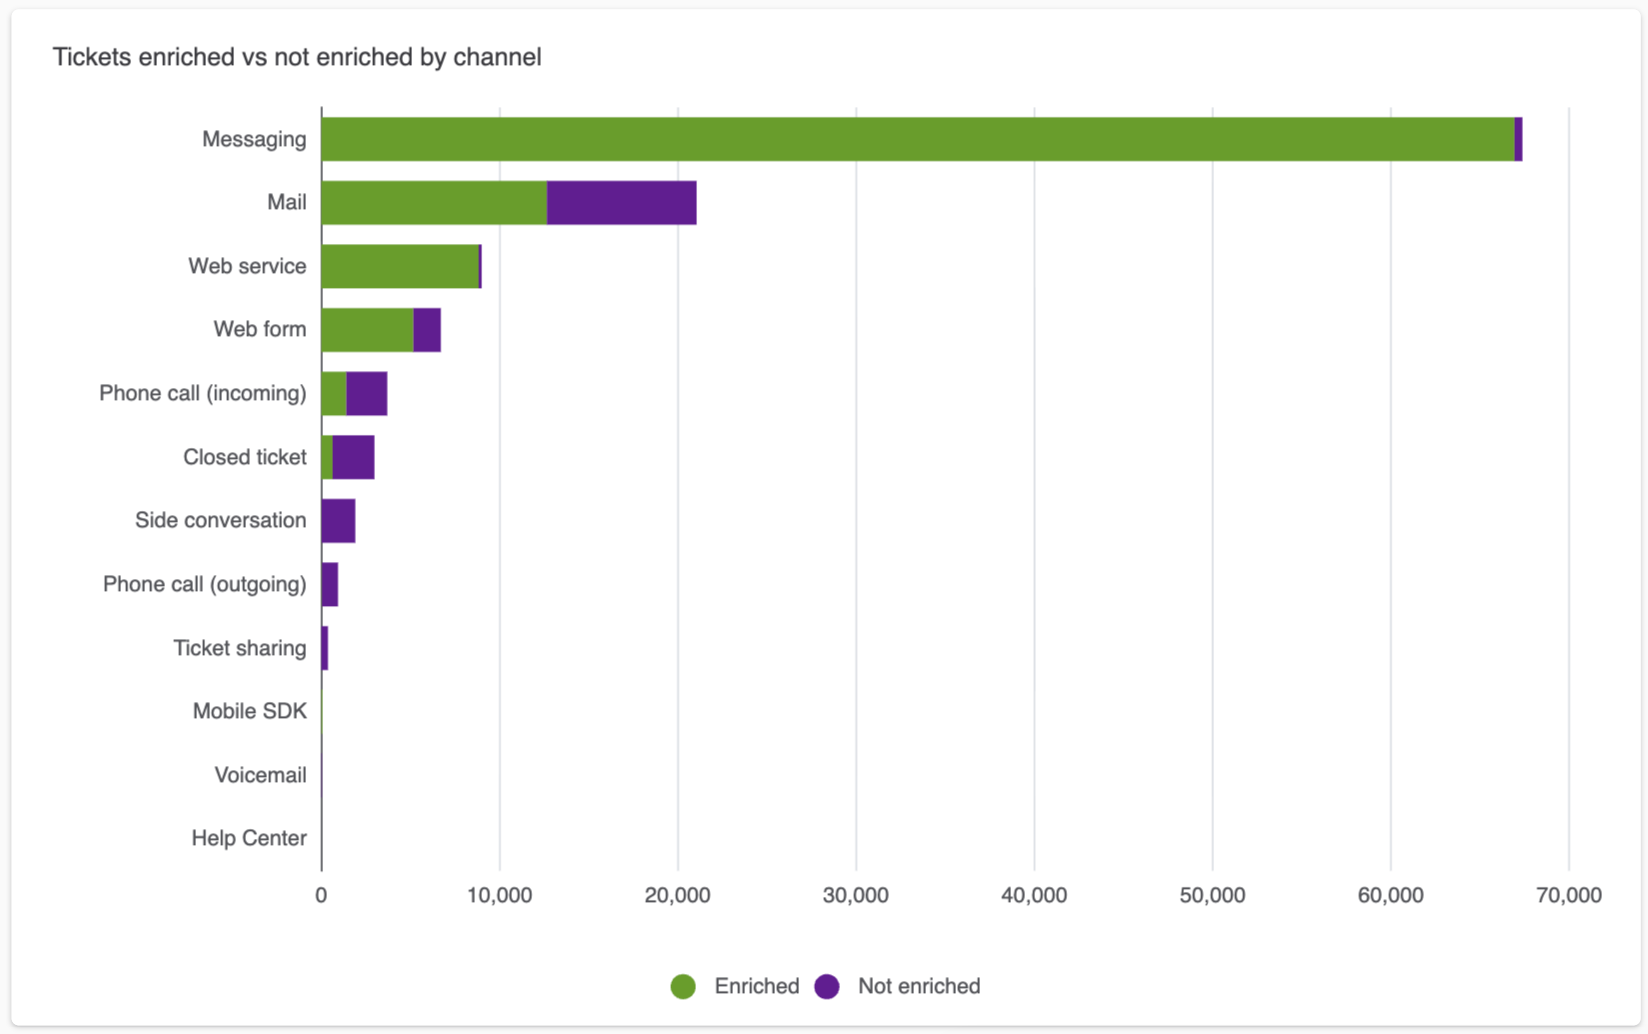
Tickets enriched vs not enriched by channel: A bar chart
displaying the number of classified and not classified tickets for each
ticket channel.
-
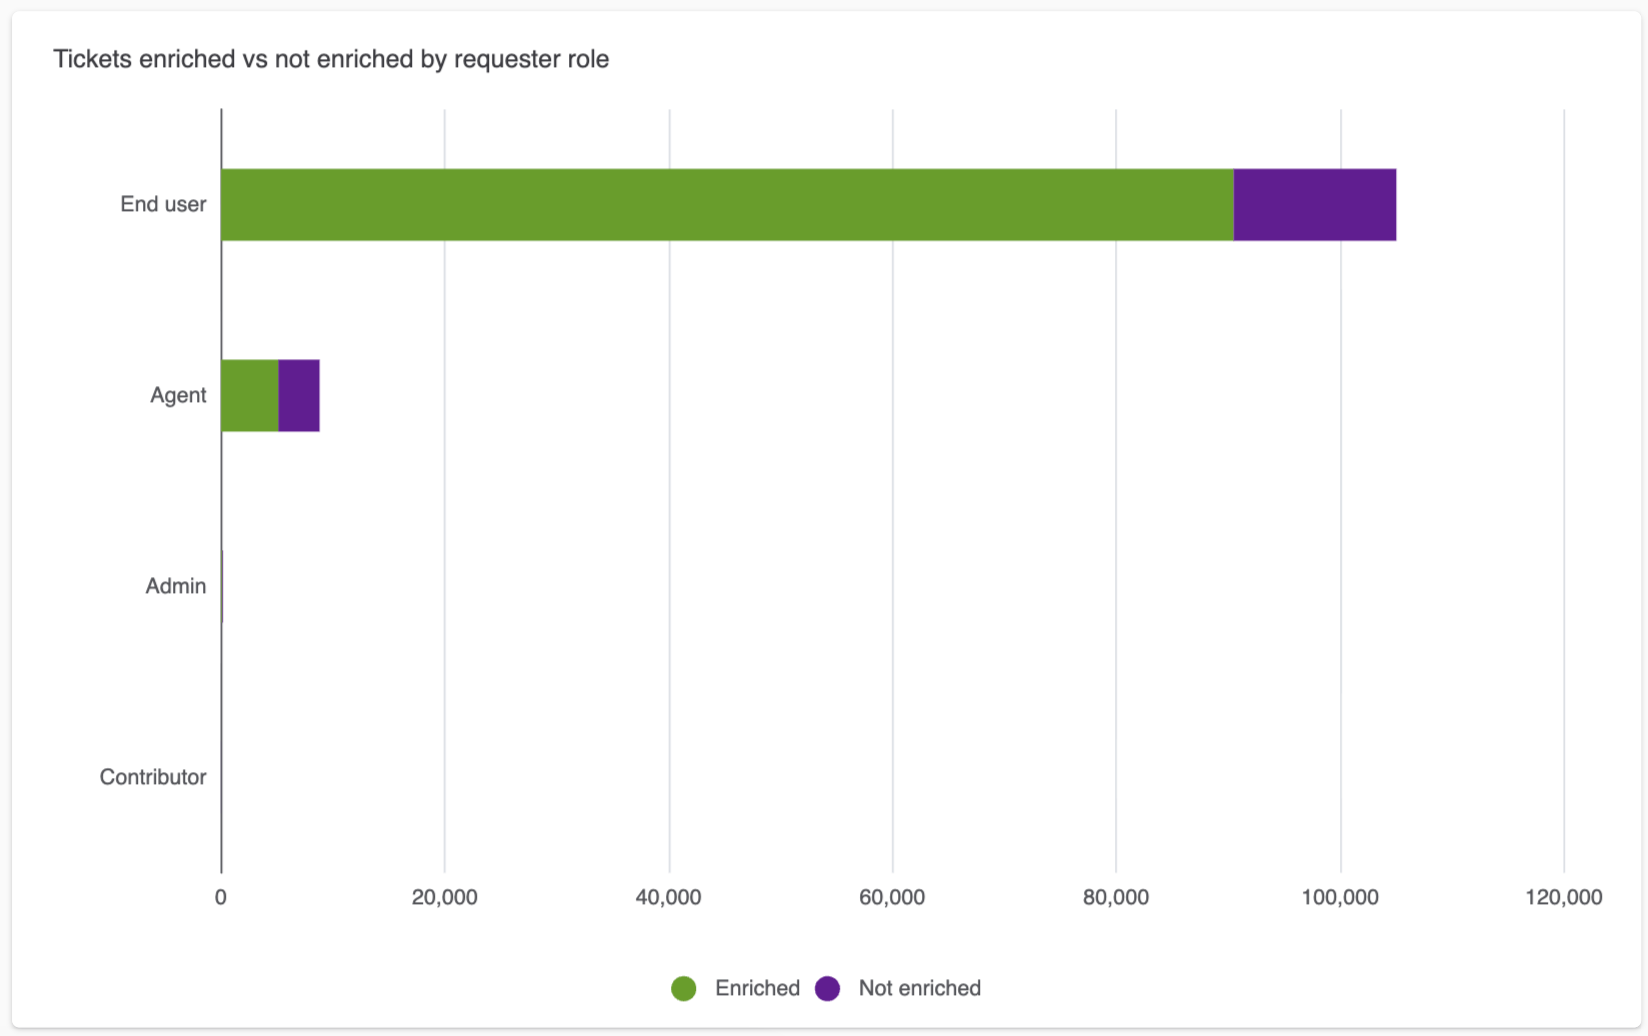
Tickets enriched vs not enriched by requester role: A bar chart
displaying the number of enriched and not enriched tickets for each
requester role, for example, end users, or agents.
Understanding the Intent tab
The intent tab shows information about tickets enriched with topic (intent).
Intent tab headline metrics
This tab displays the following headline metrics (KPIs):
- Intent enriched tickets: The number of tickets enriched with topic.
- First reply time intent enriched: The median first reply time for all topic-enriched tickets.
- Full resolution time intent enriched: The median full resolution time for all topic-enriched tickets.
- Tickets: The total number of tickets.
- First reply time of all tickets: The median full resolution time of all tickets.
- Full resolution time of all tickets: The full resolution time of all tickets.

Intent tab reports
The intent tab contains the following reports:
-
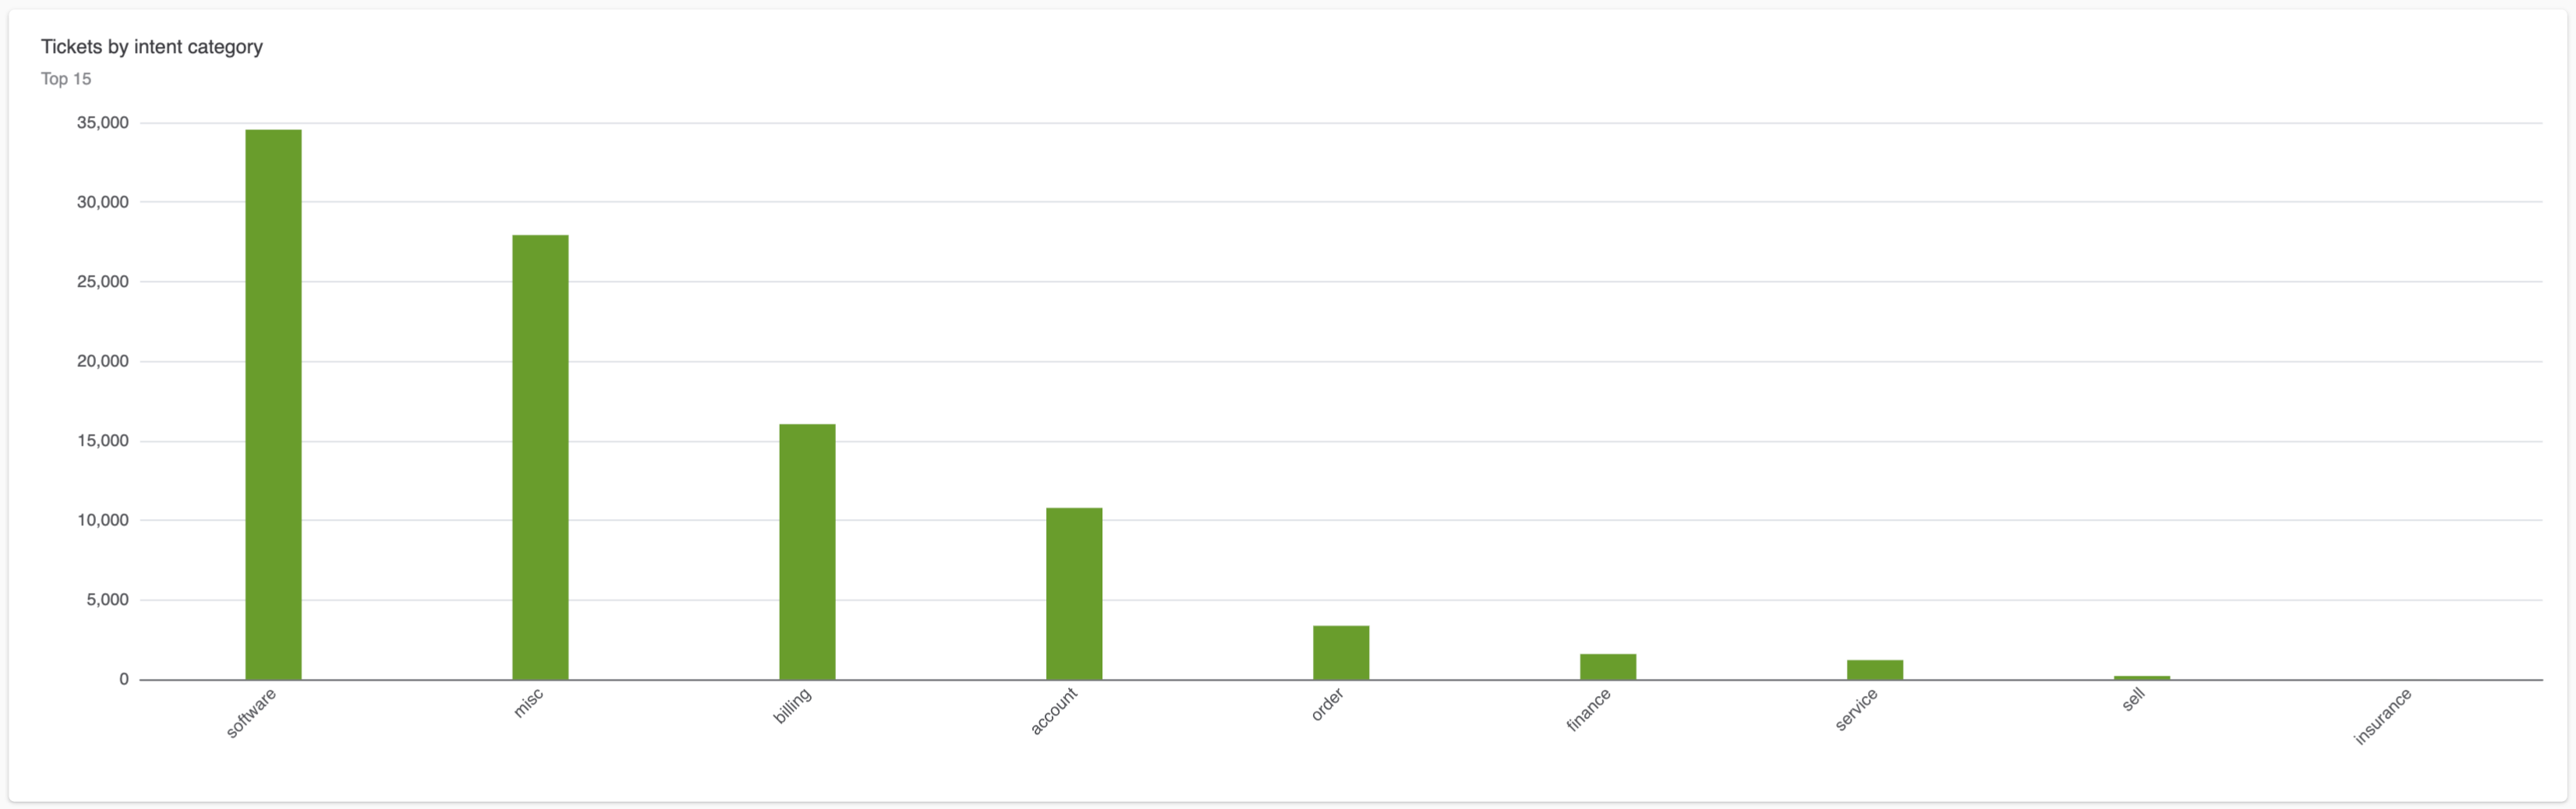
Tickets by intent category: A column chart displaying the number
of tickets for each topic category.
-
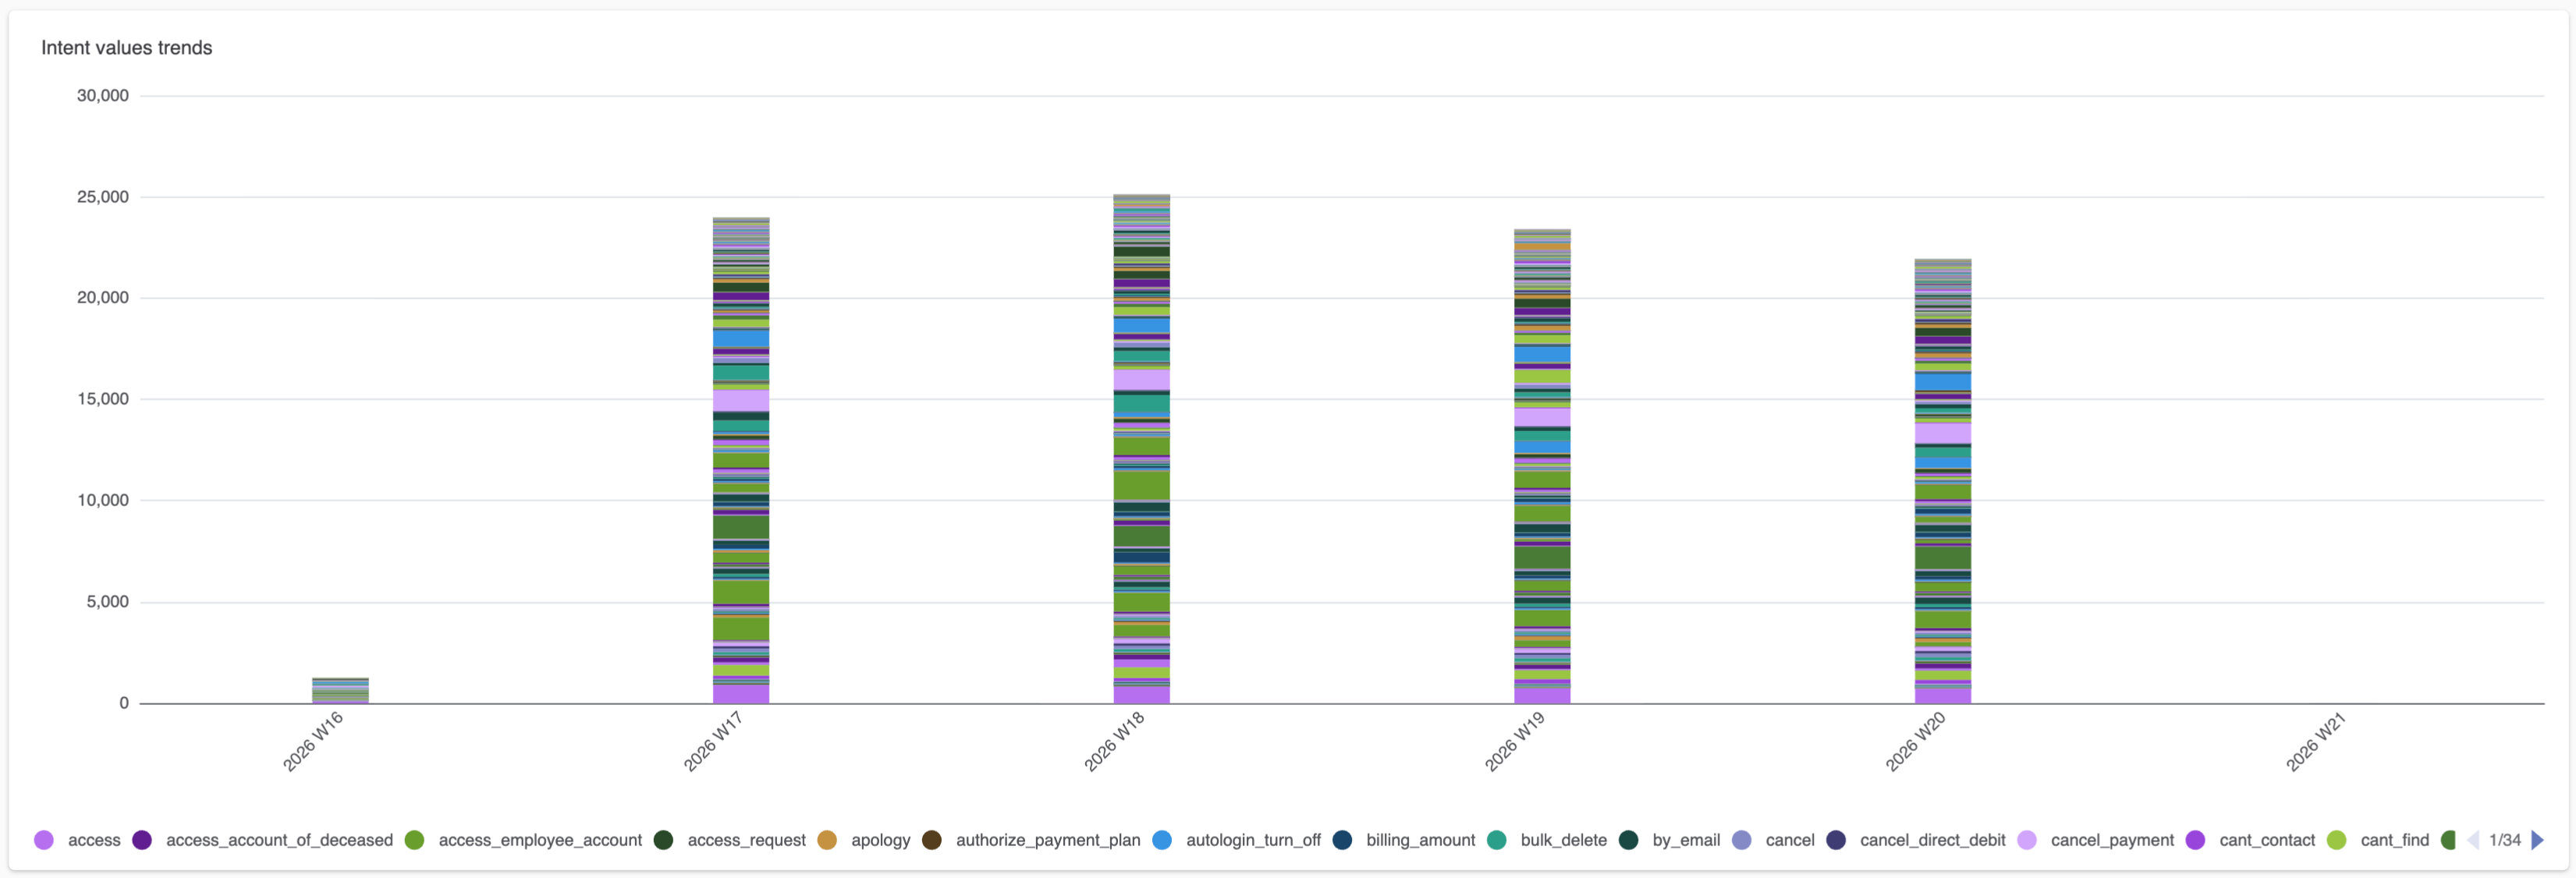
Intent values trends: A stacked column chart displaying your top
topics over time.
-
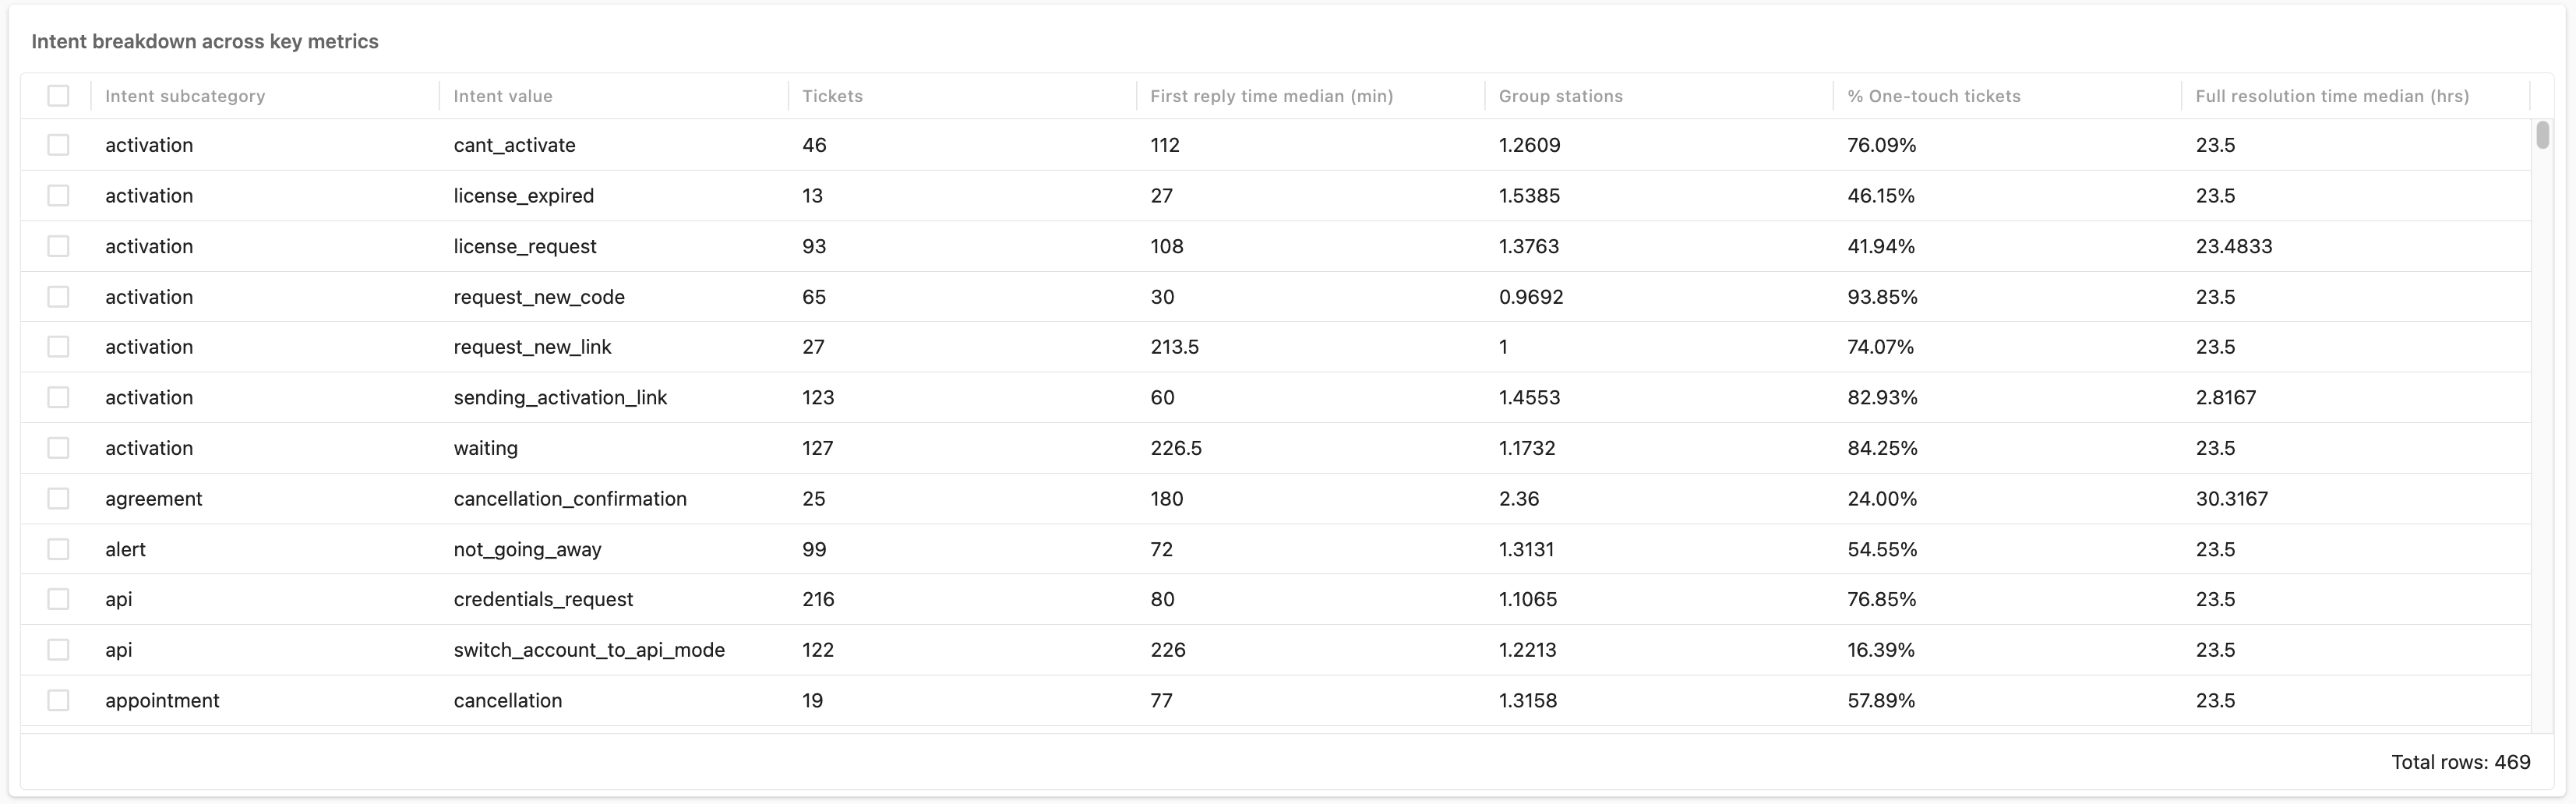
Intent breakdown across key metrics: A table displaying detailed
information about your tickets with topics, including first reply time,
group stations, one-touch tickets, and more.
-
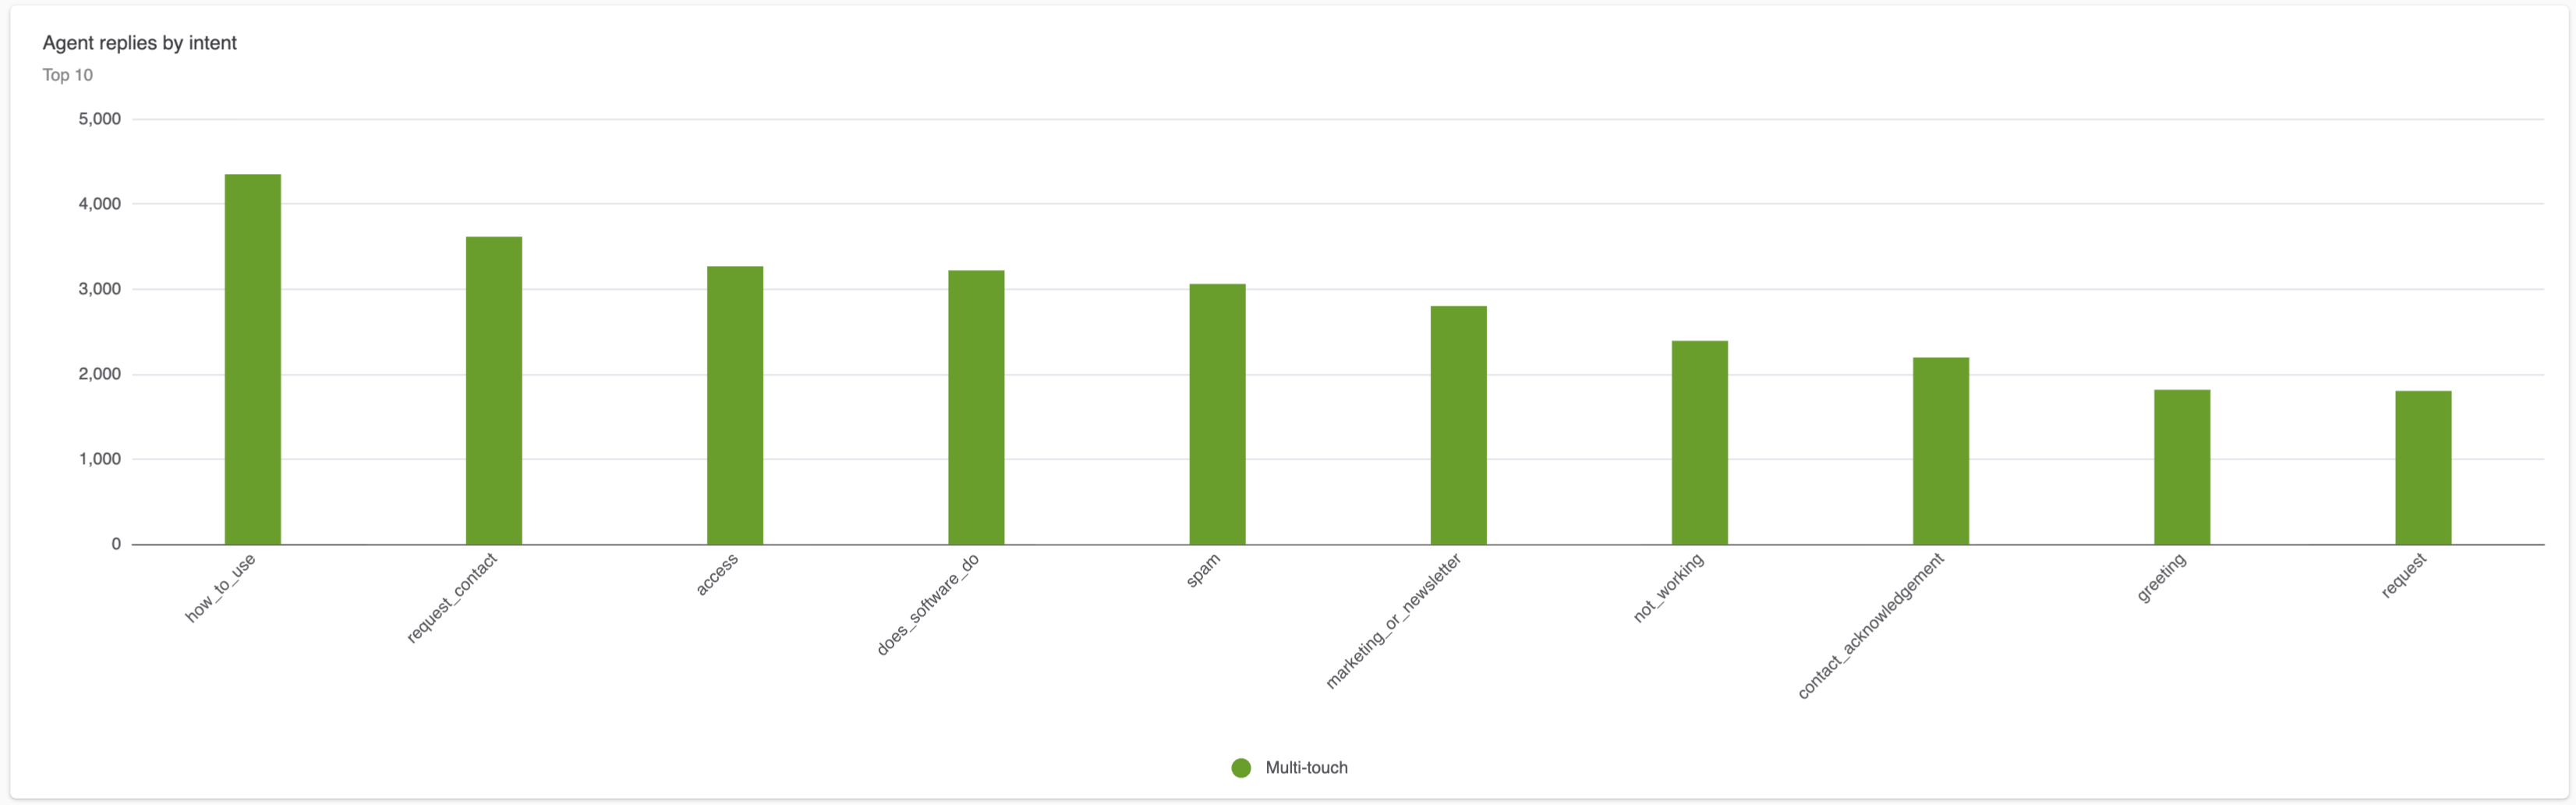
Agent replies by intent: A column chart displaying the number of
agent replies for each of your topics.
-
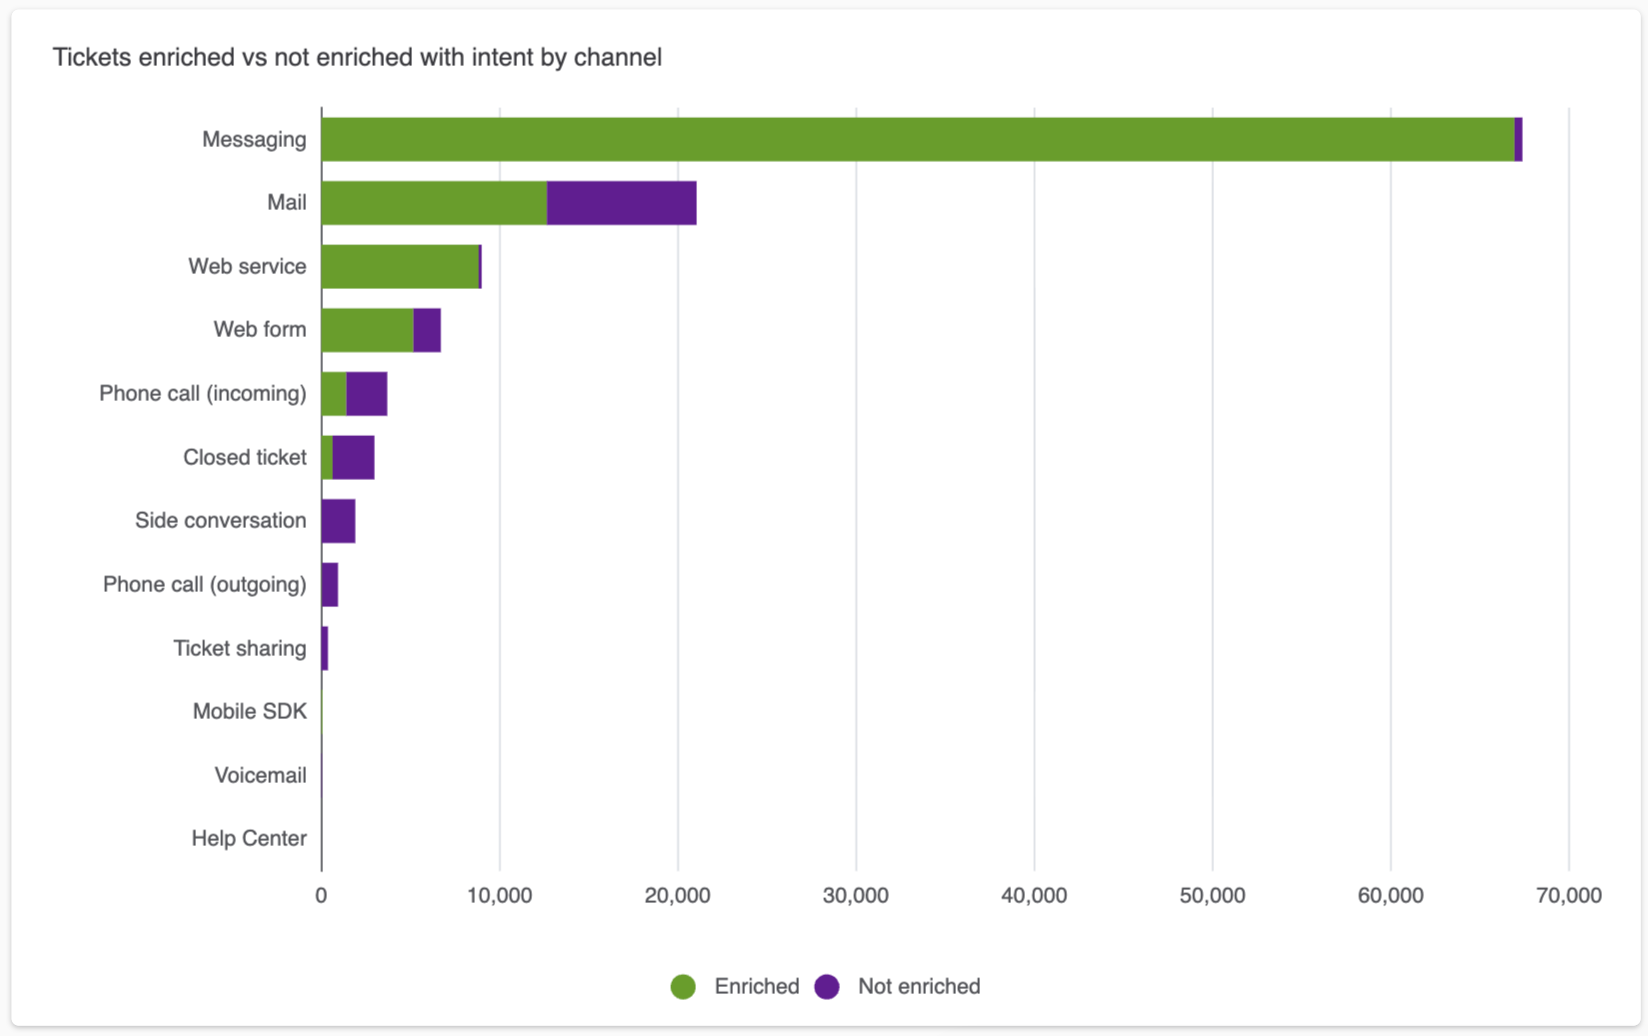
Tickets enriched vs not enriched with intent by channel: A bar
chart displaying the number of tickets that were enriched or not
enriched by channel.
-
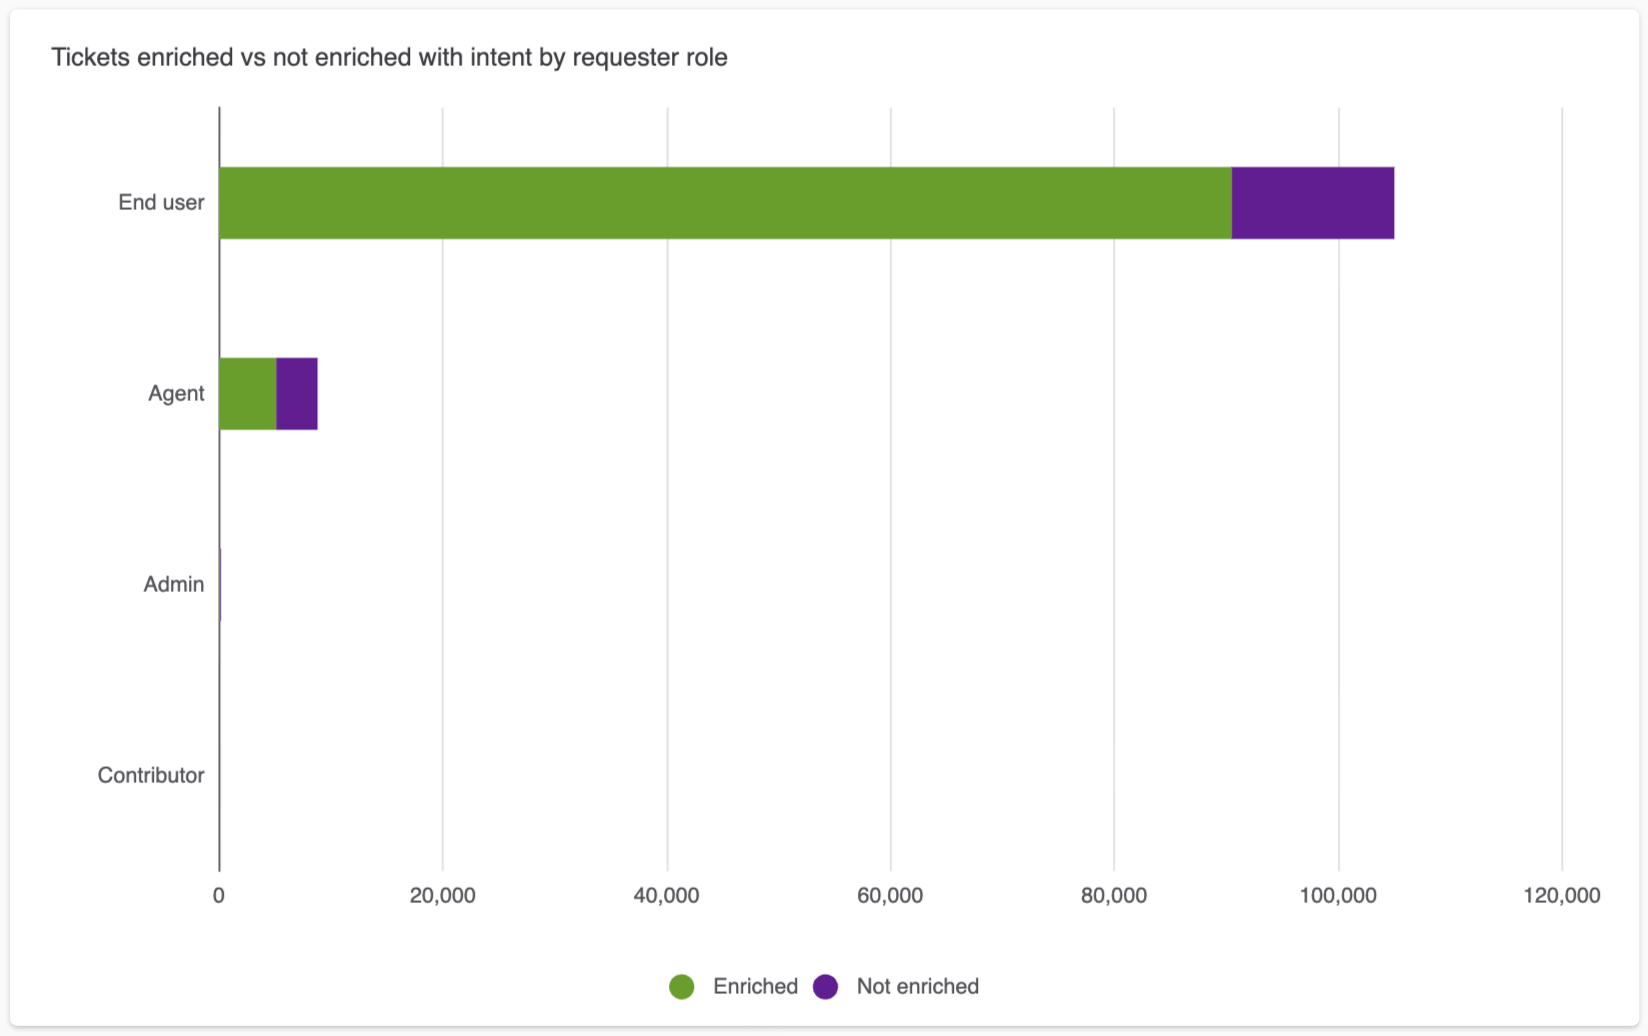
Tickets enriched vs not enriched with intent by requester role: A
bar chart displaying the number of tickets that were enriched or not
enriched by the requesters role.
Understanding the Sentiment tab
The sentiment tab shows information about tickets classified by sentiment.
Sentiment tab headline metrics
This tab displays the following headline metrics (KPIs):
- Sentiment enriched tickets: The total number of tickets enriched with sentiment.
- First reply time sentiment enriched: The median first reply time for all sentiment-enriched tickets.
- Full resolution time sentiment enriched: The median full resolution time for all sentiment-enriched tickets.
- Tickets: The total number of tickets.
- First reply time of all tickets: The median first reply time of all tickets.
- Full resolution time of all tickets: The median full resolution time of all tickets.

Sentiment tab reports
The sentiment tab contains the following reports:
-
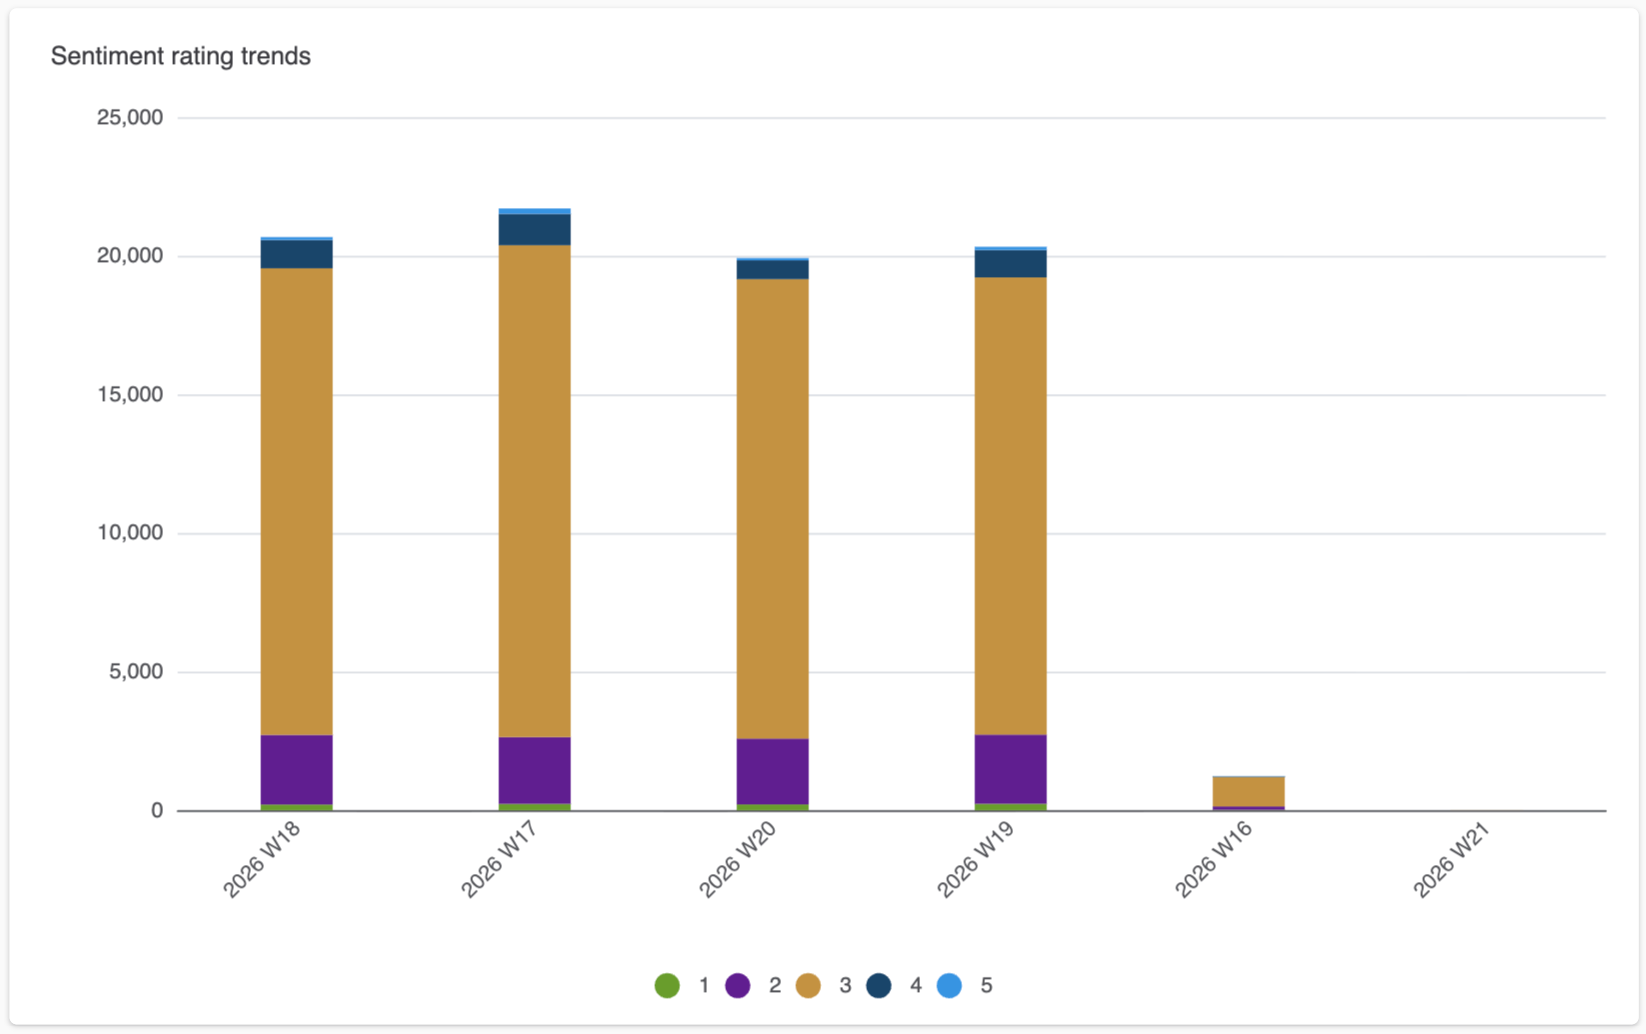
Sentiment rating trends: A stacked column chart displaying your
ticket sentiment ratings over time.
-
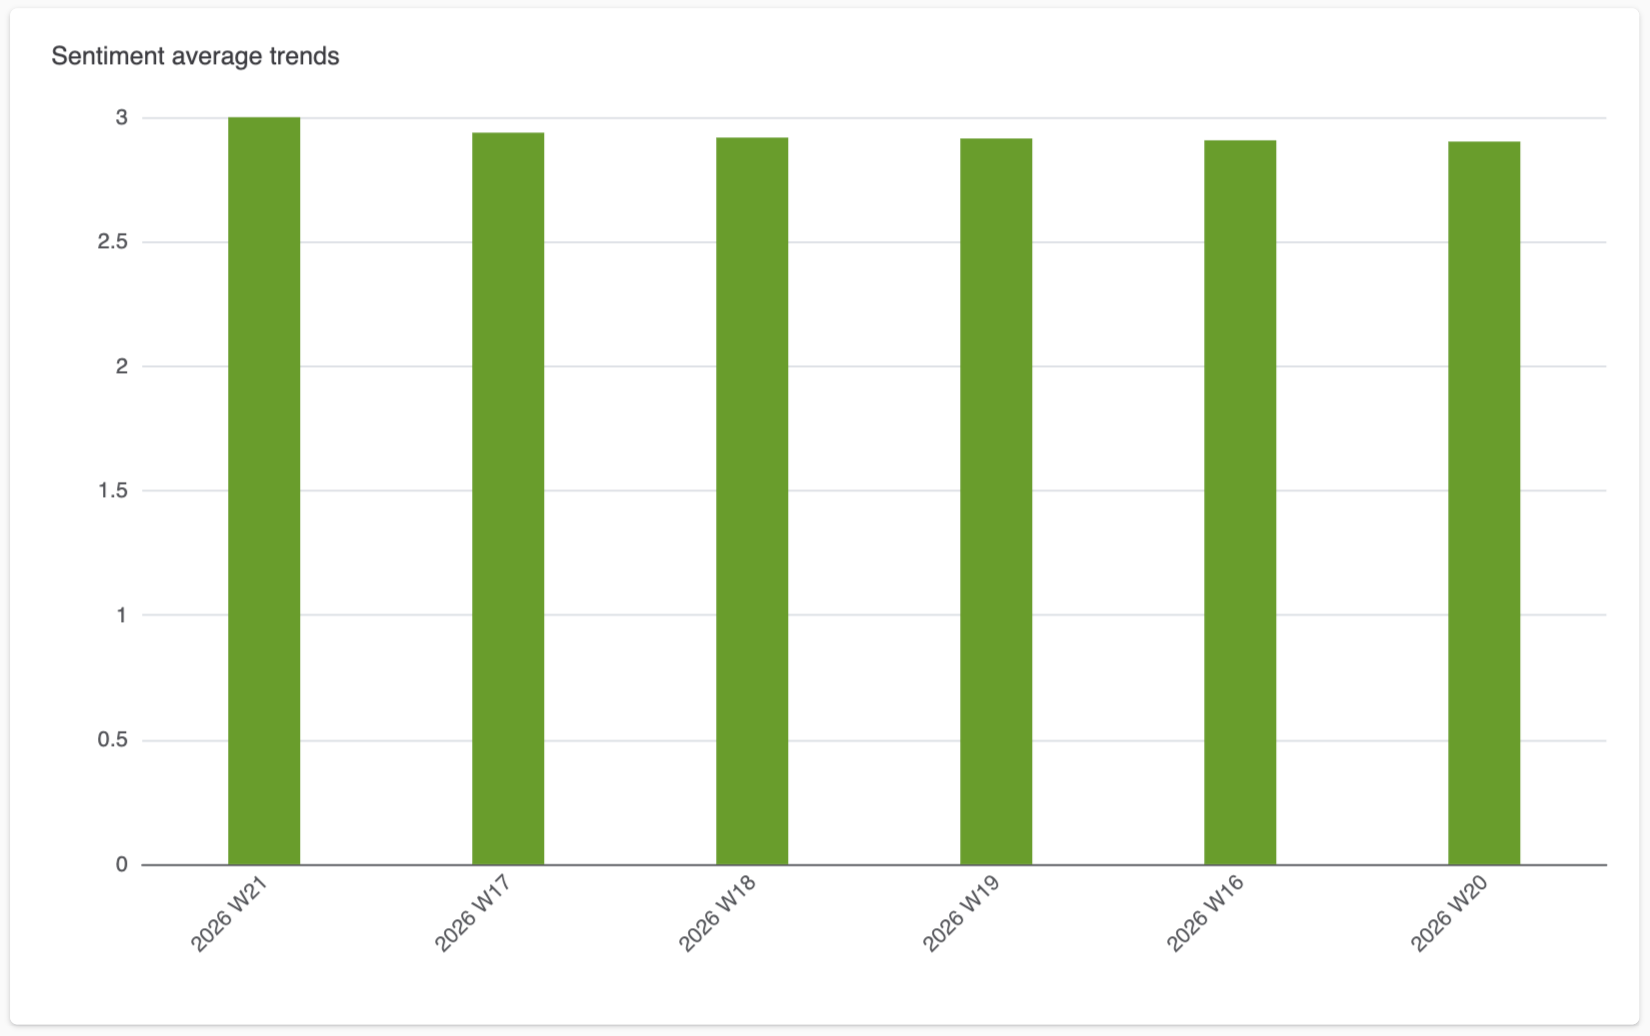
Sentiment average trends: A column chart displaying your average
ticket sentiment ratings over time.
-
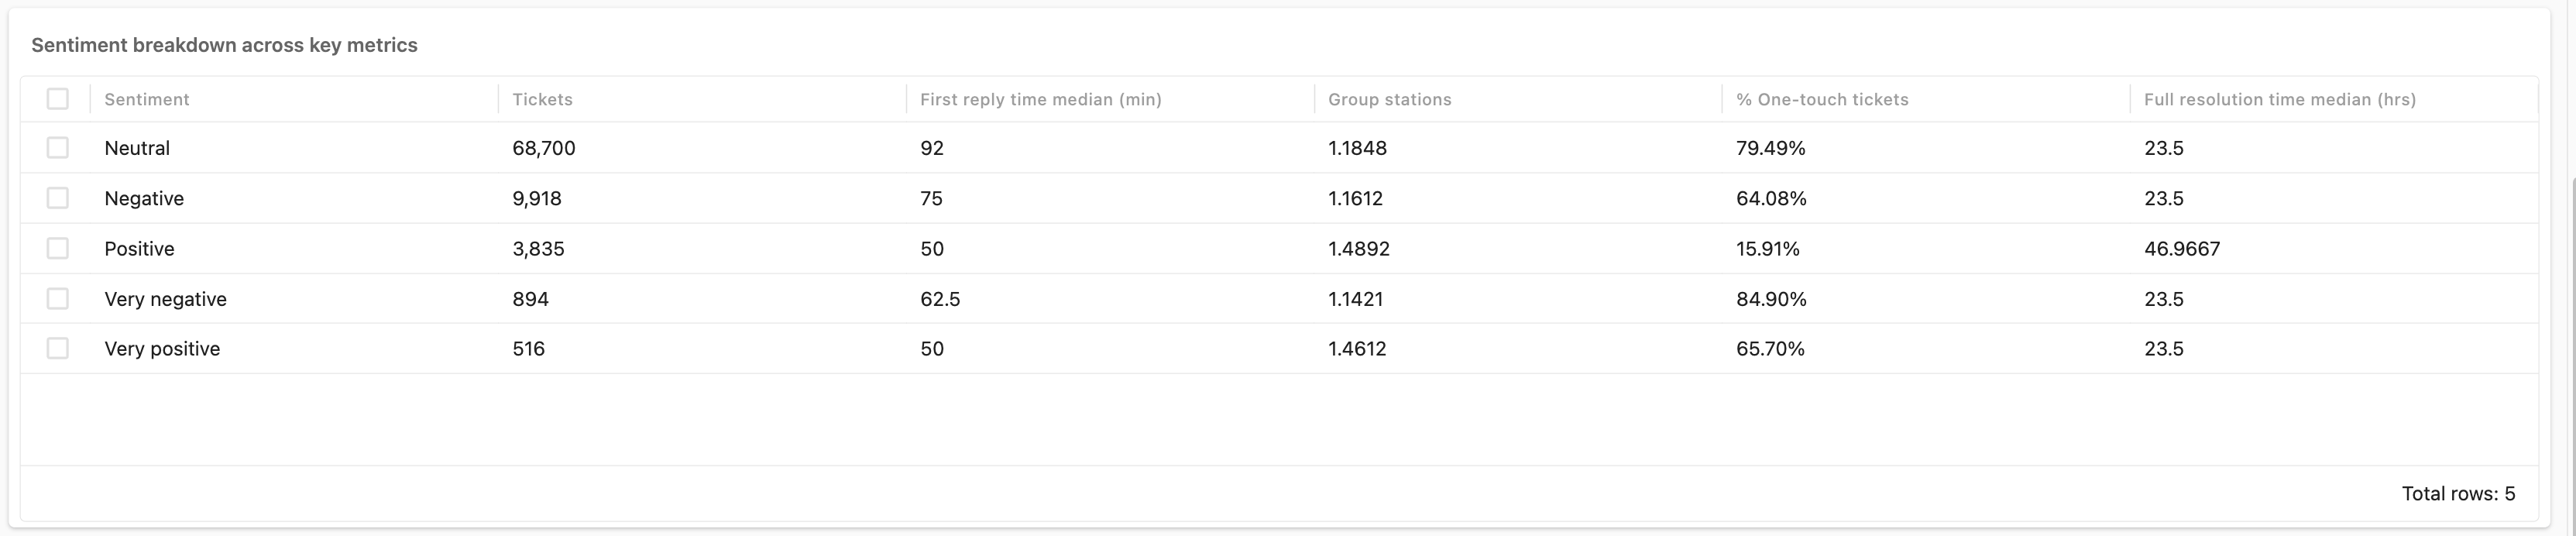
Sentiment breakdown across key metrics: A table displaying
detailed information for each of your sentiments including number of
tickets, first reply time, and full resolution time.
-
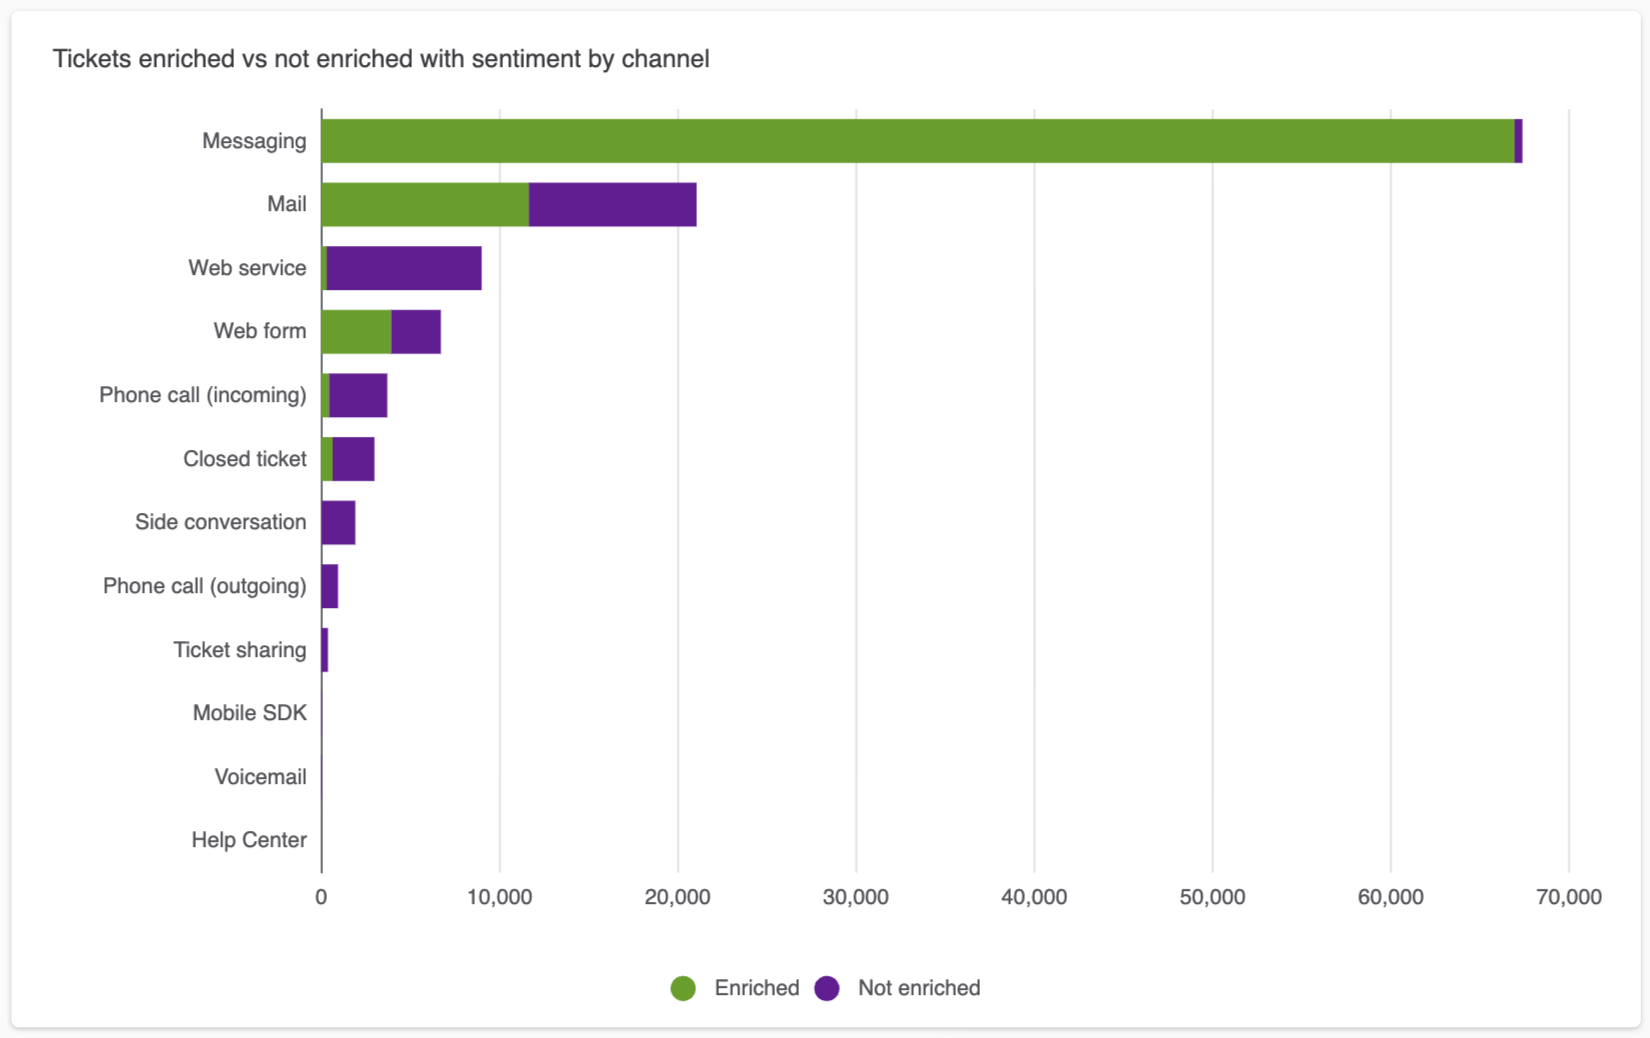
Tickets enriched vs not enriched with sentiment by channel: A
stacked bar chart displaying the number of tickets that were and were
not enriched with sentiment.
-
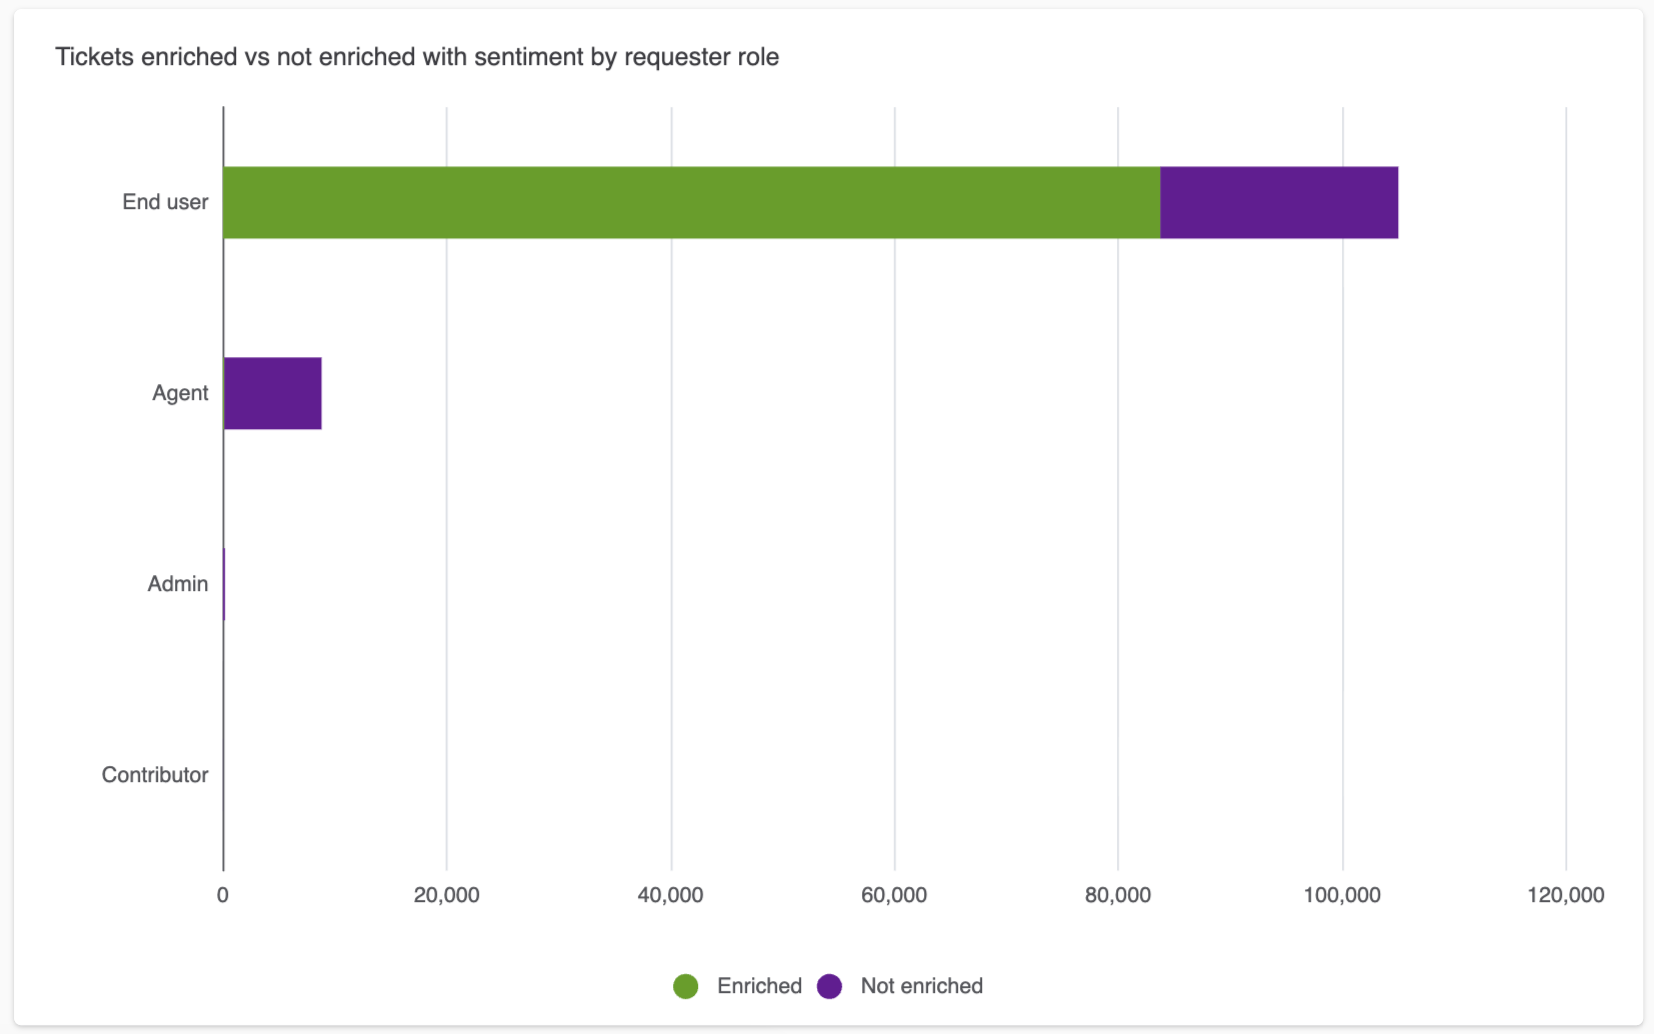
Tickets enriched vs not enriched with sentiment by requester
role: A stacked bar chart displaying the number of tickets that were
and were not enriched with sentiment sorted by requester role.
Understanding the Language tab
The language tab shows information about tickets classified by language.
Language tab headline metrics
This tab displays the following headline metrics (KPIs):
- Language enriched tickets: The total number of tickets enriched with language.
- First reply time language enriched: The median first reply time for all language-enriched tickets.
- Full resolution time language enriched: The median full resolution time for all language-enriched tickets.
- Tickets: The total number of tickets.
- First reply time of all tickets: The median first reply time of all tickets.
- Full resolution time of all tickets: The median full resolution time of all tickets.

Language tab reports
The language tab contains the following reports:
-
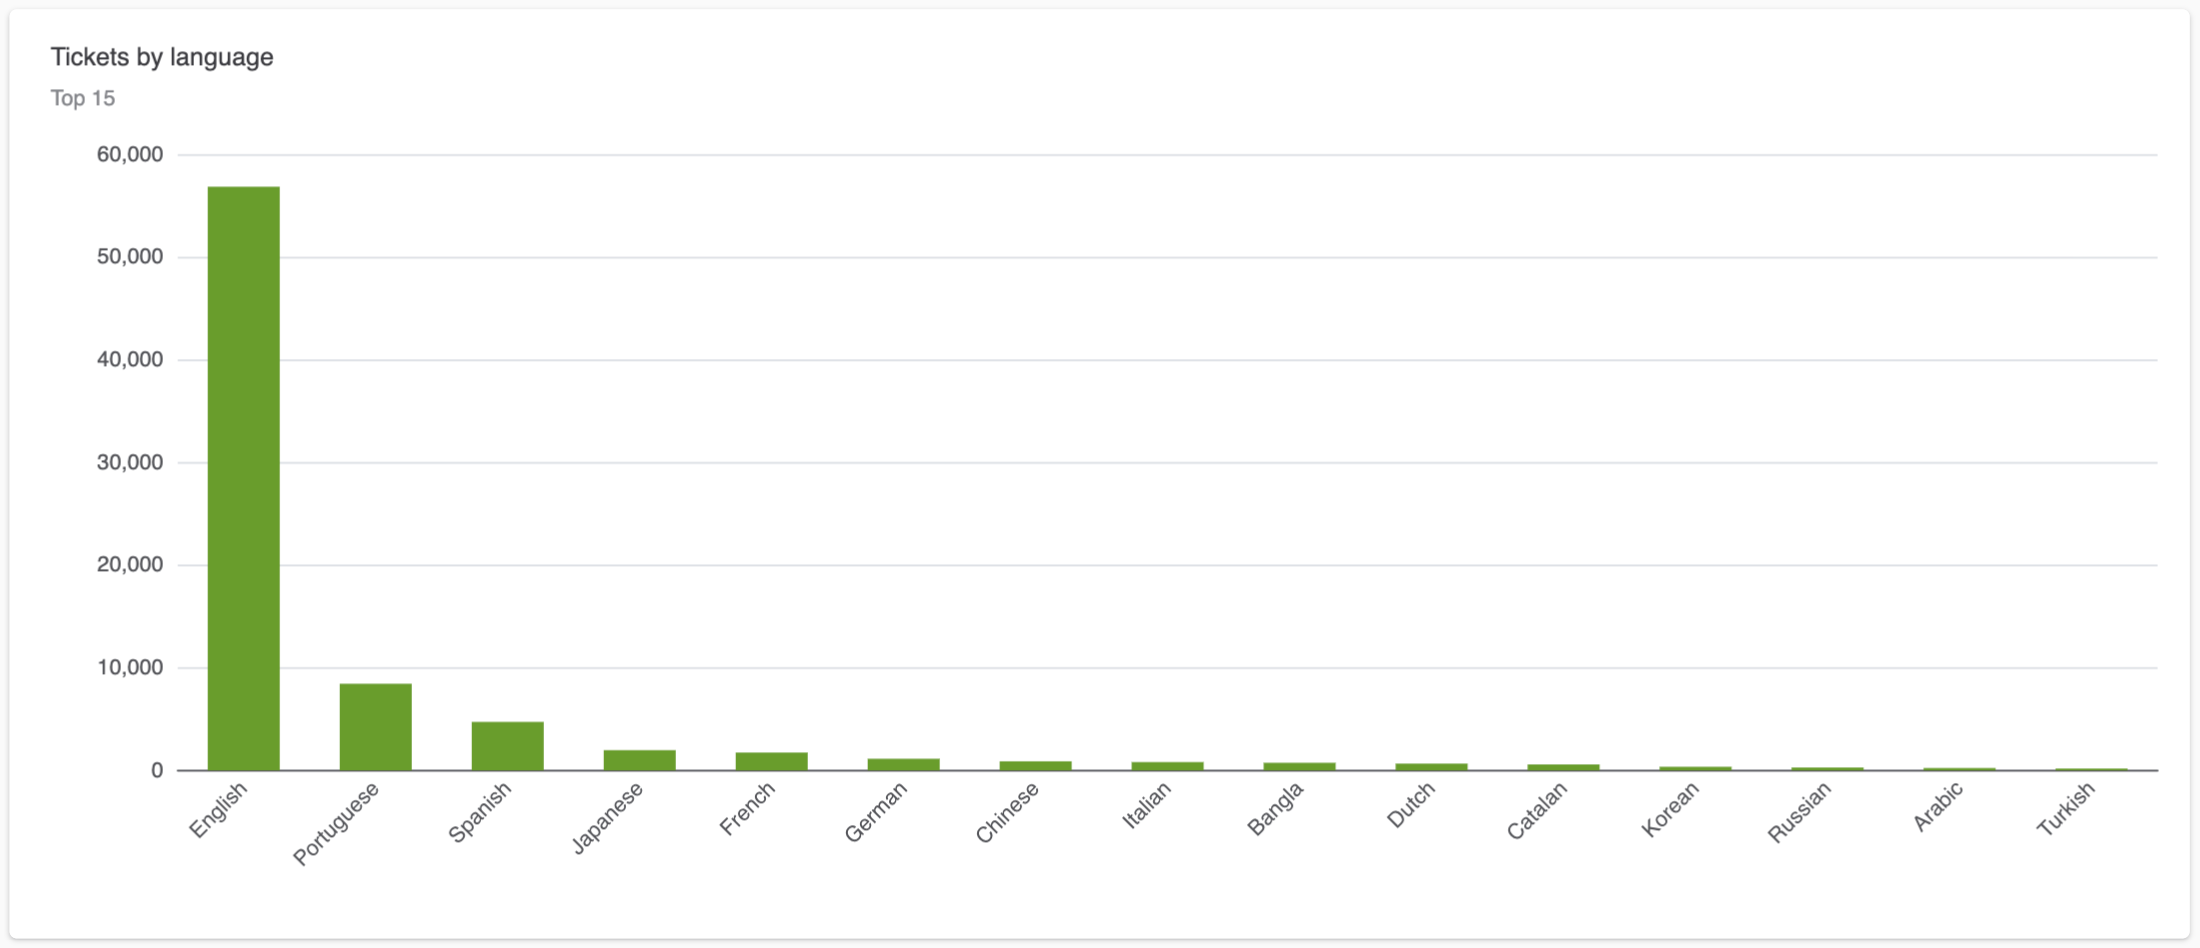
Tickets by language: A column chart displaying the number of
language enriched tickets by language.
-
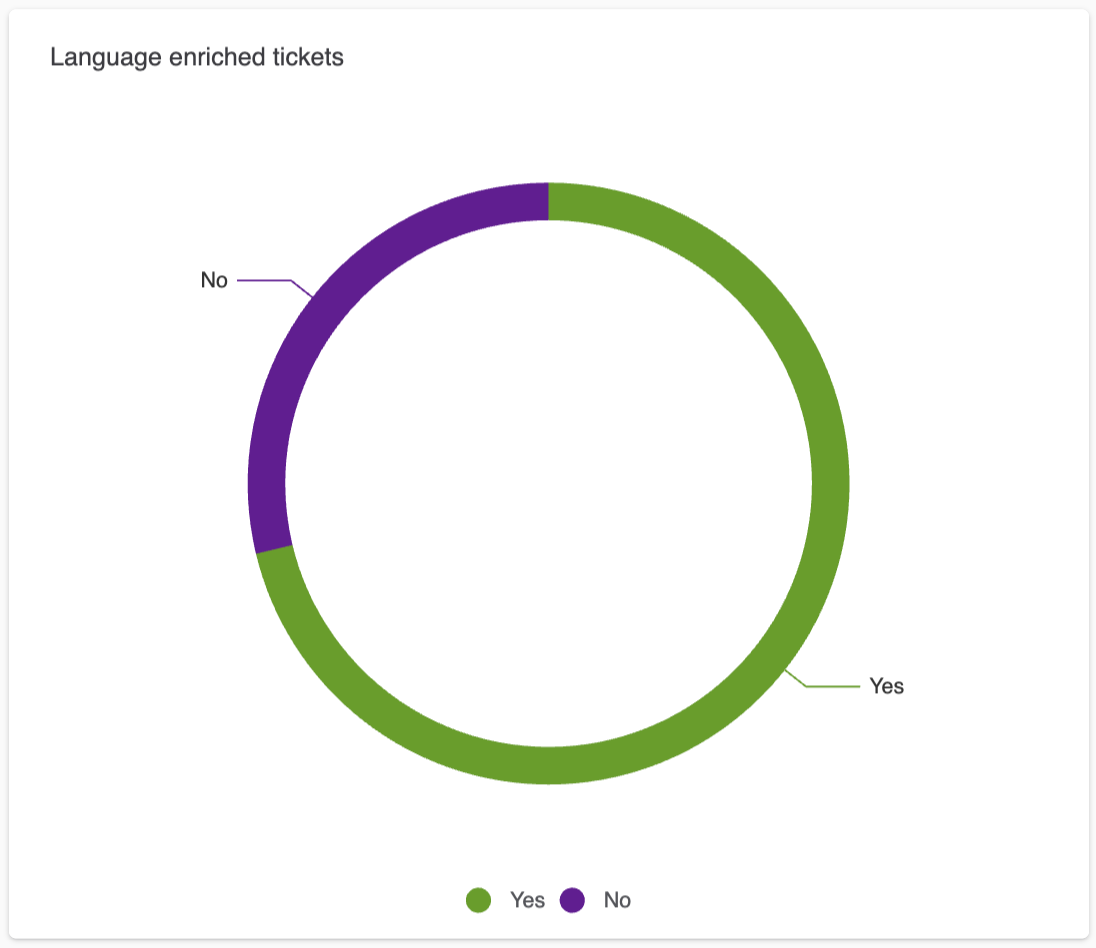
Language enriched tickets: A donut chart displaying the number of
enriched and not enriched tickets.
-
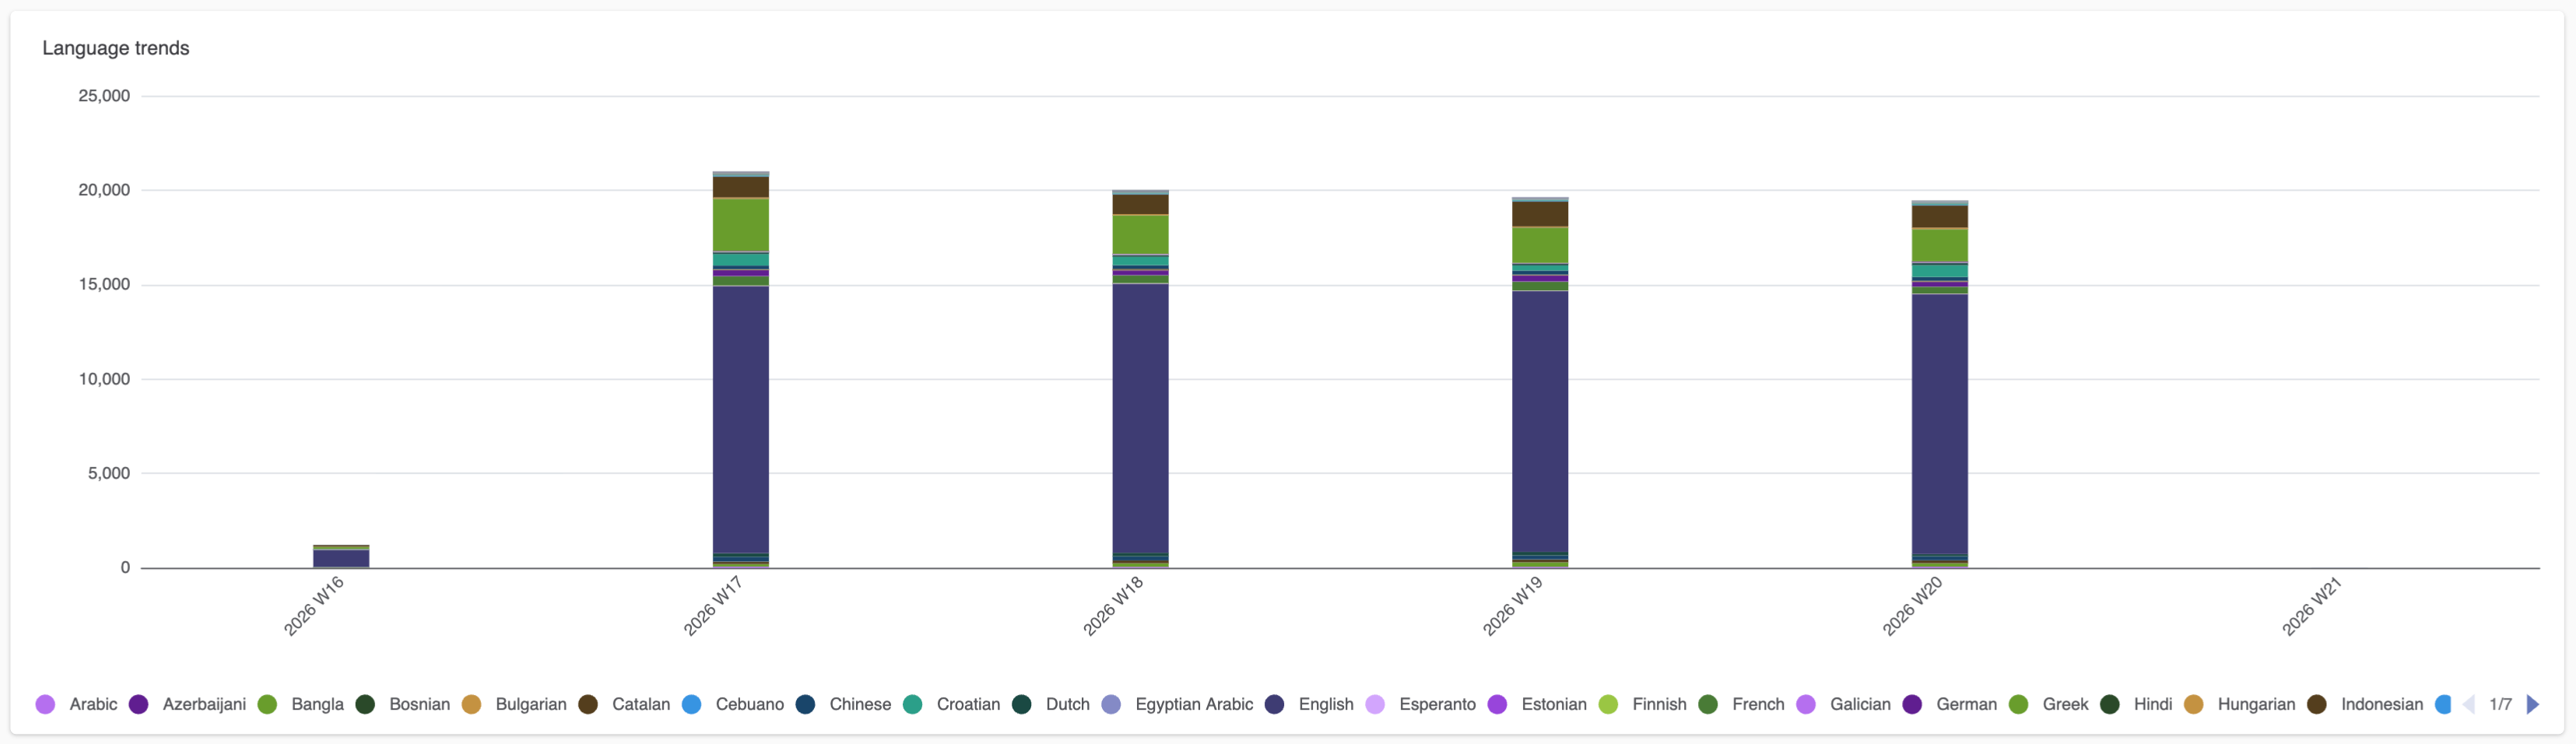
Language trends: A stacked column chart displaying the number of
language-enriched tickets for each language over time.
-
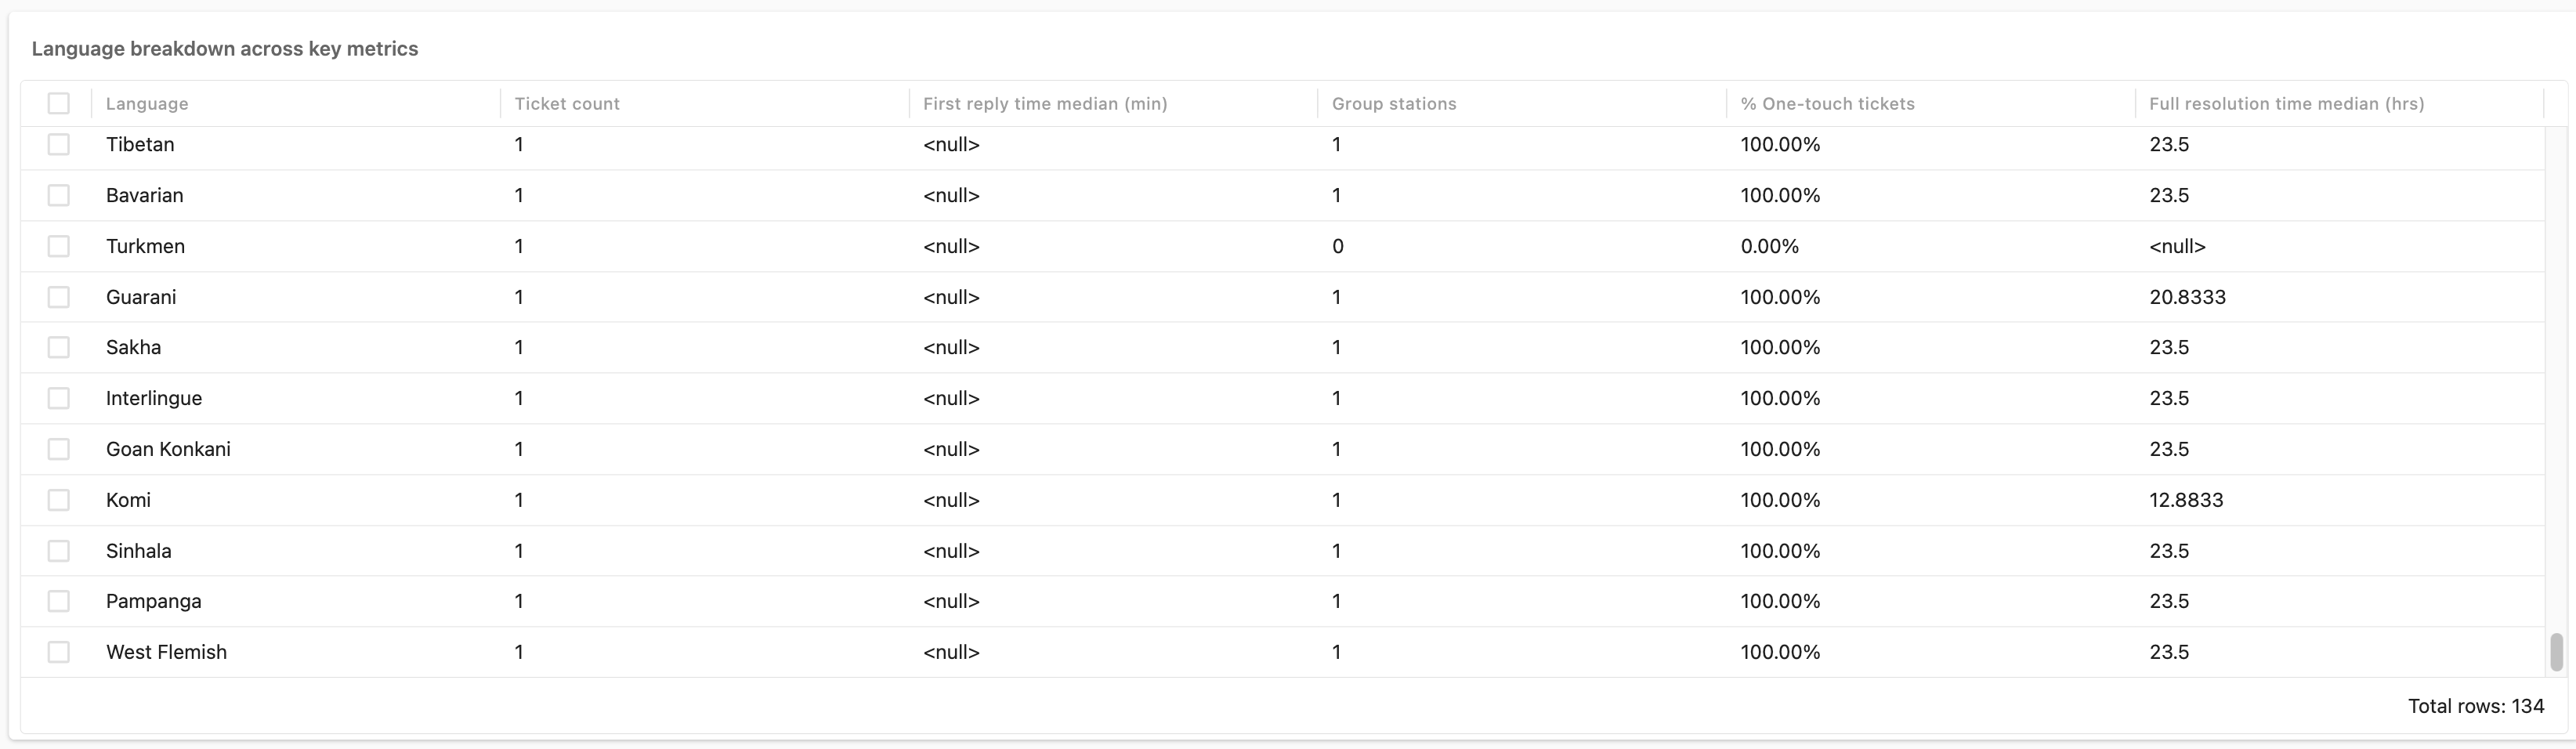
Language breakdown across key metrics: A table displaying
detailed information about tickets enriched with language, including
language, first reply time, full resolution time, and more.
-
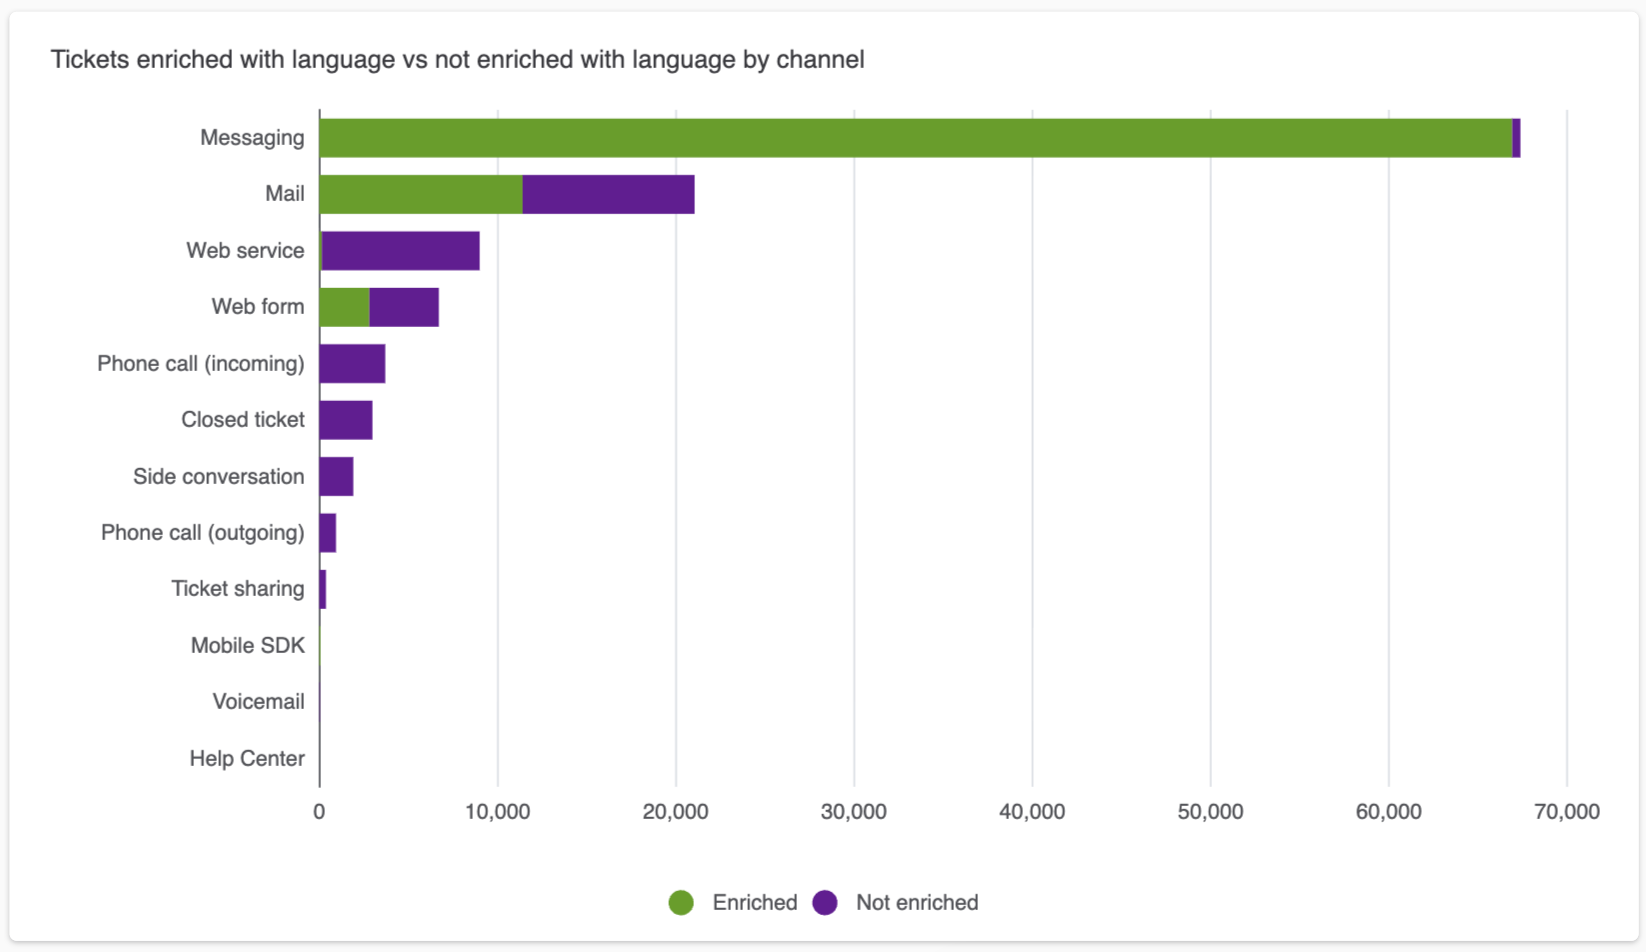
Tickets enriched with language vs not enriched with language by
channel: A stacked bar chart displaying, for each of your
channels, the number of tickets that were and were not enriched with
language.
-
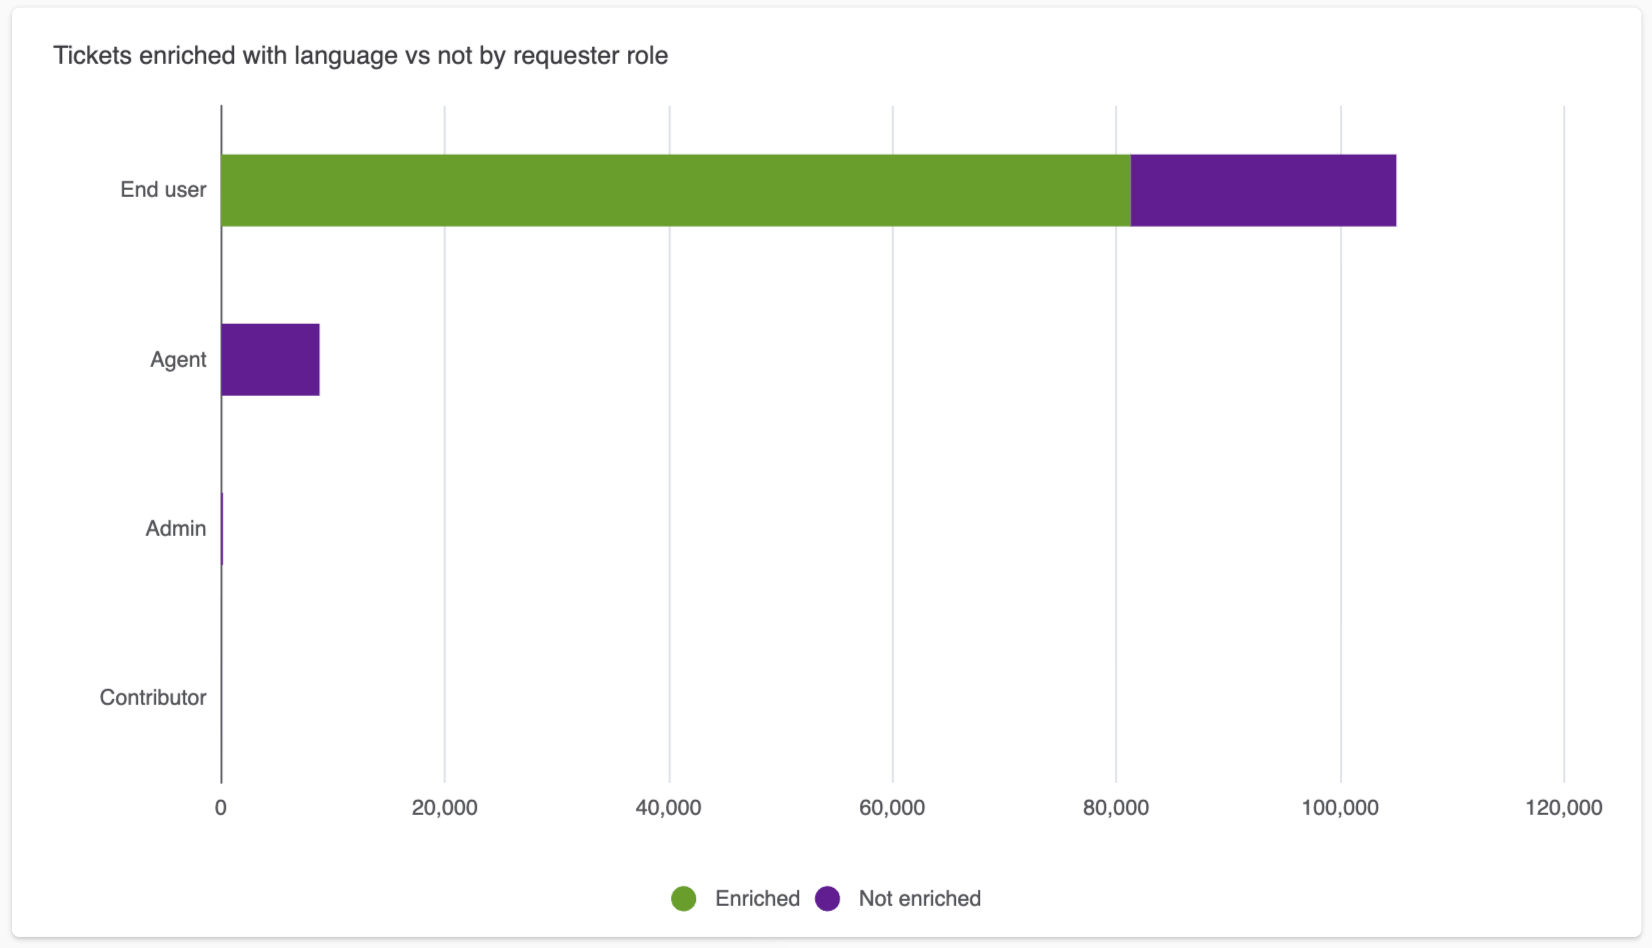
Tickets enriched with language vs not by requester role: A
stacked bar chart displaying, for each requester role, the number of
tickets that were and were not enriched with language.