Summary: ◀▼
Analyst copilot’s IT asset dashboard gives you a single view of the assets you manage, including total assets, available items, assets in repair, in-use status, locations, device types, ticket activity, and warranty expiration. You can filter reports by asset type, status, location, and ticket dates to track IT asset management and spot trends faster. The dashboard is available only after you turn on IT asset management.
Analyst copilot features a prebuilt IT asset dashboard that presents important information about the assets you manage all in one place. For example, you can use the dashboard to display available assets, assets being repaired, asset location, and tickets opened for each asset.
This article contains the following topics:
Related articles:
Accessing the IT asset dashboard
You can access the IT asset dashboard from the analyst copilot home page using the following procedure:
To access the IT asset dashboard
- In Analytics, click the analyst copilot
icon (
 ).
). - On the analyst copilot home page, search for, then click IT asset
dashboard.
The dashboard opens on the IT assets tab.
Understanding the IT asset dashboard reports
The IT asset dashboard contains the following tabs:
- IT assets: Contains information about the IT assets you own, their status, and their location.
All reports can be filtered by asset type (for example, desktop or mobile device), status, (for example, available or in repair), location, ticket status, and ticket created date.

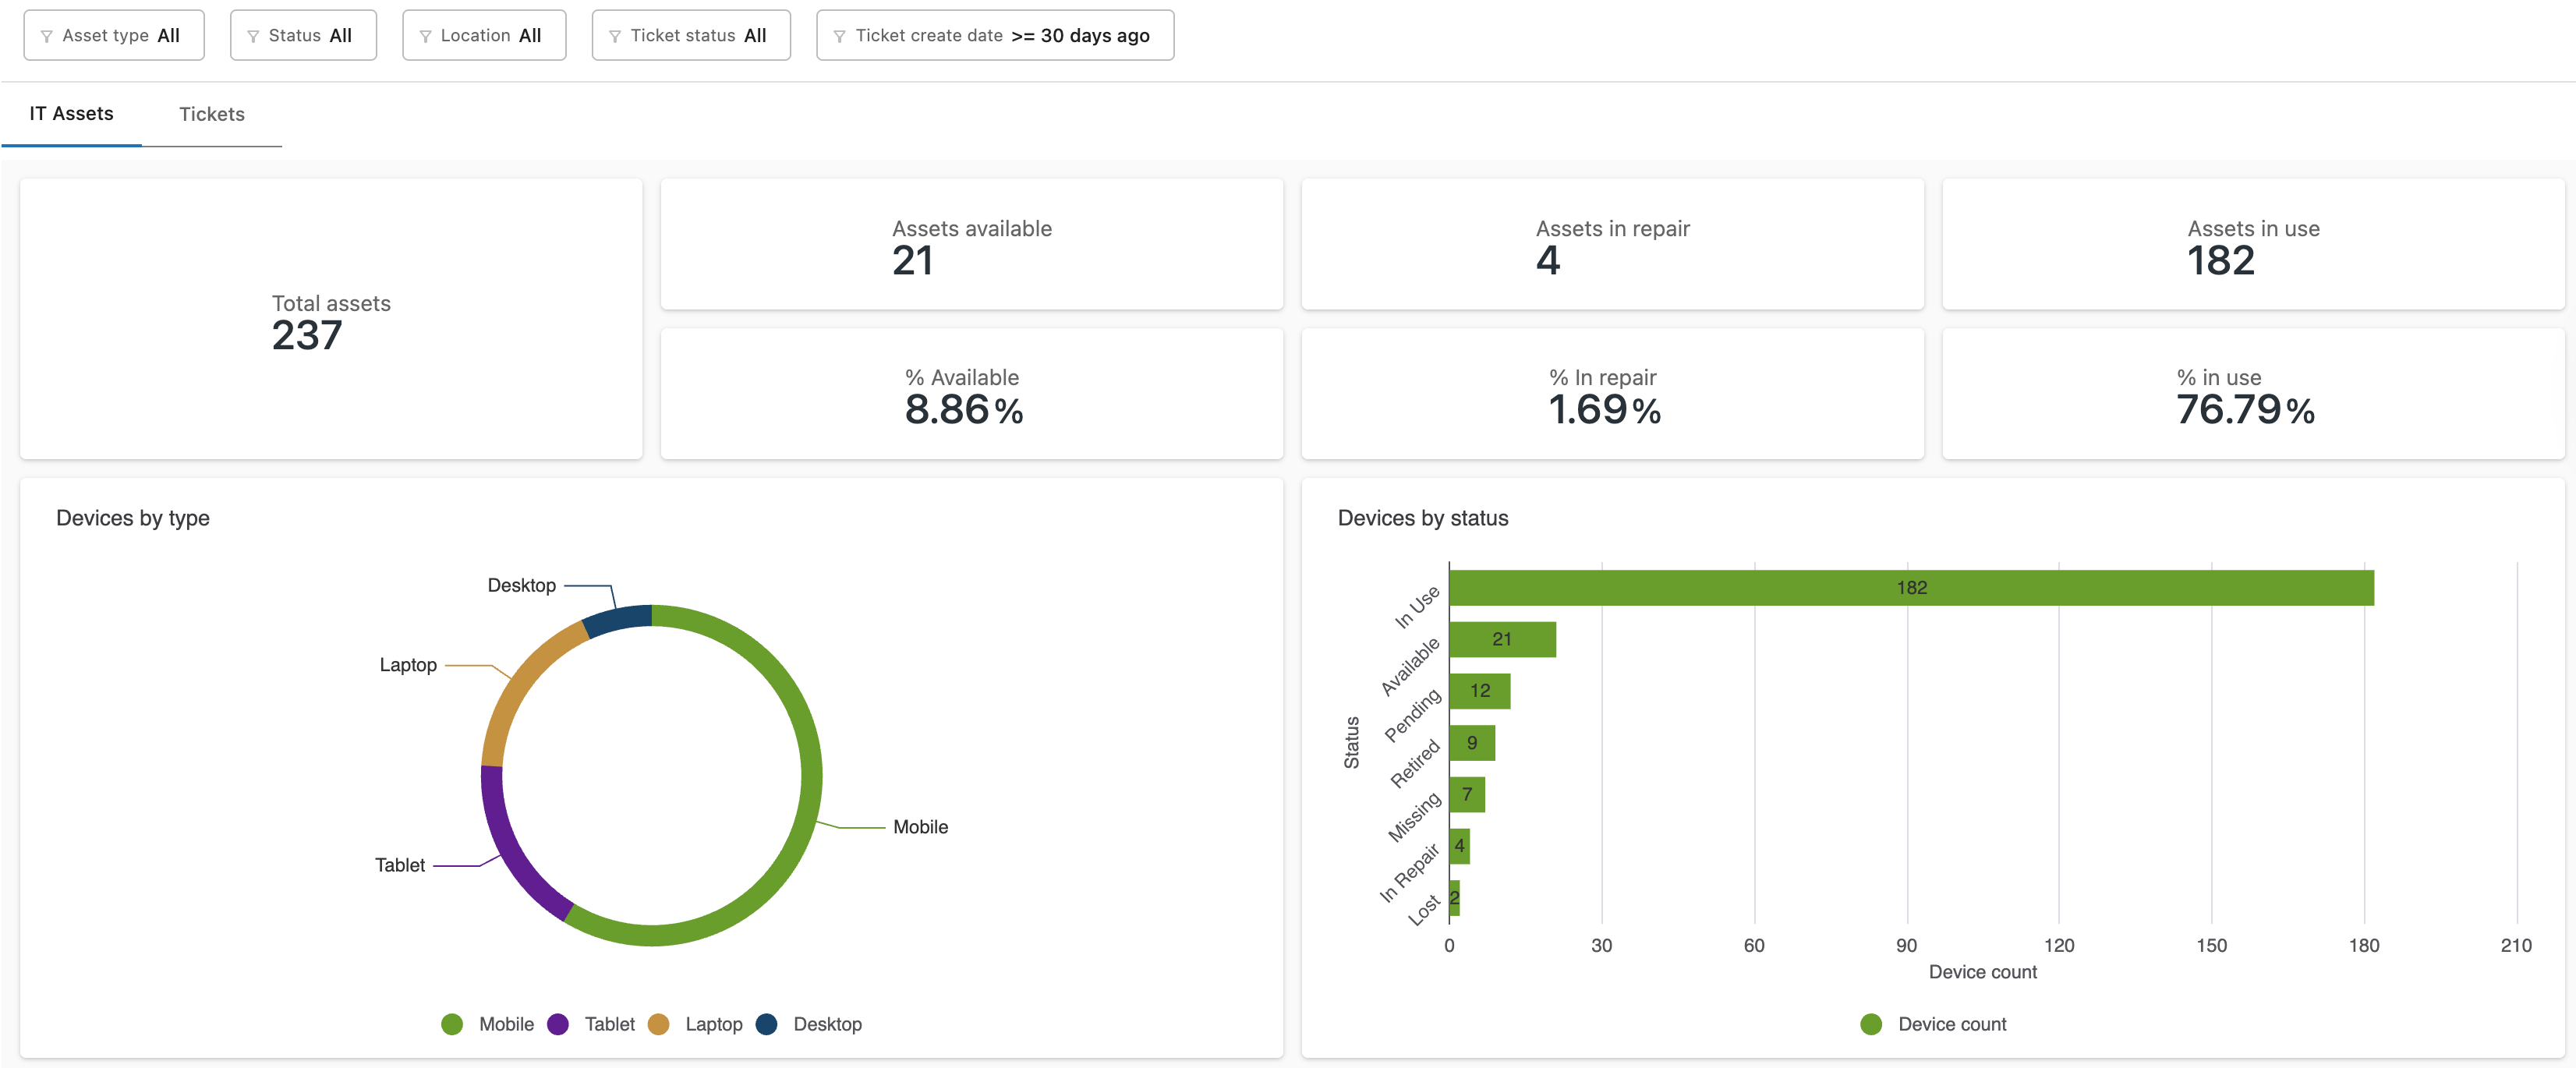
Understanding the IT assets tab
The IT assets tab contains information about the assets you own, their status, and their location.
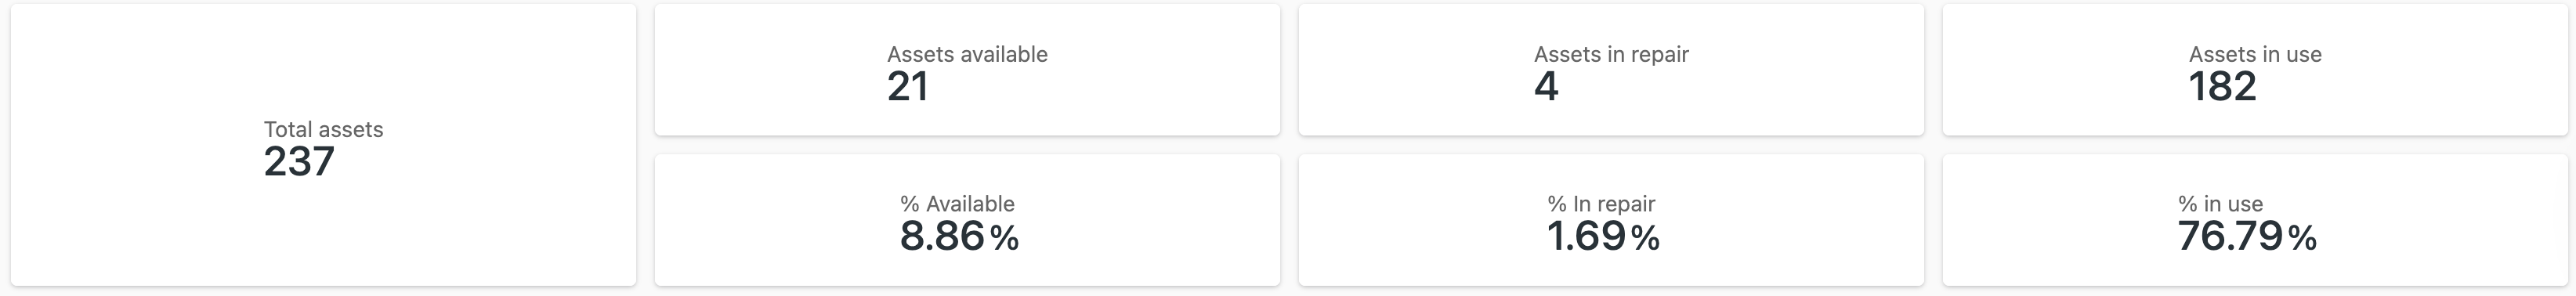
IT assets tab headline metrics
The IT assets tab contains the following headline metrics (KPIs):
- Total assets: Displays the total number of assets in your account.
- Assets available: Displays the number of assets that are currently available for use.
- % available: Displays the percentage of your total assets that are currently available for use.
- Assets in repair: Displays the number of assets that are currently being repaired.
- % in repair: Displays the percentage of your total assets that are currently being repaired.
- Assets in use: Displays the number of assets that are currently being used.
- % in use: Displays the percentage of your total assets that are currently being used.
IT assets tab reports
The IT assets tab contains the following reports:
-
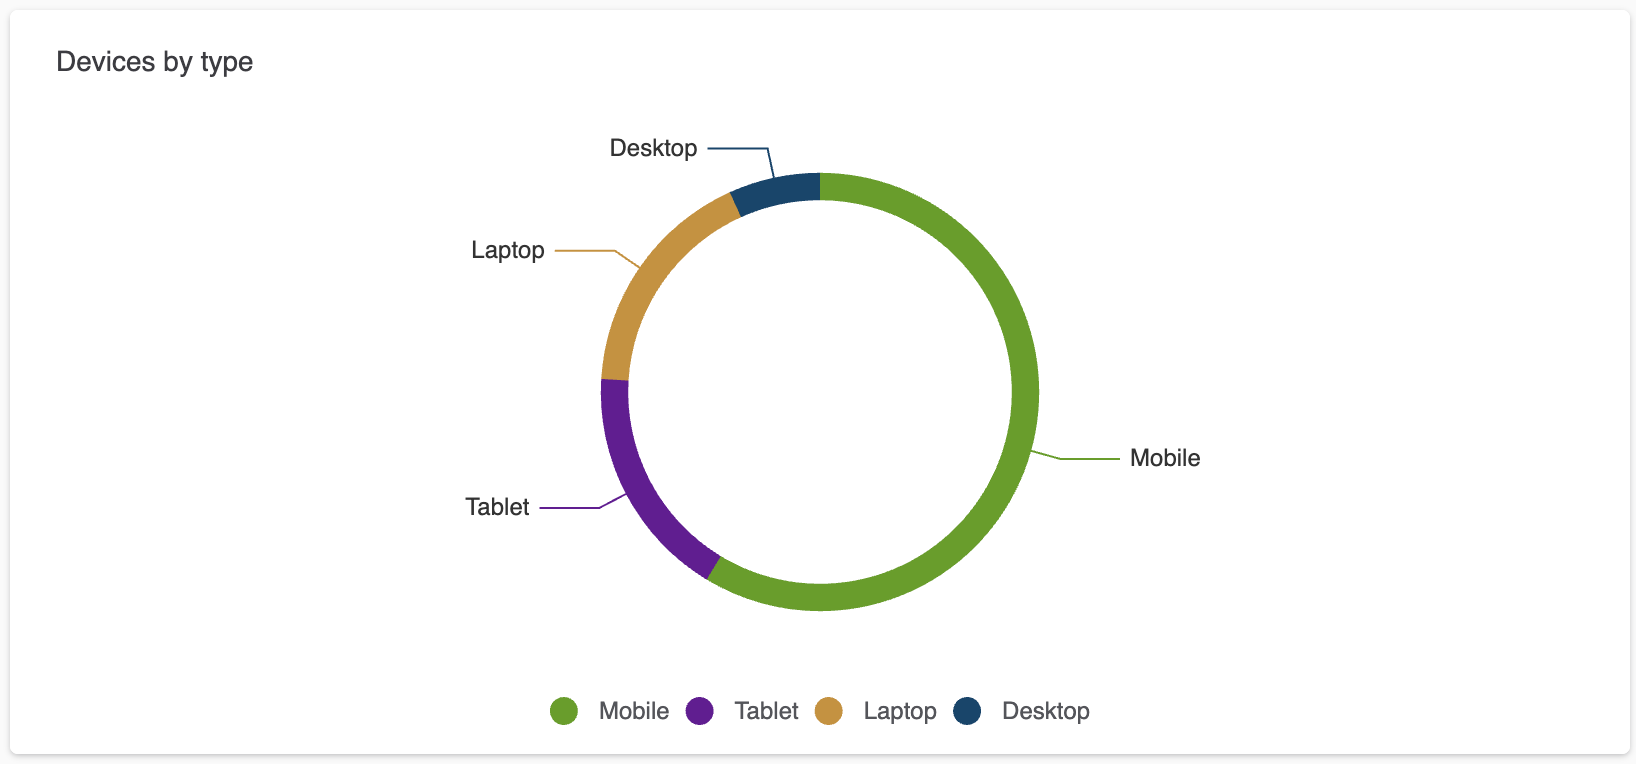
Devices by type: A donut chart showing the various device types
you own, for example, desktop and laptop computers, or mobile
devices.
-
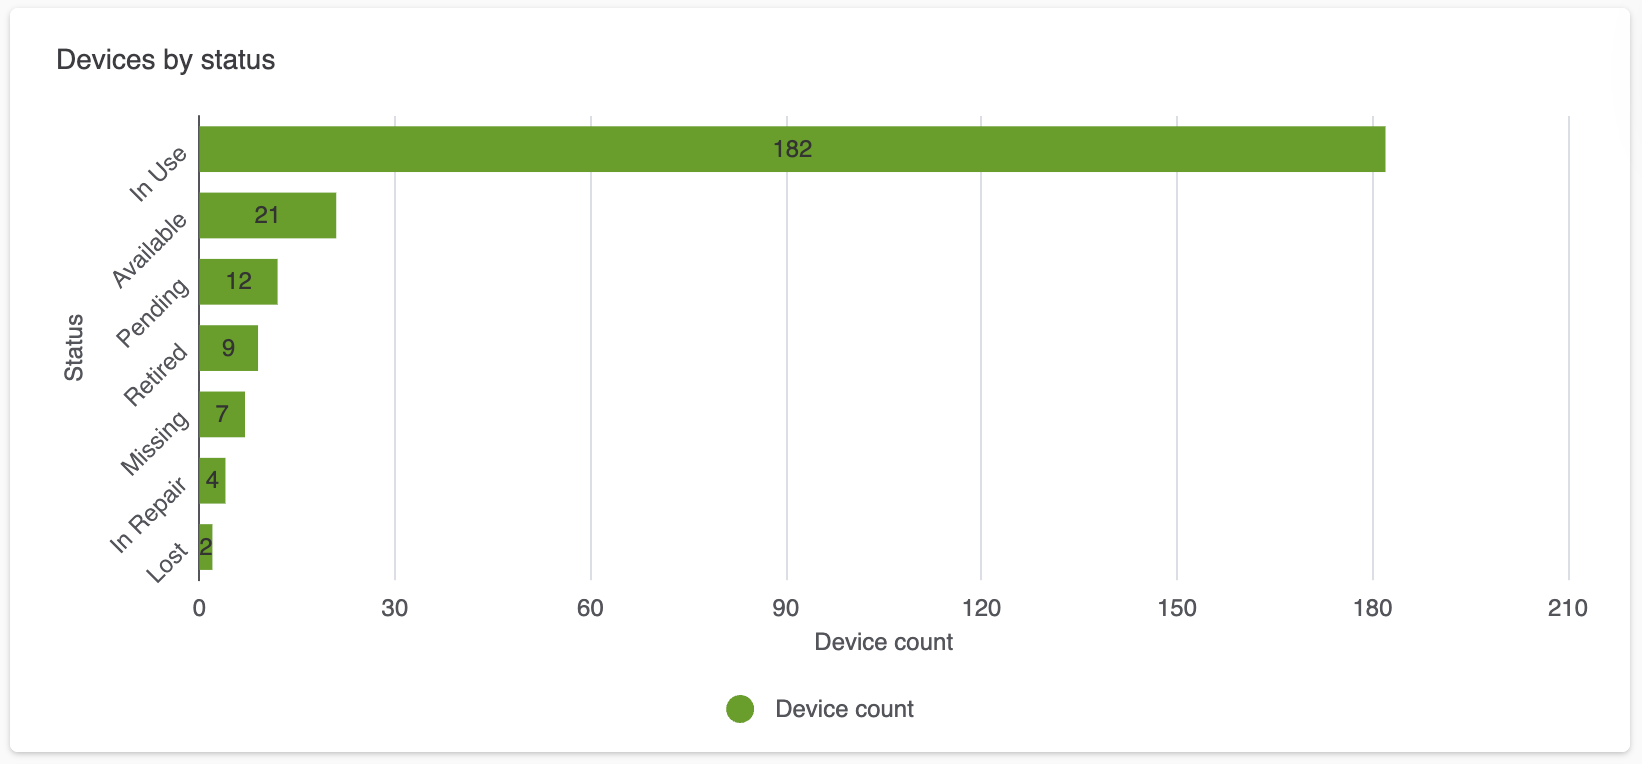
Devices by status: A bar chart showing the status of each item
you own, for example, in use, available, or lost.
-
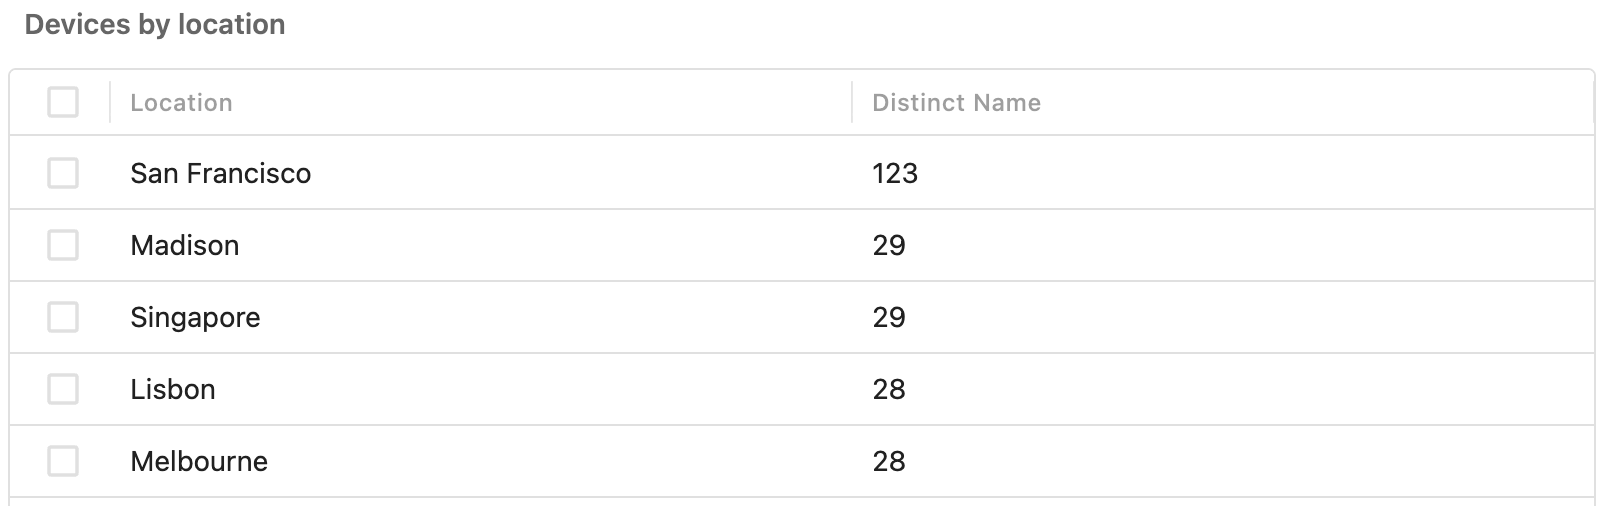
Devices by location: A table showing the number of devices in
each location you manage.
-
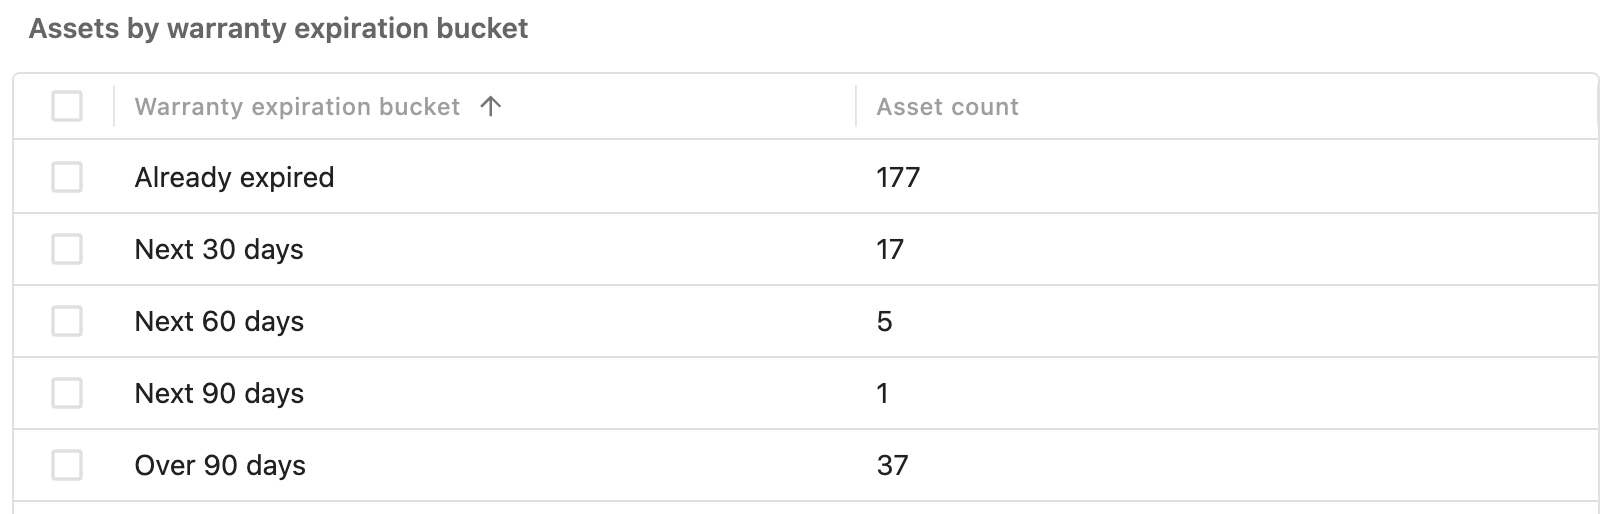
Assets by warranty expiration bucket: A table that buckets your
assets based on when their warranty expires.