Quality score is an AI-powered feature that automatically evaluates the quality of your customer service interactions. It analyzes solved tickets and provides an overall quality score based on multiple components, helping you understand and improve your customer service performance.
This article contains the following topics:
Accessing the quality score dashboard
You can access the quality score dashboard from the analyst copilot home page using the following procedure:
To access the quality score dashboard
- In Analytics, click the analyst copilot
icon (
 ).
). - On the analyst copilot home page, search for, then click Quality
score.
The dashboard opens.
Understanding the quality score dashboard reports
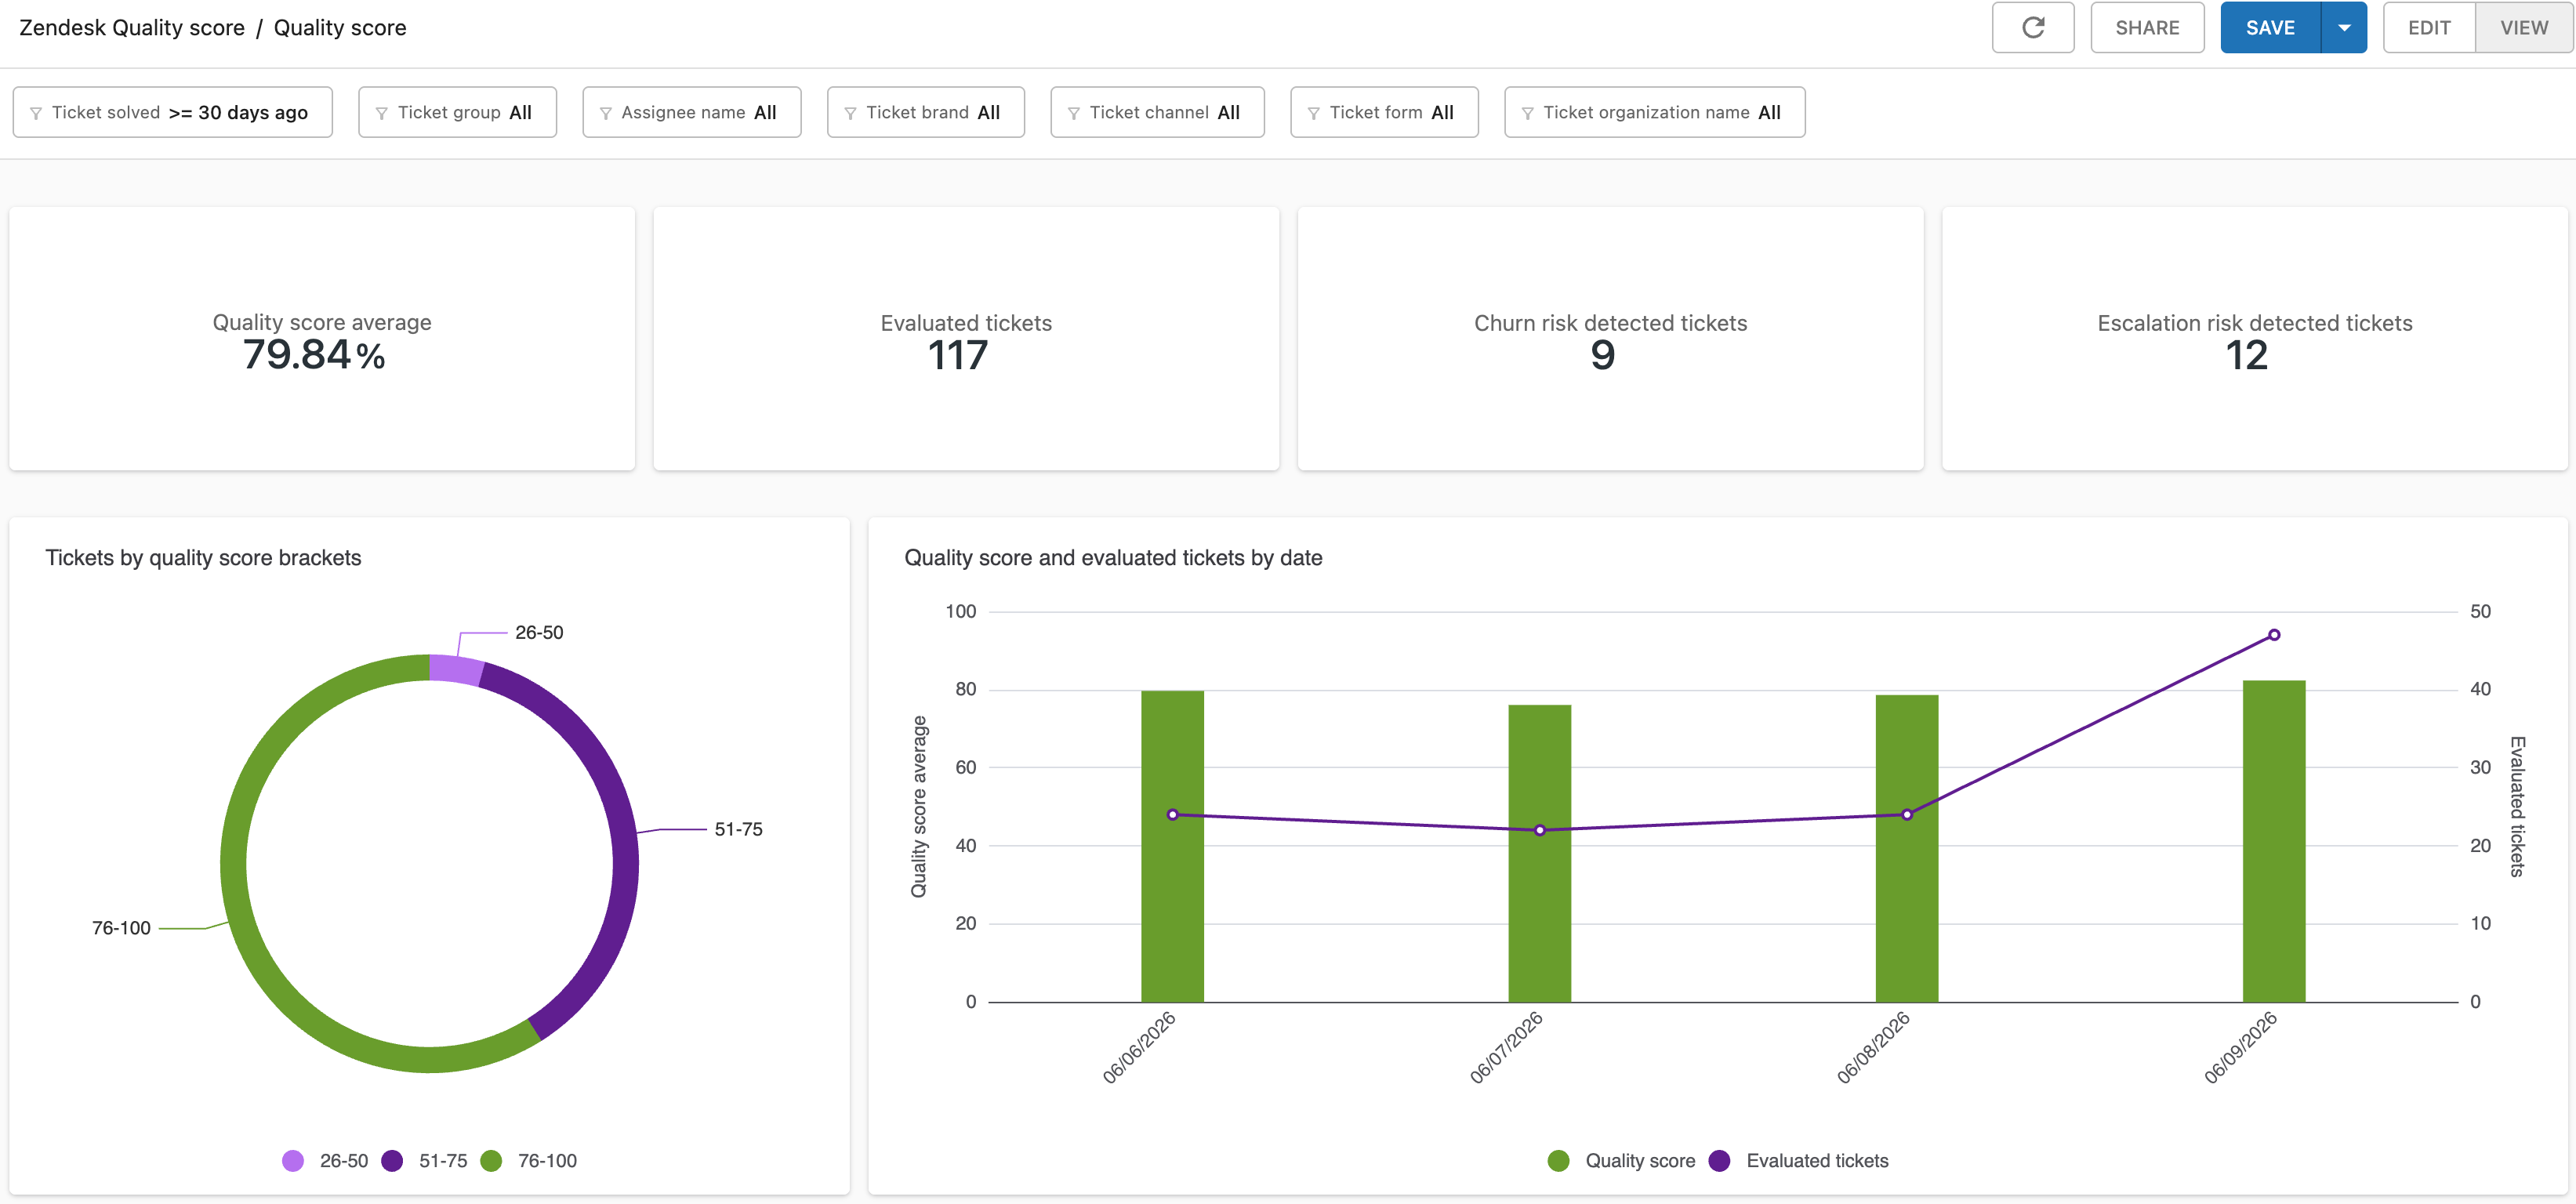
The quality score dashboard contains one tab. The reports can be filtered by ticket solved time, ticket group, assignee name, ticket brand, ticket channel, ticket form, and ticket organization name.
Quality score headline metrics
The quality score dashboard contains the following headline metrics (KPIs):
- Quality score average: The average quality score across all of your tickets.
- Evaluated solved tickets: The number of solved tickets that have been evaluated for quality score.
- Solved tickets: The total number of solved tickets.
- Churn risk detected tickets: The number of tickets where the customer threatened to cancel, stop using the service, or seek alternatives
- Escalation risk detected tickets: The number of tickets where the customer requested to speak with a manager or threatened external action such as legal or regulatory complaints.

Quality score reports
The quality score dashboard contains the following reports:
-
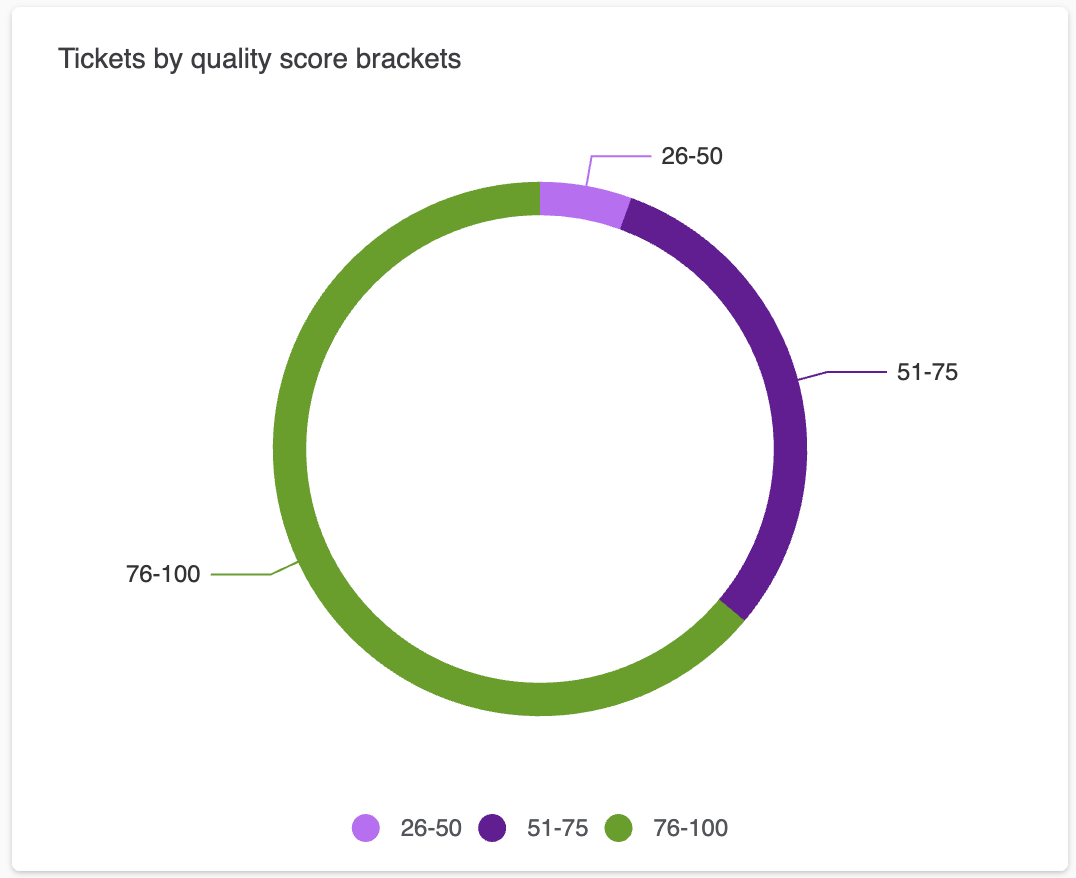
Tickets by quality score brackets: A donut chart displaying a
bracketed view of your quality scores.
-
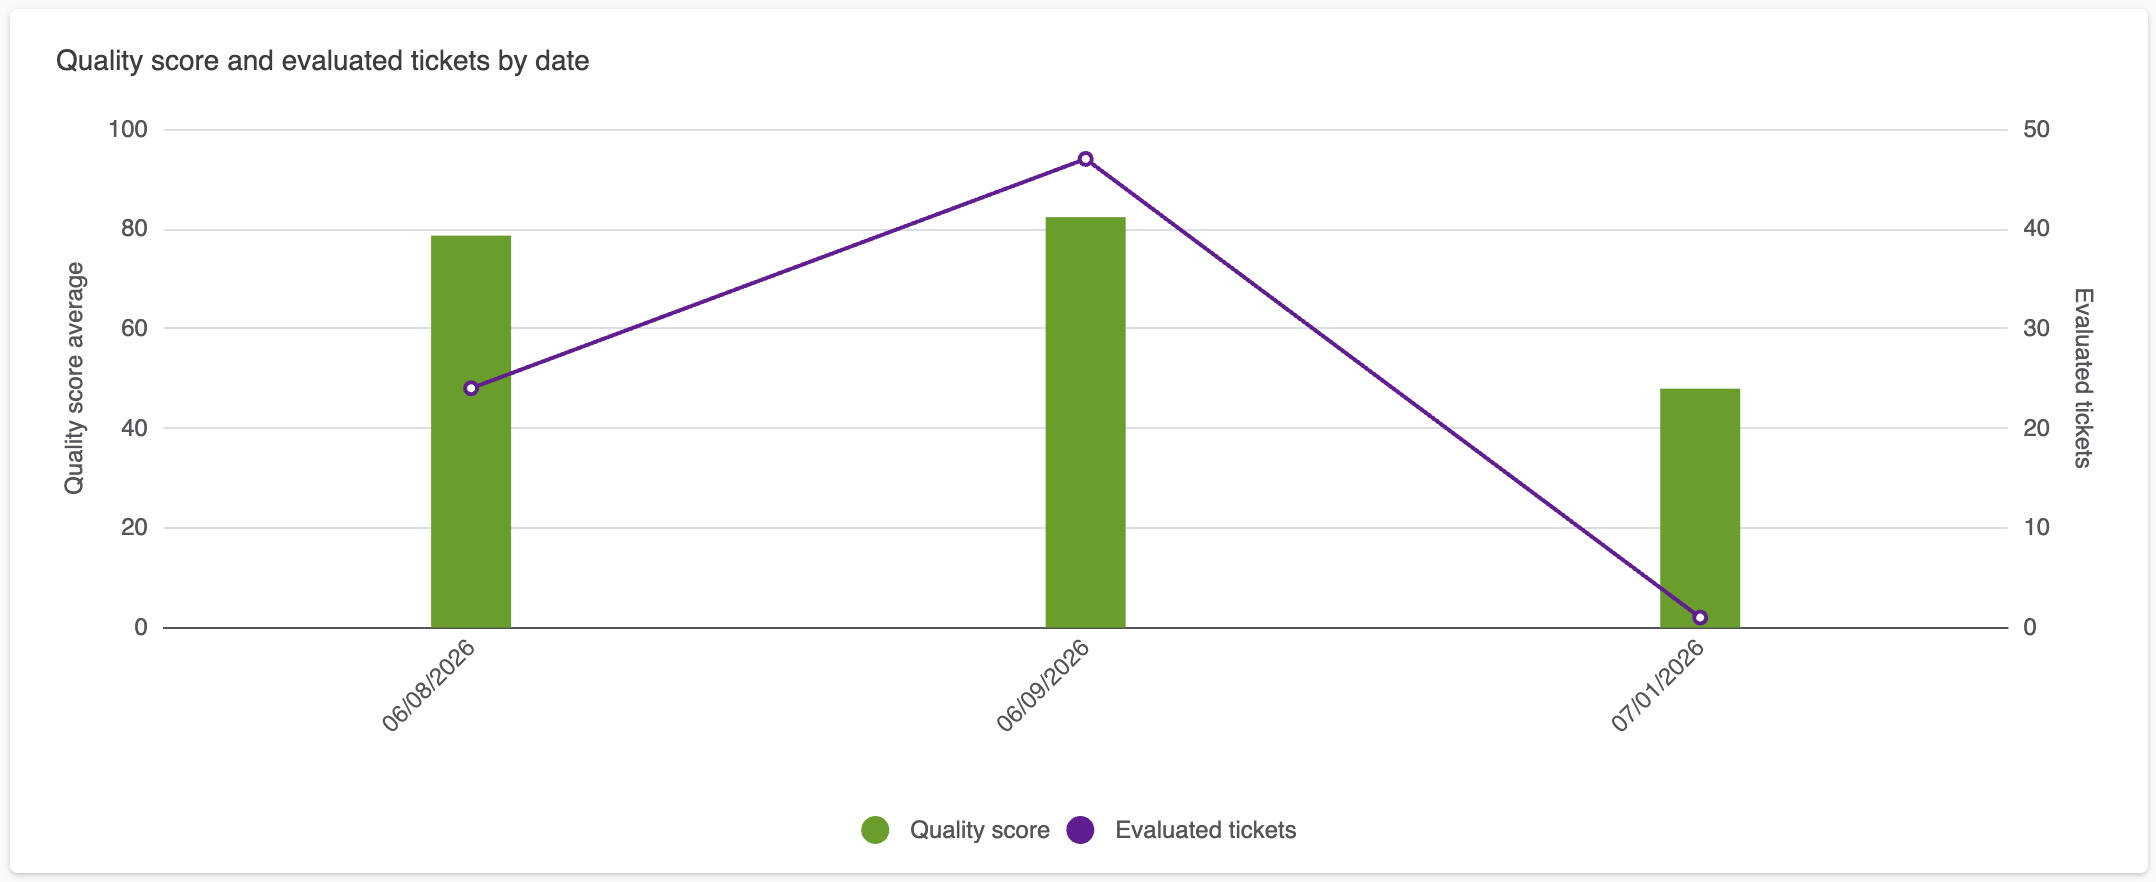
Quality score and evaluated tickets by date: A combo chart displaying
your average quality score against the number of evaluated tickets.
-
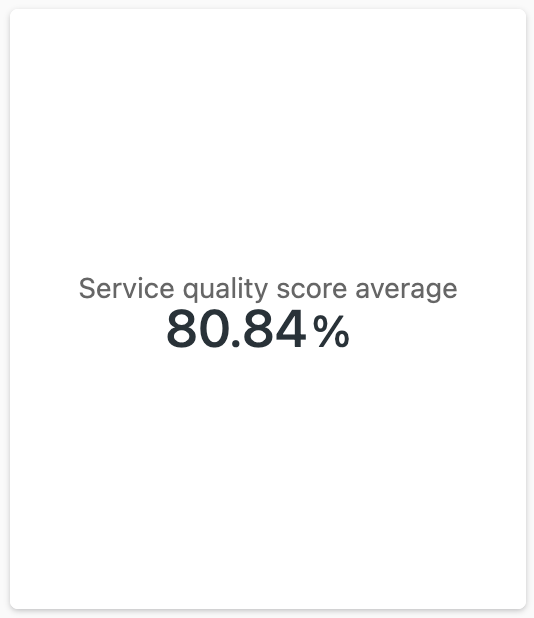
Service quality score average: A KPI displaying your average service
quality score.
-
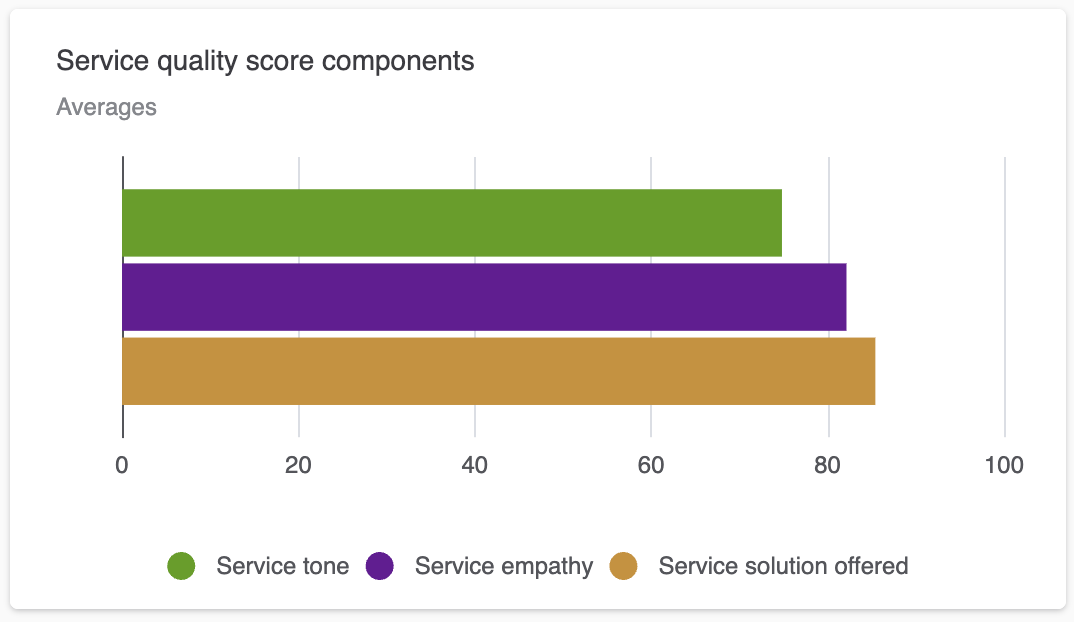
Service quality score components: A bar chart displaying average
service tone, empathy, and solution offered.
-
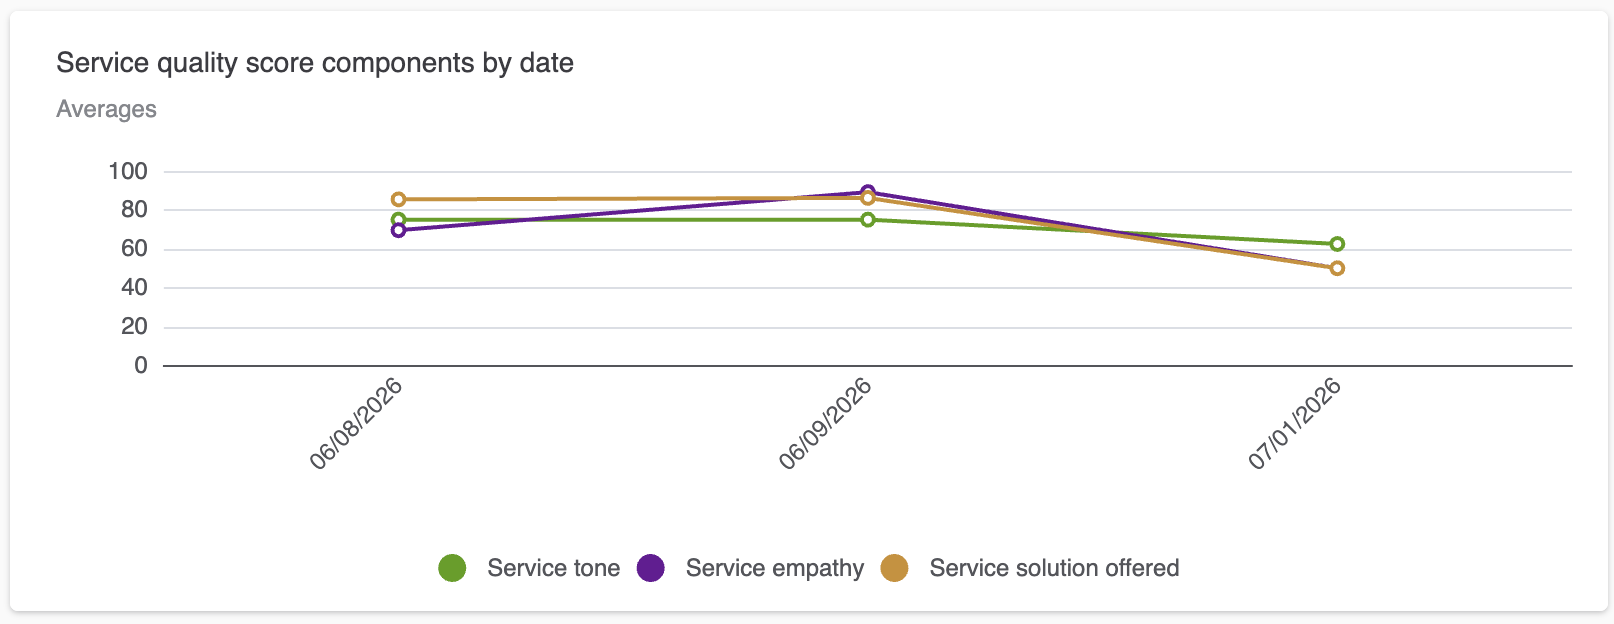
Service quality score components by date: A line chart displaying
service tone, empathy, and solution offered over the date range you
specify.
-
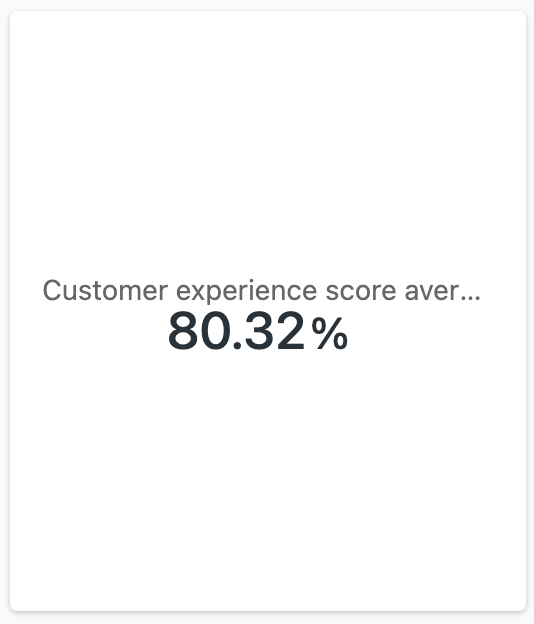
Customer experience score average: A KPI displaying your average
customer experience score.
-
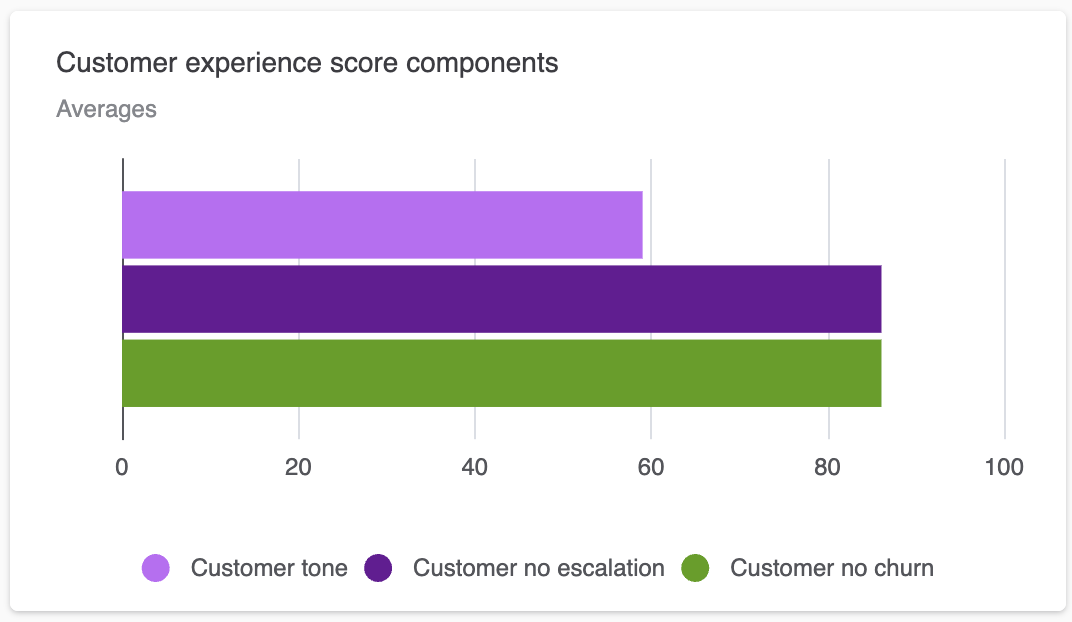
Customer experience score components: A bar chart displaying the
average customer tone, customers with no escalations, and customers with no
churn.
-
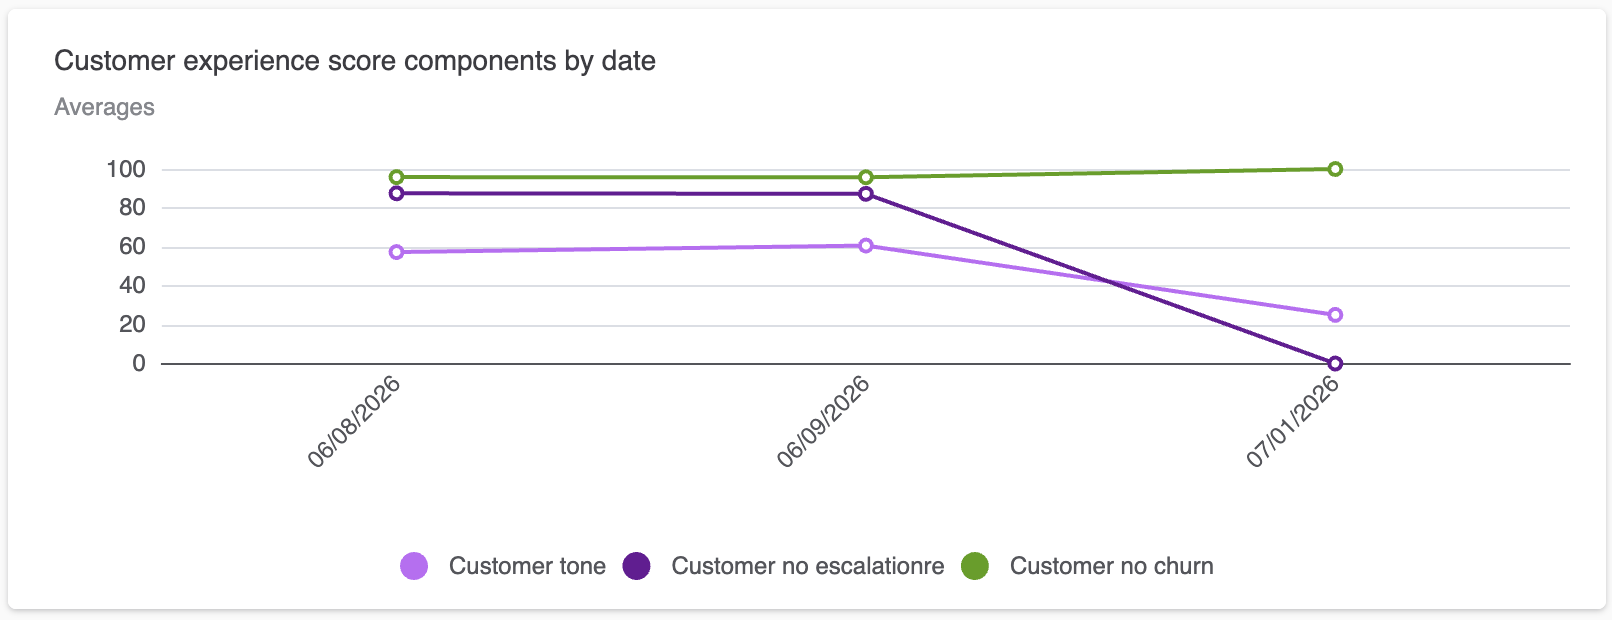
Customer experience score components by date: A line chart displaying
the average customer tone, customers with no escalations, and customers with
no churn over the date range you specify.
-
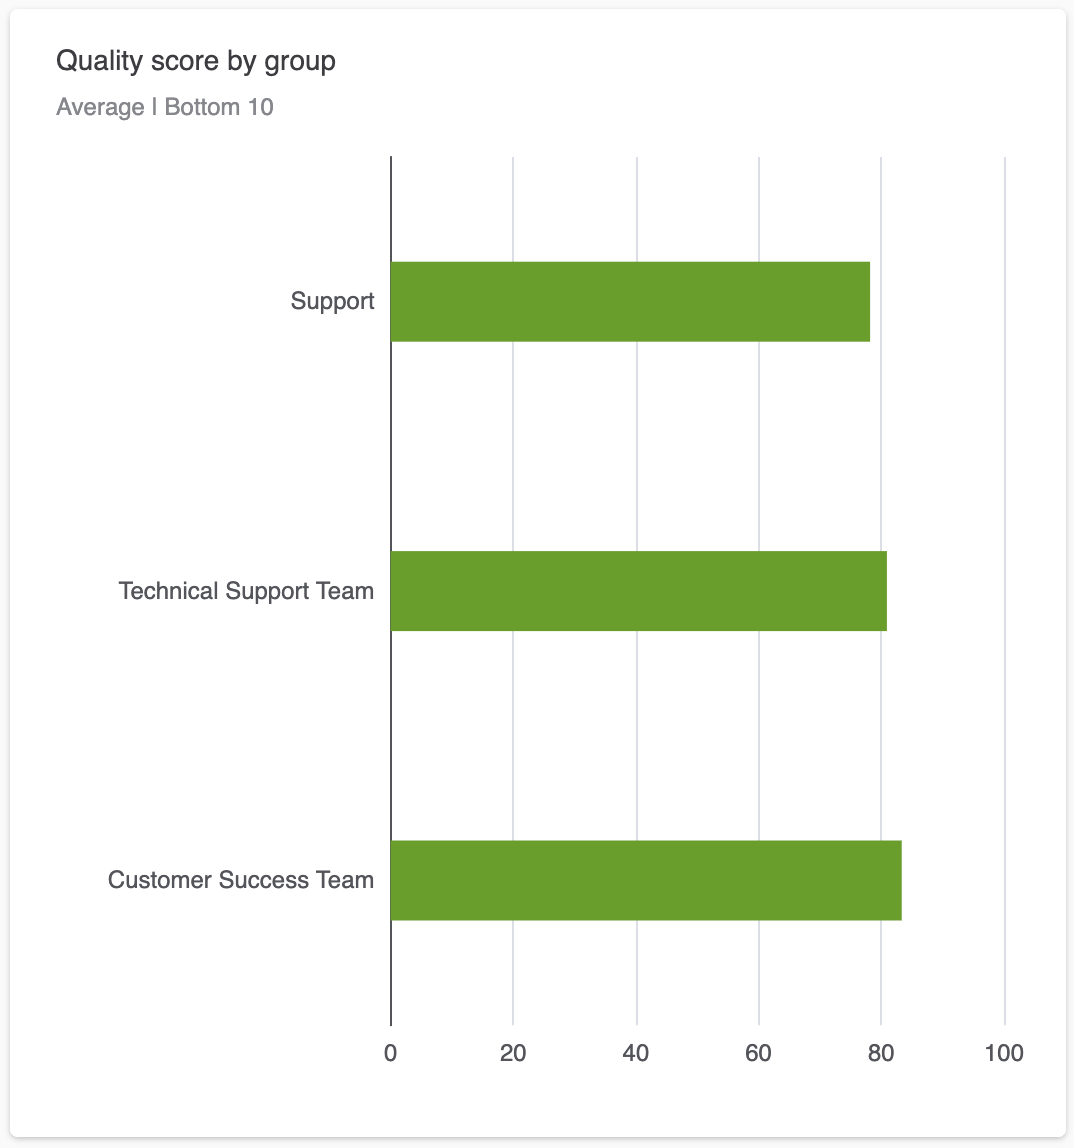
Quality score by group: A bar chart displaying the bottom ten average
group quality scores.
-
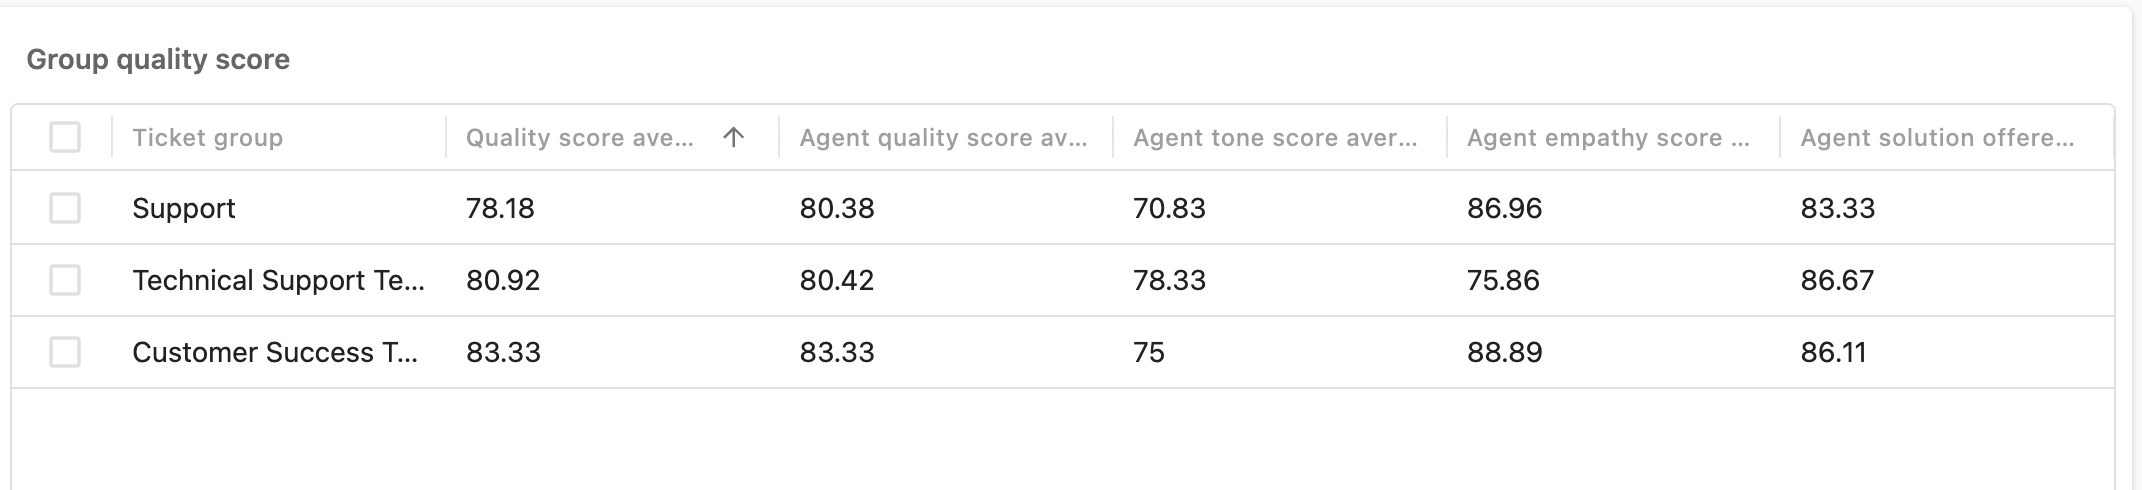
Group quality score: A table displaying detailed quality score
information for each of your groups.
-
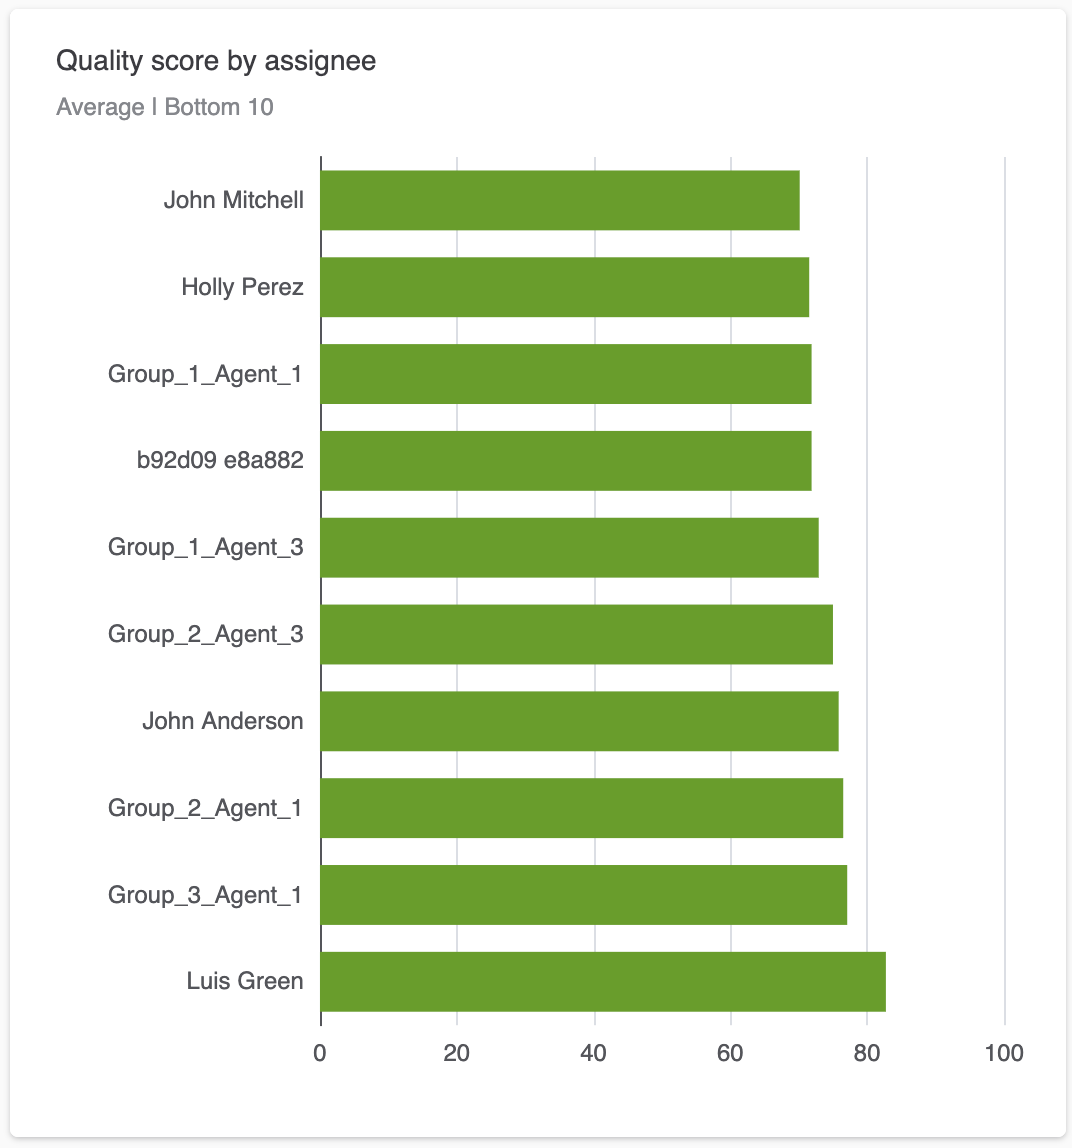
Quality score by assignee: A bar chart displaying the bottom ten
average assignee quality scores.
-
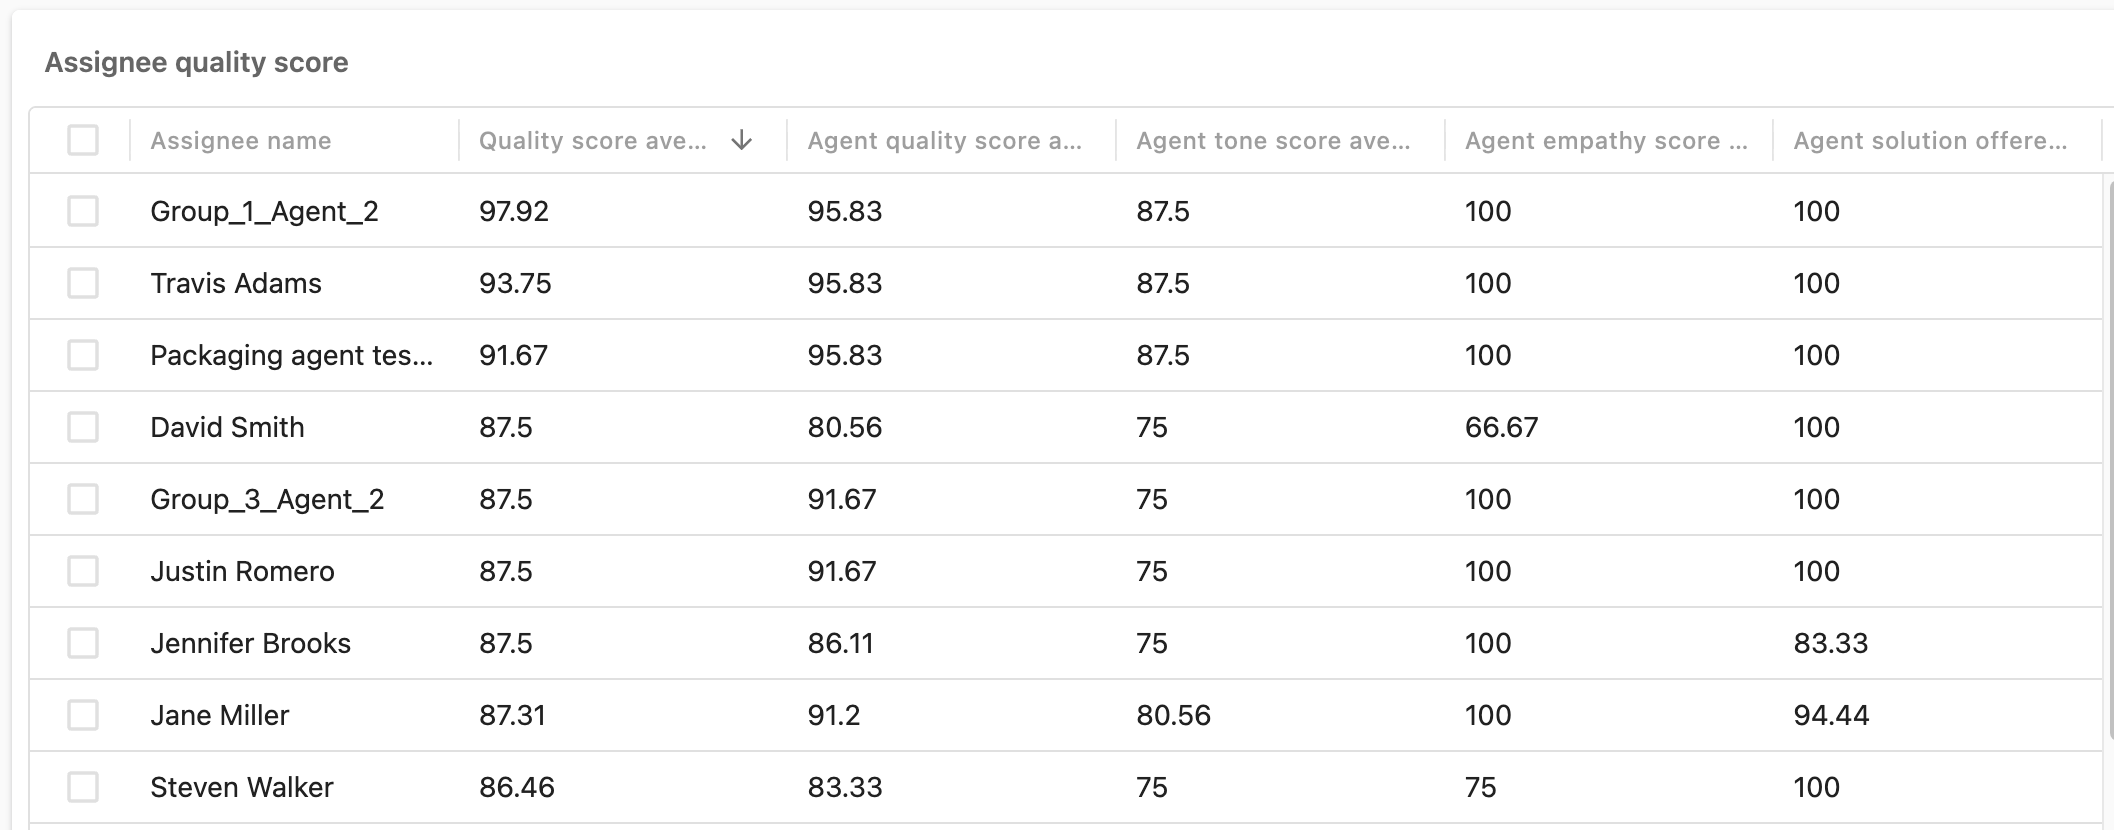
Assignee quality score: A table displaying quality score information
for each of your ticket assignees.
-
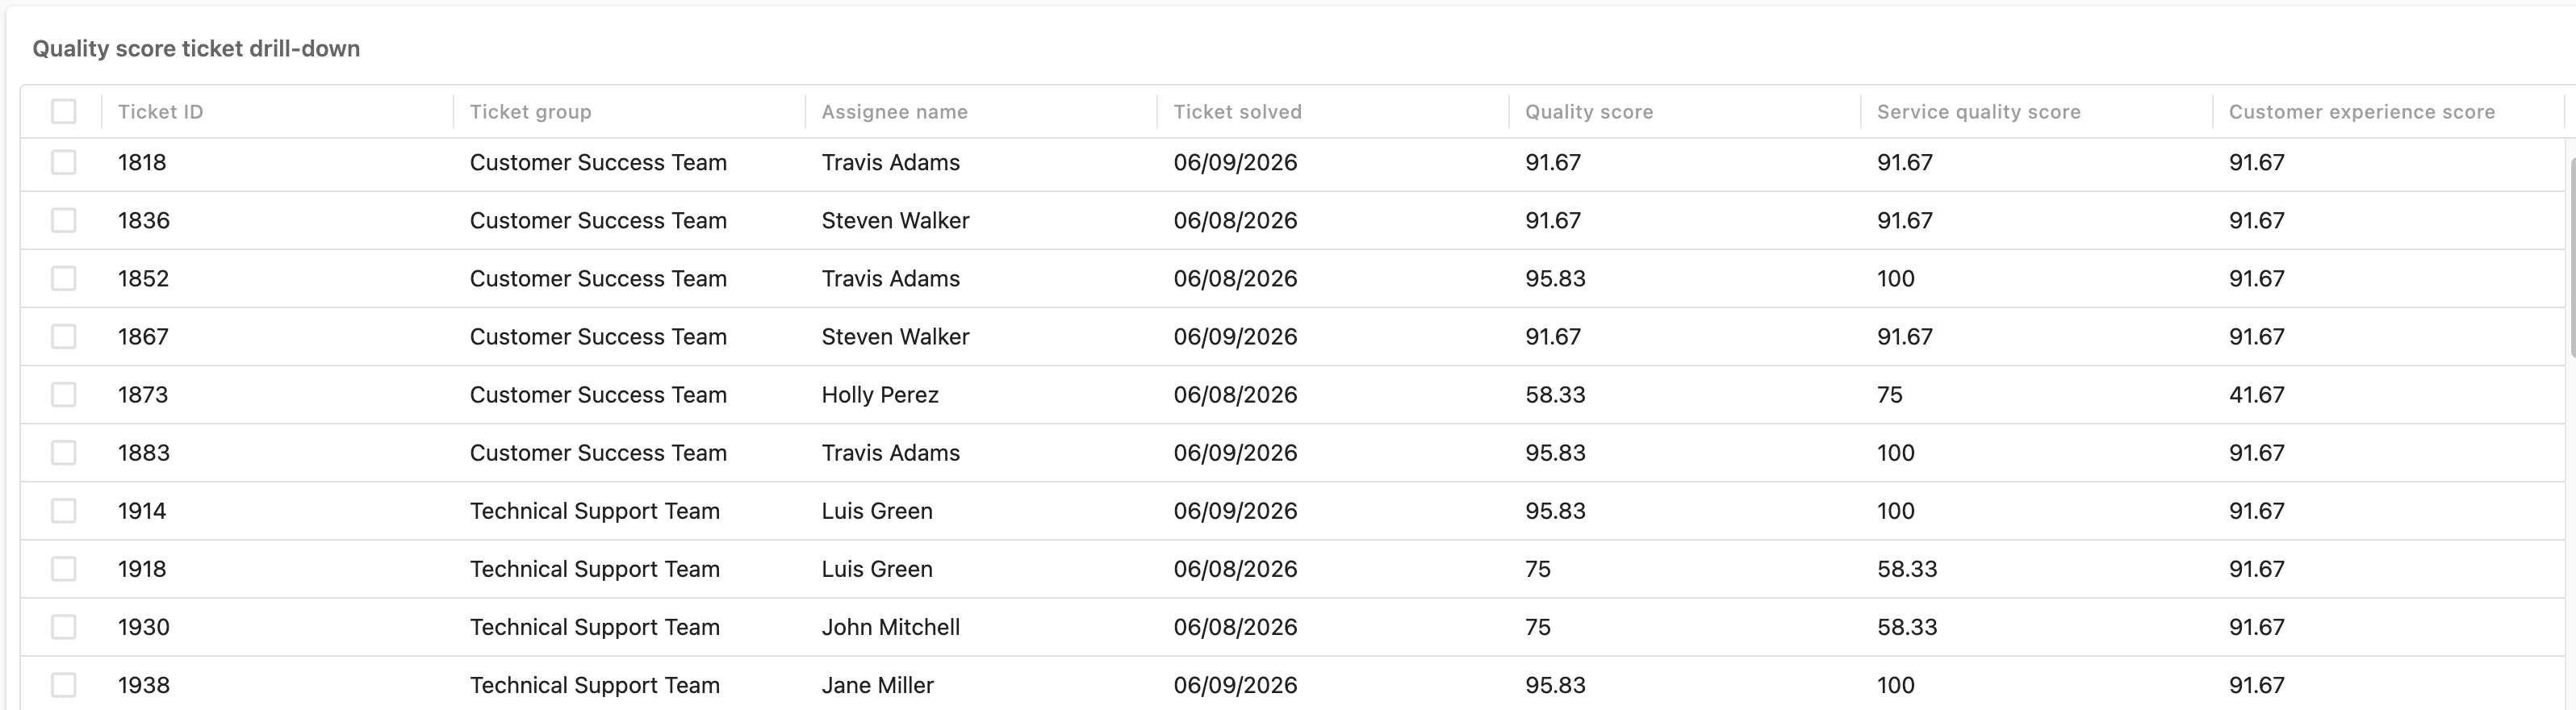
Quality score ticket drill-down: A table displaying detailed quality
score information for each of your tickets.