In this Explore recipe, you'll learn how to create a query that shows your daily ticket activity over the last 30 days. This includes tickets created, reopened, solved and deleted. This helps you get an indication of ticket volume.
What you'll need
Skill level: Moderate
Time Required: 25 minutes
- Zendesk Explore Professional or Enterprise
- Editor or Admin permissions (see Giving agents access to Explore)
- Ticket data in Zendesk Support
Creating the query
To create the query
- In Zendesk Explore, click the query (
) icon.
- In the Queries Library, click New query.
- On the Choose a dataset page, click Support > Ticket updates > Support: Ticket Updates, then click New query. Query builder opens.
- Next, set up some custom Standard calculated metrics to show the solved and deleted ticket updates as negative results. This makes the query easier to picture in terms of tickets in (created and reopened) and tickets out (solves and deletions). Click Calculations (
), then click Standard calculated metric.
-
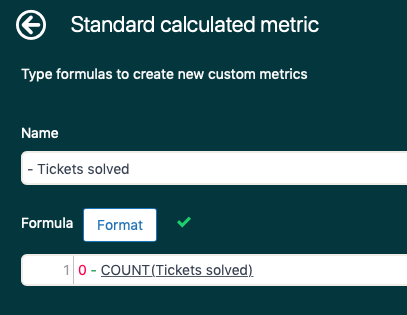
Create two standard calculated metrics by copying the formulas below into each metric. Name the metrics - Tickets solved and - Deletions. They will look like the screenshots below. Click Save after you create each metric.
0 - COUNT(Tickets solved)
0 - COUNT(Deletions)
For the - Deletions metric, ensure you also check the box to Compute separately.
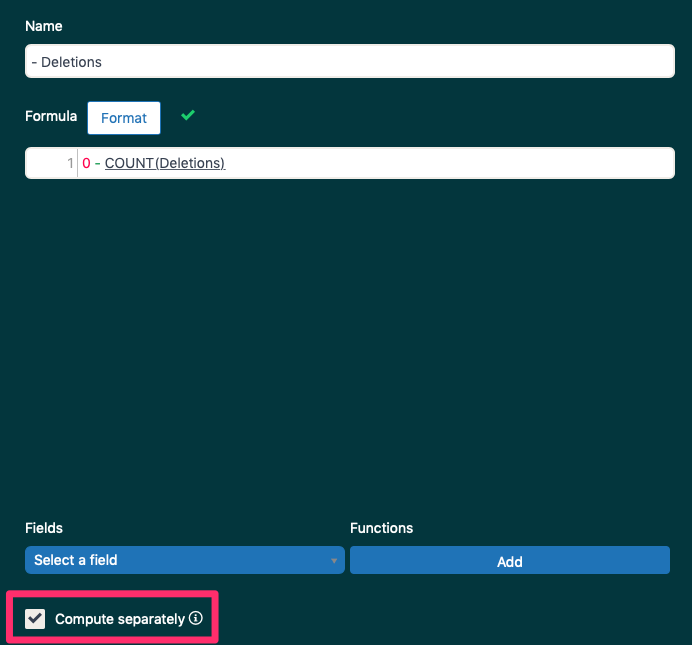
Tip: If you're working in a language other than English, read this article to help you enter Explore formulas in your language. - In the Metrics panel, click Add.
- From the list of metrics, choose Tickets > Tickets created and Tickets reopened, then click Apply.
- From the same list of metrics, choose Calculated metrics, click the two custom metrics you created, - Tickets solved and - Deletions, then click Apply.
- Ensure the metric aggregators for your custom metrics are set to COUNT. For more information, see Choosing metric aggregators.
- In the Columns panel, click Add.
- From the list of attributes, choose Time - Ticket update > Update - Date, then click Apply.
- In the Filters panel, click Add.
- From the list of attributes, choose Time - Ticket update > Update - Date, then click Apply.
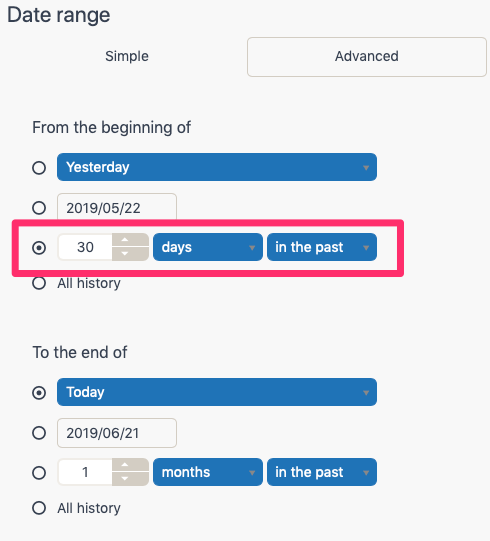
- In the Filters panel, click the filter you just added, click Edit date ranges, and open the Advanced tab. Set the date range to the last 30 days.
- From the Visualization type (
) menu, choose Column.
- From the Chart configuration (
) menu, click Displayed values.
-
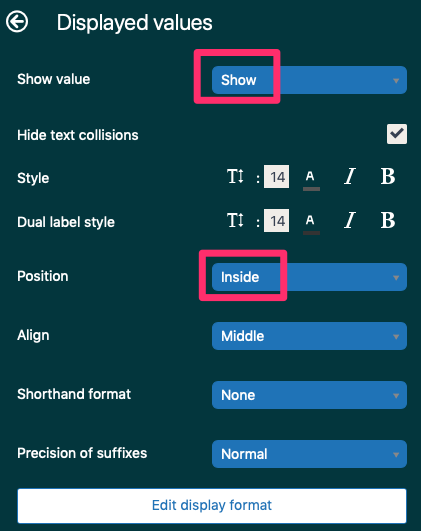
On the Displayed values page, change Show value to Show and Position to Inside.
- From the Chart configuration (
), click Chart.
-
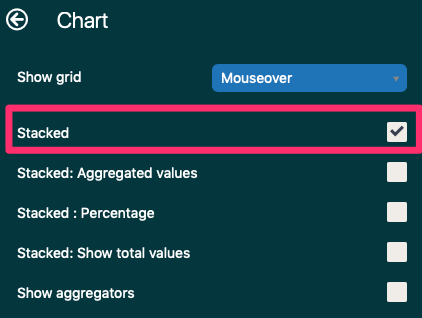
On the Chart menu. enable Stacked. Ensure that all other options are not enabled.
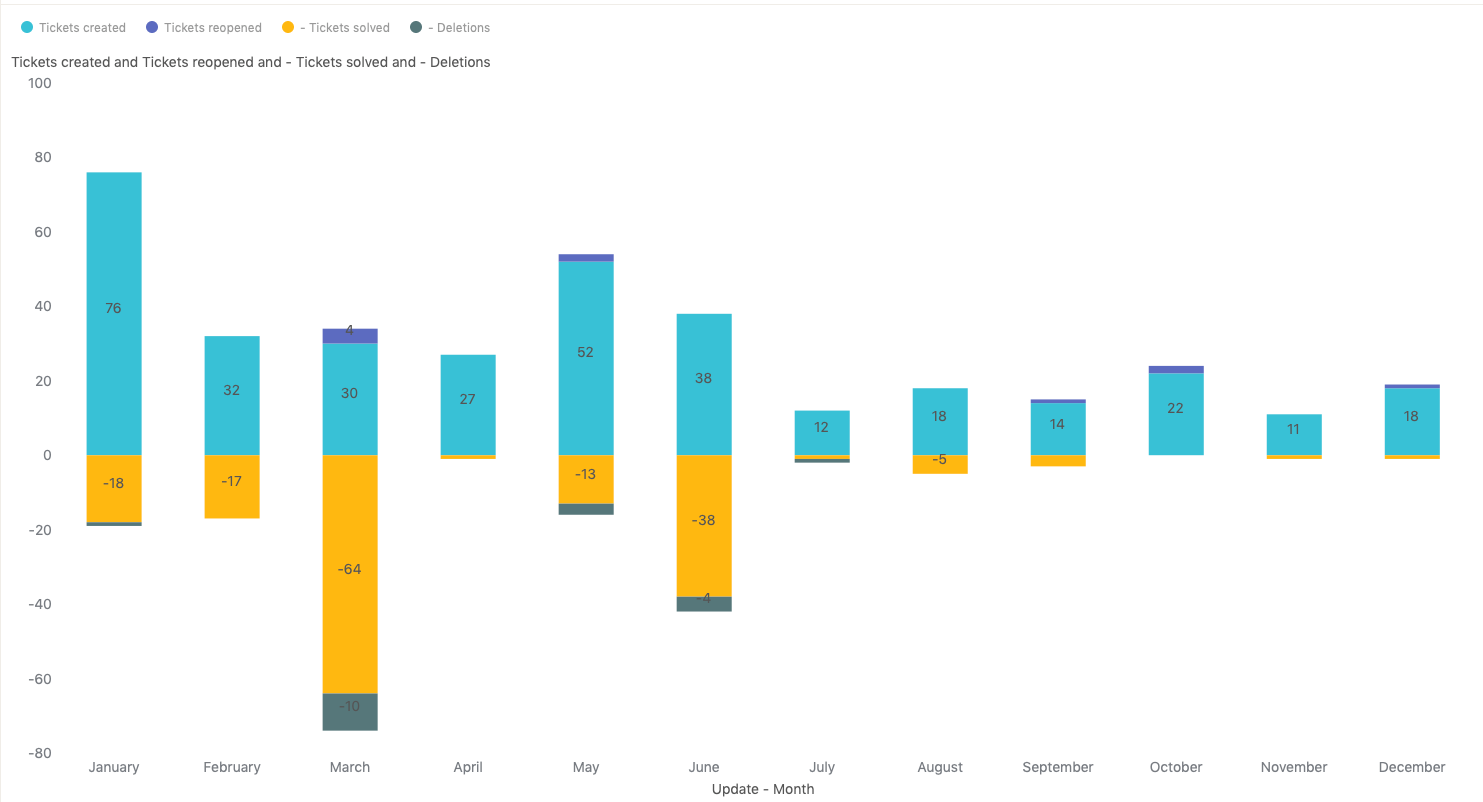
The the query is complete. See an example below in the screenshot. (Note that in the example the date filter is showing the results by month rather than the last 30 days. Check out Editing dates and date ranges for more information on changing the date filter on this report.)
12 Comments
This was really helpful, thanks Jessica.When I run this (I am ignoring reopens and deletions), I'm showing on almost every day that the same number of tickets created and tickets solved. I know that's not right. Any idea what might be going on? Is running the date range on ticket last update part of the issue?
Really disappointed with these instructions. First, the headings are incorrect. There is no Tickets created- it's just Tickets. Then, Time - Ticket update is actually Time - Ticket last updated. Then, I receive the following message:
Hey Padric,
Thanks for reporting this error! I'm going to create a ticket on your behalf so our Customer Advocacy team can look into this further. They'll most likely need to take a look at the report in question to determine the cause here.
You'll receive an email shortly stating your ticket has been created.
Cheers!
I'm seeing the same error Padric reported earlier. Any updates on getting it fixed, or the article updated?
Yes same for me, is there an update on the potential fix?
Hello Mario Guisado,
Our team, In this case, was able to recreate the Explore recipe without error in our test account when using the Ticket Updates dataset.
However, when we tried to create the same report using the Tickets dataset, we were able to see the same error message.

Can you please confirm you are using the Ticket Updates dataset as you build this report? I suspect you accidentally opened the Ticket dataset, but if this isn't the case, let us know, and we'd be happy to troubleshoot this for your further.
Best regards.
You're right - I was able to do it with the Tickets dataset by playing with it a bit. Thanks again!
Hi! Is there a way to include a custom Ticket backlog/tickets unsolved metric in this table? Thanks.
This is frustratingly convoluted and difficult. What's wrong with direct access to a date option?
This particular recipe shows counts. How can one get a list of the tickets updated? (Because of Zendesk's inability to export search results, I was told to try a view or Explore option to end up with the ability to export to CSV or similar.)
Hi Rich Shupe,
Are you after a table of tickets that have been updated within a given time period? If that's the case then you can select 'D_COUNT(Tickets updated)' as your metric and then add 'Update - Date' and 'Ticket ID' to Rows.
You'll then see a list of tickets that have been updated on each date. This can be exported to CSV if needed.
Working on 30 days to make the Monthly average is not accurate, because the number of working days in a month vary.
If you solve 1380 tickets a month. Your average will say 46 tickets a day, but if there are 23 working days in the month. The average number of solved tickets is 60 a day.
Can you advise how you can get accurate figures based on the varying number of working days in a month ?
Also there are some Public holidays to allow for too
Hi Grant!
The days are based on Calendar days so weekends and holidays are included. There isn’t any specific way to filter the query on the rolling Last 30 business days but you can follow this article to filter your queries to exclude time outside of your business hours: Filtering queries by business hours
Same for holidays, they will need to be excluded manually. Few metrics have version in business hours but filtering the dates cannot be done by default to exclude the non-business hours/days.
Thank you!
Jovi Limbo | Associate Premier Support Engineer
Please sign in to leave a comment.