Admins commonly use custom fields to collect information that Zendesk Support doesn't collect by default. For example, you might want to add the office location to a ticket or the product type a ticket is about. Explore collects custom field information to enable you to add it to your reports.
In this Explore recipe, you'll learn a useful method to compare the number of tickets created between two time periods. Then, you'll break this number down by the values in a custom field.
This recipe contains the following sections:
What you'll need
Skill level: Easy
Time Required: 10 minutes
- Zendesk Explore Professional or Enterprise
- Editor or Admin permissions (see Adding users to Explore)
- Ticket data in Zendesk Support
How to create the report in Explore
Use the following steps to create this report in Explore.
- In Zendesk Explore, click the reports (
 ) icon.
 - In the Reports library, click New report.
- On the Select a dataset page, click Support > Support - Tickets, then click Start report. The report builder opens.
- Next, you'll create two date range calculated metrics. The first will display the tickets created this month and the second will display tickets created last month. In the Calculations menu (
 ), click Date range calculated metric.
-
On the Date range calculated metric page, configure the following values:
- Name: Tickets created last month
- Original metric: Tickets
- Defined on: Ticket created
- Date range: Simple > Last month
When you're finished, click Save.
-
Using the same steps, create a second date range calculated metric with the following settings:
- Name: Tickets created this month
- Original metric: Tickets
- Defined on: Ticket created
- Date range: Simple > This month
When you're finished, click Save.
- In the Metrics panel of the report builder, click Add.
-
From the list of metrics, expand Calculated metrics and choose the two metrics you just created, Tickets created this month and tickets created last month. Make sure to change the aggregator for both metrics to COUNT. Your report will look similar to this example:
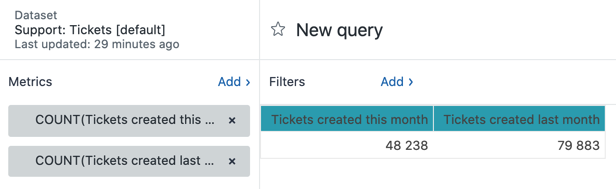 Tip: You can change the two date range calculated metrics to cover any time period you want, for example, this week and last week or this year and last year.
 - Next, create a result metric calculation. This will show the percentage difference between last months tickets and this months tickets. For more help with result metric calculations, see Using result metric calculations. From the result manipulation menu (
 ), click Result metric calculation.
 -
On the Result metric calculation page, click Add a new metric, then configure the following values:
- Name: % Change month
- Formula: (COUNT(Tickets created this month)-COUNT(Tickets created last month))/(COUNT(Tickets created this month))
- Disable the Clear used metrics check box
Tip: If you're working in a language other than English, read this article to help you enter Explore formulas in your language.
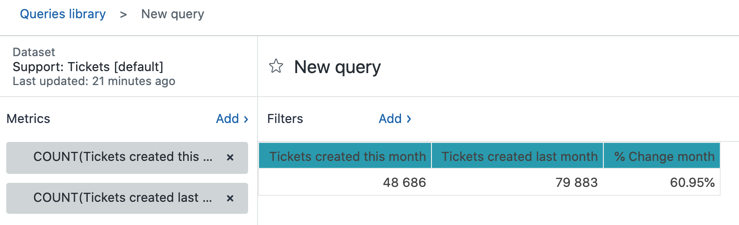
- When you're finished, click Add. Your calculation will look like this example:

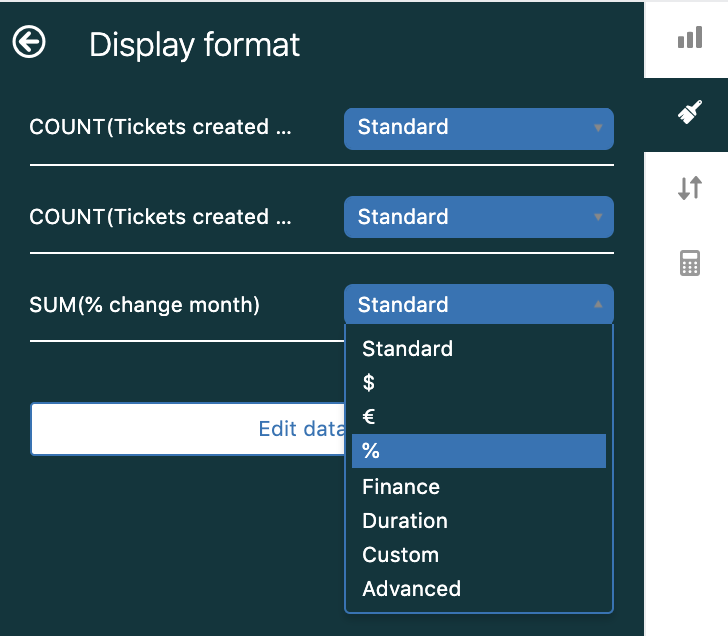
- Now, you need to change the display format of the result metric calculation to display as a percentage. In the report builder, click the chart configuration (
 ) menu, then click Display format.
 - On the Display format page, expand the SUM(% Change month) dropdown, then click %.
- Close the Display format page. Your report will now look similar to this example:
- Finally, we want to break the results down by a custom field. This example uses a custom field named favorite fruit. Custom fields are available as an attribute in Explore. In the Rows panel, click Add.
- From the list of attributes, expand Ticket custom fields, click favorite fruit (or your own custom field attribute), then click Apply. Your report will look similar to the following example: