Verified AI summary ◀▼
The agent productivity real-time dashboard helps you monitor agent performance and efficiency. It includes tabs for agent availability, efficiency, and productivity by brand and group. You can filter reports by various criteria like brand and channel. Use this tool to track metrics such as first reply time, handle time, and tickets solved, aiding in workload management and performance assessment.
The agent productivity dashboard gives you an overview of how your agents and
groups of agents are performing. In any dashboard, you can hide or show the filters by
clicking the filter icon (![]() ). You can click on any agent to navigate to
their agent profile from the dashboard.
). You can click on any agent to navigate to
their agent profile from the dashboard.
This dashboard contains the following tabs:
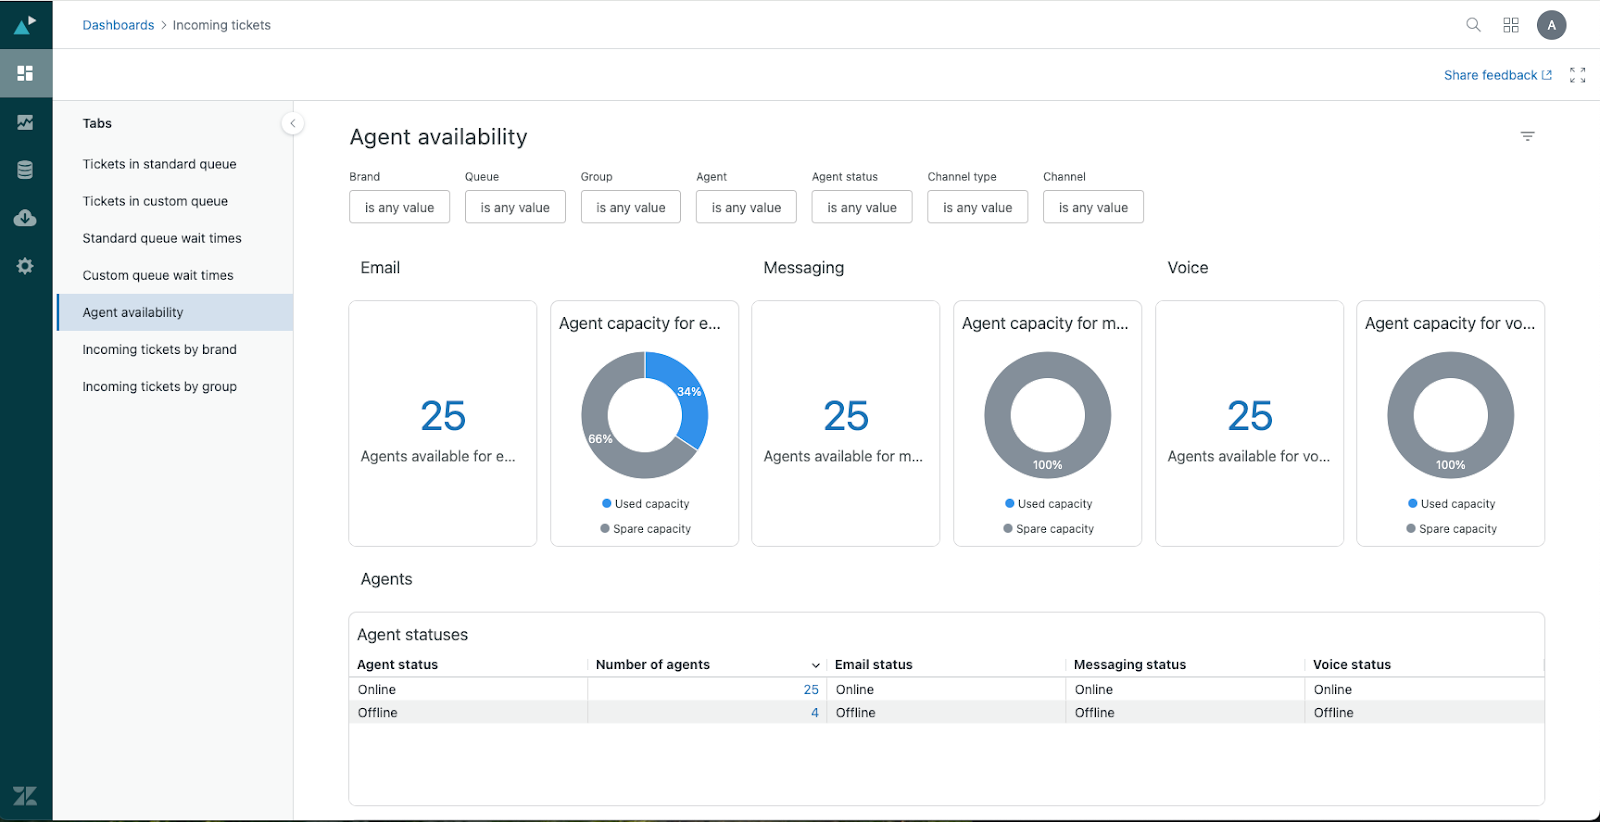
Agent availability
This tab gives you information about your agent’s capacity and availability. The reports can be filtered by brand, group, agent, agent status, channel type, channel and time-agent activity.
The tab contains the following reports:
Real-time reports
- Agents available for email: The number of agents that are available for email support. You can drill into this report to see more details about the available agents.
- Agent capacity for email: A pie chart showing the percentage used capacity. You can use this to infer their spare capacity.
- Agents available for messaging: The number of agents that are available for messaging support. You can drill into this report to see more details about the available agents.
- Agent capacity for messaging: A pie chart showing the percentage used capacity. You can use this to infer their spare capacity.
- Agents available for voice: The number of agents that are available for voice support. You can drill into this report to see more details about the available agents.
- Agent capacity for voice: A pie chart showing the percentage of agents who are already using the voice channel, and how many are available for voice support.
- Agent statuses: A detailed breakdown of your agents showing their status for each channel, email, messaging, and voice. You can click any value under Number of agents to drill-in and see the agents with that status.
- Agent availability and capacity: A detailed breakdown of your agents’ statuses alongside their ticket assignment. You can click the number of tickets assigned to see further detail on the work items assigned.
- Agent availability and capacity in use by group: Similar to the agent availability and capacities report, this table provides an overview by group on agents availability alongside work item assignment. You can click any of the numeric values to drill in to further details.
Recent history reports
- Agents available: The number of agents that are available for email, messaging and voice support over a selected period of time. You can drill into this report to see more details about the available agents at that particular point in time.
- Agent capacity used: The count of agents used capacity over time across email, messaging and voice over a selected period of time. You can drill into this report to see more details about the tickets assigned to the agents at that particular point in time.
- Top 10 agents with most recent status change: This timeline view shows 10 of your agents' most recent status changes and the duration they were in that status for. On hover, you can see the start and end date for the status.
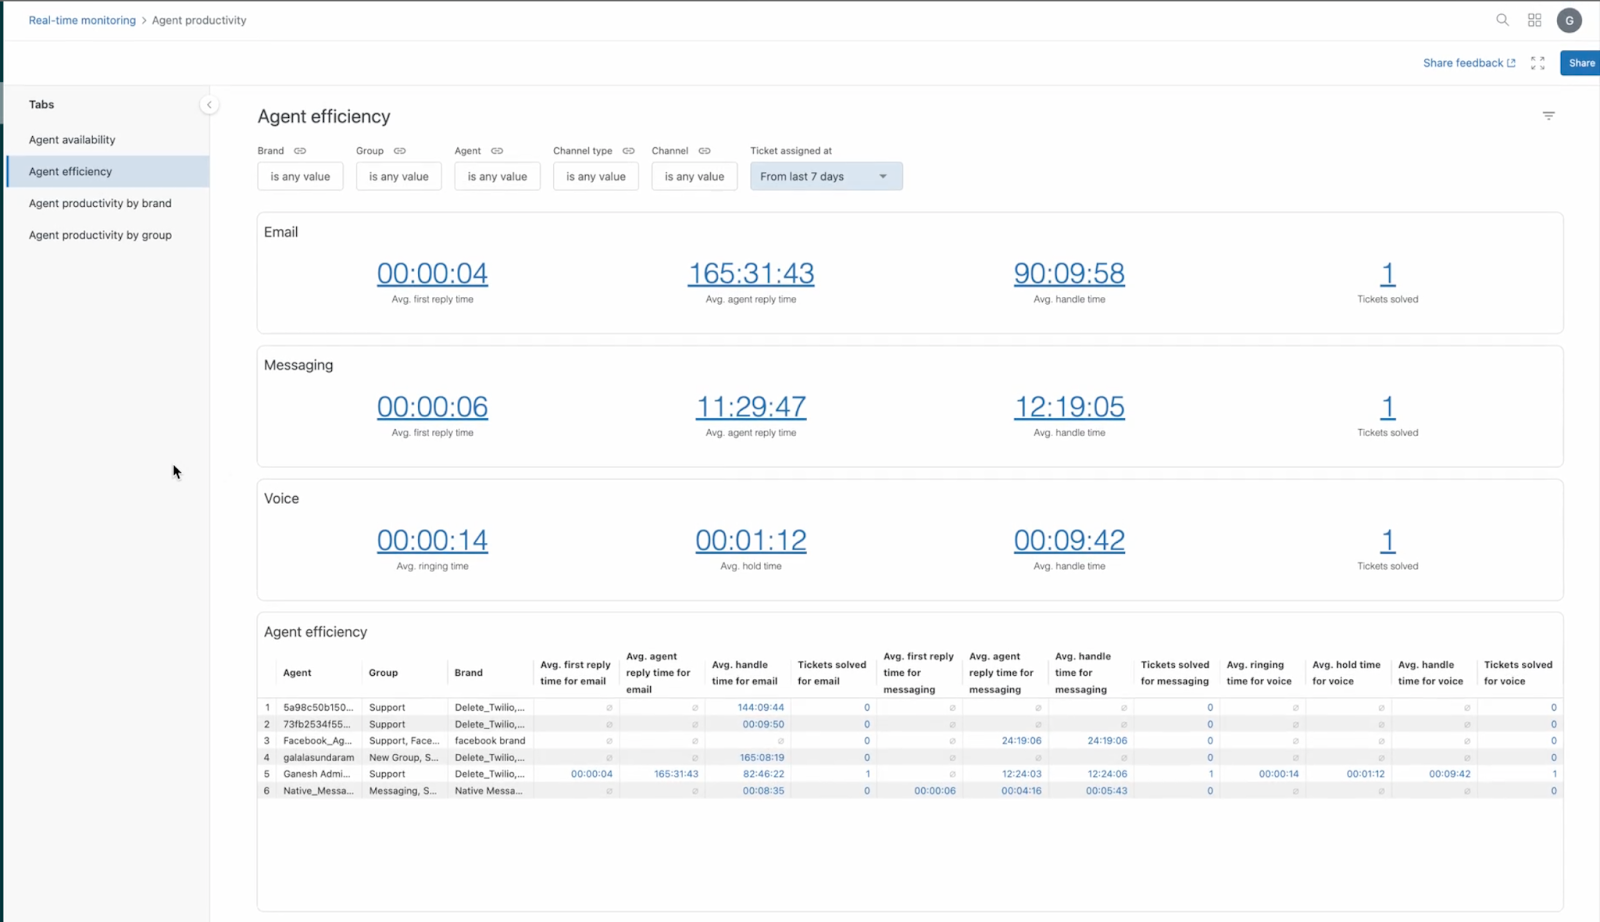
Agent efficiency
This tab provides detailed information on your agent’s productivity and performance across all channels. Supervisors can use this information to understand how well agents are managing their workload, responsiveness, and efficiency. The reports can be filtered by brand, group, agent, channel type, channel, and ticket assigned time.
The agent efficiency metrics are based on agent engagement data. See Metrics and attributes for omnichannel engagement. If a ticket is assigned to an agent multiple times during it's lifecycle, each assignment will be shown separately in the agent efficiency reports.
The tab contains the following reports:
Real-time reports
- Avg. first reply time for email: The average time between when an email ticket is assigned to an agent until the agent’s first public response.
- Avg. agent reply time for email: The average time it takes an agent to respond between each customer interaction for an email.
- Avg. handle time for email: The average time, from start to finish, that a customer was connected with an agent using email. This metric only counts duration whilst the ticket is in an open or pending state.
- Email tickets solved: The number of email tickets solved by the agent during the time period you selected. Tickets that were solved without an active assignee are not counted, as they can't be used to measure an agent's efficiency.
- Avg. first reply time for messaging: The average time between when a messaging ticket is assigned to an agent until the agent’s first public response.
- Avg. agent reply time for messaging: The average time it takes an agent to respond between each customer interaction for a message. This metric only counts duration whilst the ticket is in an open or pending state.
- Avg. handle time for messaging: The average time, from start to finish, that a customer was connected with an agent using messaging.
- Messaging tickets solved: The number of messaging tickets solved during the time period you selected. Tickets that were solved without an active assignee are not counted, as they can't be used to measure an agent's efficiency.
- Avg. ringing time: The average time between when a voice ticket is assigned to an agent until the agent’s first public response.
- Avg. hold time: The average time it takes an agent to respond between each customer interaction for a call. This metric only counts duration whilst the ticket is in an open or pending state.
- Avg. handle time: The average time, from start to finish, that a customer was connected with an agent using voice.
- Tickets solved for voice: The number of voice tickets solved by their assignee during the time period you selected. Tickets that were solved without an active assignee are not counted, as they can't be used to measure an agent's efficiency.
- Agent efficiency: A table showing, for each agent, data that can help you determine the efficiency of the agent, such as the number of tickets solved and first reply time of individual agents.
Recent history reports
- Average agent first reply and ringing time: The average time between when an email or messaging ticket is assigned to an agent until the agent’s first public response over a selected time period. For voice, this calculates the average time between when a voice ticket is assigned to an agent until the agent’s first public response over a selected time period.
-
Average agent reply and hold time: The average time it takes an
agent to respond between each customer interaction for a message or email over a
selected time period. For voice, this calculates the average time it takes an
agent to respond between each customer interaction for a call over a selected
time period.
These metrics only count duration whilst the ticket is in an open or pending state.
-
Average handle time: The average time, from start to finish,
that a customer was connected with an agent using email or messaging over a
selected time period. For voice, this calculates the average time, from start to
finish, that a customer was connected with an agent using voice over a selected
time period.
This metric only counts duration whilst the ticket is in an open or pending state.
- Tickets solved: The number of email,messaging or voice tickets solved by the agent during the time period you selected.
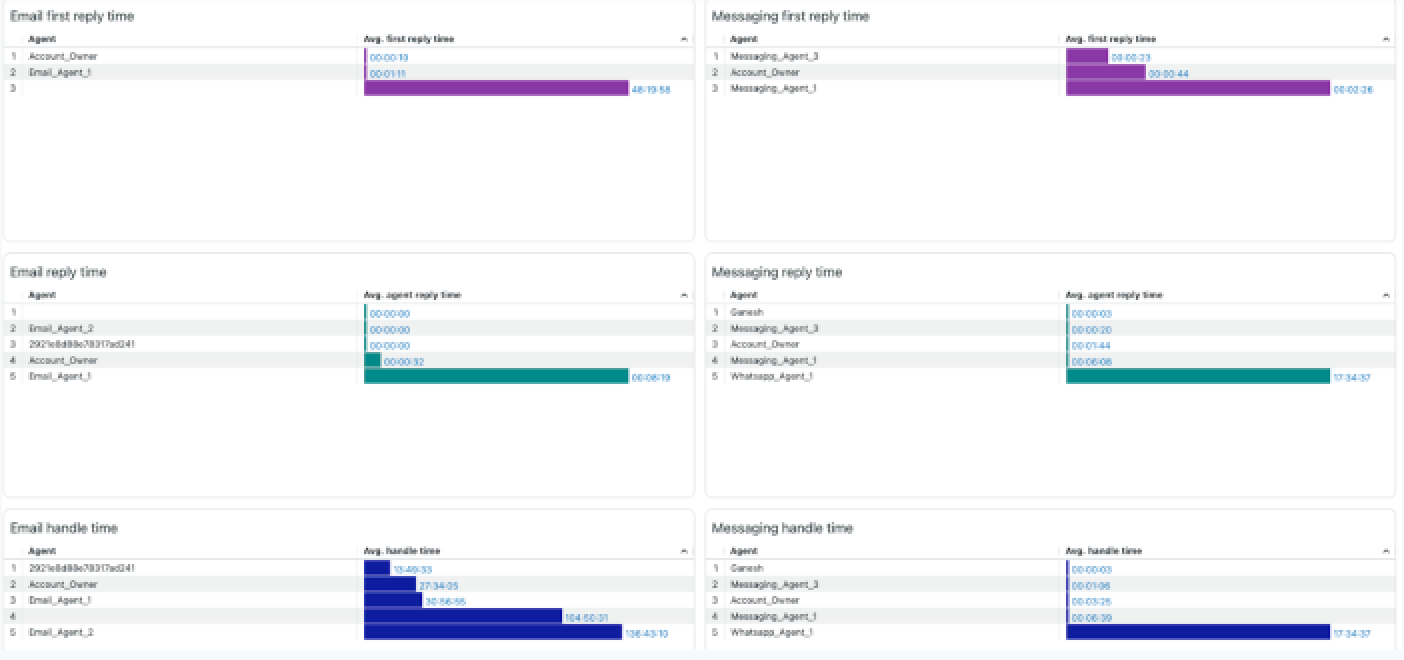
Agent leaderboard
A collection of recent history reports that compare your agents’ performance. You can click the arrow next to a report's columns to sort into ascending or descending order. For example, you could sort the email tickets solved report to display the agent who solved the most tickets, or the agent who solved the least.
The following reports are available:
Recent history reports
- First reply time for email: List of agents by the average time it takes them to first respond publicly on an assigned email ticket.
- Reply time for email: List of agents by their average response time to customer email tickets.
- Handle time for email: List of agents by the average time spent handling email tickets from assignment until resolution.
- Tickets solved for email: List of agents by the number of email tickets solved.
- First reply time for messaging first reply time: List of agents by the average time it takes them to first respond publicly on an assigned messaging ticket.
- Reply time for messaging: List of agents by their average response time on customer messaging tickets.
- Handle time for messaging: List of agents by the average time spent handling each messaging interaction from assignment until resolution.
- Messaging tickets solved: List of agents by the number of messaging tickets solved.
- Ringing time for voice: List of agents by the average time it takes them to first respond to a call.
- Hold time for voice: List of agents by their average time with customers on hold.
- Handle time for voice: List of agents by the average time spent handling each call interaction from assignment until resolution.
- Tickets solved for voice: List of agents by the number of voice tickets solved.
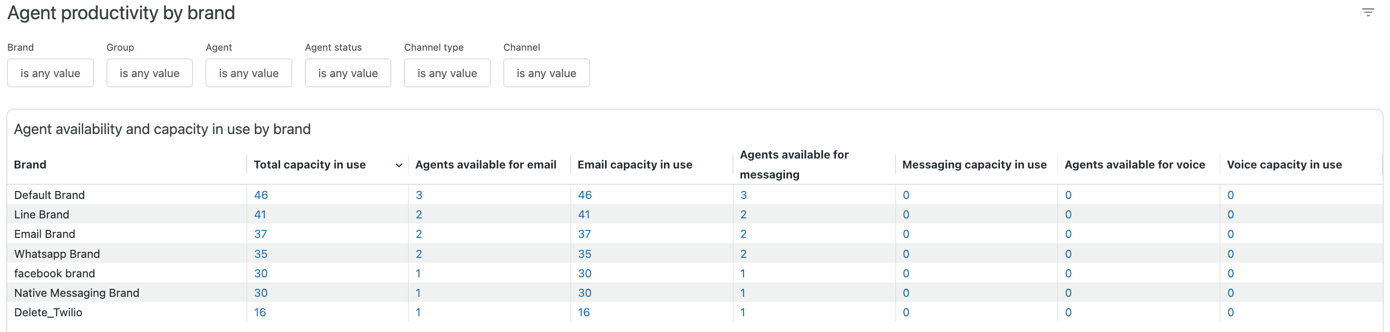
Agent productivity by brand
For each of your brands, this tab gives you information about your agent’s capacity and availability alongside their performance. These reports can be filtered by brand, group, agent, agent status, channel type, channel, time- agent activity and ticket assigned.
The tab contains the following reports:
Real-time reports
- Agent availability and capacity in use by brand: For each of your brands, displays the brand name, assigned tickets, and agents available and capacity in use for email, messaging, and voice.
Recent history reports
- Agents available: The number of agents that are available for email, messaging and voice support over the time period selected. You can drill into this report to see more details about the available agents at that particular point in time..
- Agent capacity used: The count of agents used capacity over time across email, messaging and voice. You can drill into this report to see more details about the tickets assigned to the agents at that particular point in time.
Brand leaderboard
A collection of reports that compare your brand's recent history performance. You can click the arrow next to a report's columns to sort into ascending or descending order. For example, you could sort the email tickets solved report to display the brands which solved the most tickets, or the brands which solved the least.
- First reply time for email: List of brands by the average time it takes agents to first respond publicly on an assigned email ticket.
- Reply time for email: List of brands by their agents' average response time to customers on email tickets.
- Handle time for email: List of brands by the average time their agents spent handling email tickets from assignment until resolution.
- Tickets solved for email: List of brands with the number of email tickets solved by each brand.
- First reply time for messaging: List of brands by the average time it takes agents to first respond publicly on an assigned messaging ticket.
- Reply time for messaging: List of brands by their agents' average response time to customers on messaging tickets.
- Handle time for messaging: List of brands by the average time their agents spent handling messaging tickets from assignment until resolution.
- Tickets solved for messaging: List of brands with the number of messaging tickets solved by each brand.
- Ringing time for voice: List of brands showing the average time before a call is answered.
- Voice hold time: List of brands by their agents’ average time with customers on hold.
- Voice handle time: List of brands by their agents’ average time spent handling each call interaction from assignment until resolution.
- Tickets solved for voice: List of brands with the number of voice tickets solved by each brand.
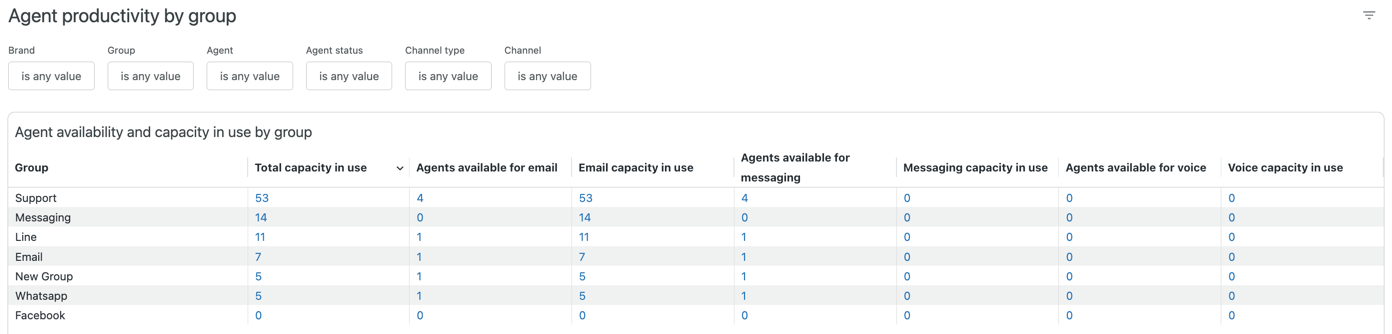
Agent productivity by group
For each of your groups, this tab gives you information about your agents’ capacity and availability alongside their performance. These reports can be filtered by brand, group, agent, agent status, channel type, channel, time- agent activity and ticket assigned.
The tab contains the following reports:
Real-time reports
- Agent availability and capacity in use by group: For each of your groups, displays the group name, assigned tickets, and agents available and capacity in use for email, messaging and voice.
Recent history reports
- Agents available: The number of agents that are available for email, messaging and voice support over the time period selected. You can drill into this report to see more details about the available agents at that particular point in time.
- Agent capacity used: The count of agents’ used capacity over time across email, messaging and voice. You can drill into this report to see more details about the tickets assigned to the agents at that particular point in time.
Group leaderboard:
A collection of recent history reports that compare your group's performance. You can click the arrow next to a report's columns to sort into ascending or descending order. For example, you could sort the email tickets solved report to display the group who solved the most tickets, or the group who solved the least.
- Email first reply time: List of groups by the average time it takes agents to first respond publicly on an assigned email ticket.
- Email reply time: List of groups by their agents' average response time to customers on email tickets.
- Email handle time: List of groups by the average time their agents’ spent handling email tickets from assignment until resolution.
- Messaging first reply time: List of groups by the average time it takes agents to first respond publicly on an assigned messaging ticket.
- Messaging reply time: List of groups by their agents' average response time to customers on messaging tickets.
- Messaging handle time: List of groups by the average time their agents spent handling messaging tickets from assignment until resolution.
- Ringing time for voice: List of groups showing the average time before a call is answered.
- Voice hold time: List of groups by their agents’ average time with customers on hold.
- Voice handle time: List of groups by their agents’ average time spent handling each call interaction from assignment until resolution.
- Tickets solved for voice: List of groups with the number of voice tickets solved for by each group.
Agent adherence
This tab gives you information about whether agents are working according to their planned schedules. The reports can be filtered by brand, group, team, location, agent, agent status, activity, and adherence status.
The filters are linked so, for example, if you select a group, then select agents, only the agents in the group you selected are displayed. Additionally, you can use the Agents not scheduled switch to control whether only agents who have a schedule to comply with or all agents within this view are displayed.

WFM determines agent activity by monitoring work on tickets, attendance to general tasks, or from agent status (if unified agent status is turned on in WFM). Whenever an agent's activity matches their scheduled workflow, general task, or status, the agent is considered in adherence. For more information, see About the Agent activity page.
To view this tab, you must be using Zendesk WFM and have Explore admin or viewer access,
The agent adherence dashboard helps you:
- Monitor schedule compliance in real time: Spot which agents are not following their planned schedules.
- Take corrective action quickly: Identify unplanned offline time or gaps in activity before they impact service levels.
- Optimize resource allocation: Balance workloads across agents by tracking who is available, who is working, and who might need coaching or adjustments.
- Improve reporting and accountability: Use drill-down reports and activity details for coaching conversations, compliance audits, or operational reviews.
This tab contains the following reports:
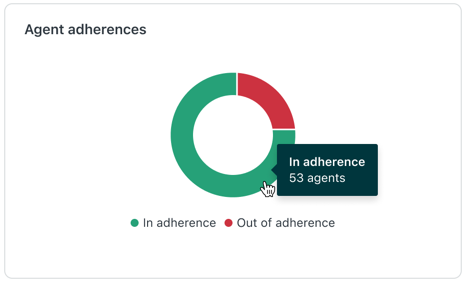
-
Agent adherences: A pie chart displaying the number of agents in and out
of adherence. Click one of the chart sections to view each agent in or out of
adherence.
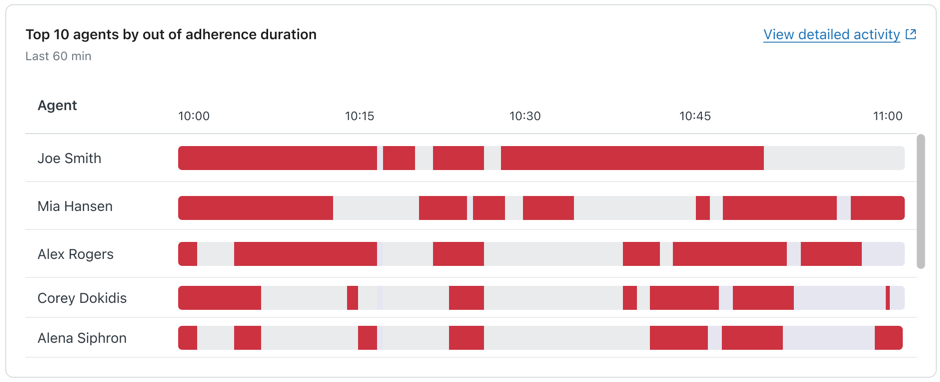
-
Top 10 agents by out of adherence duration: Displays the ten agents who
have been out of adherence for the longest time in the last 60 minutes. Red bars
indicate periods where an agent was out of adherence, while gray bars show when
they were in adherence. This view helps you quickly identify opportunities to
improve your agents’ overall performance and schedule adherence.
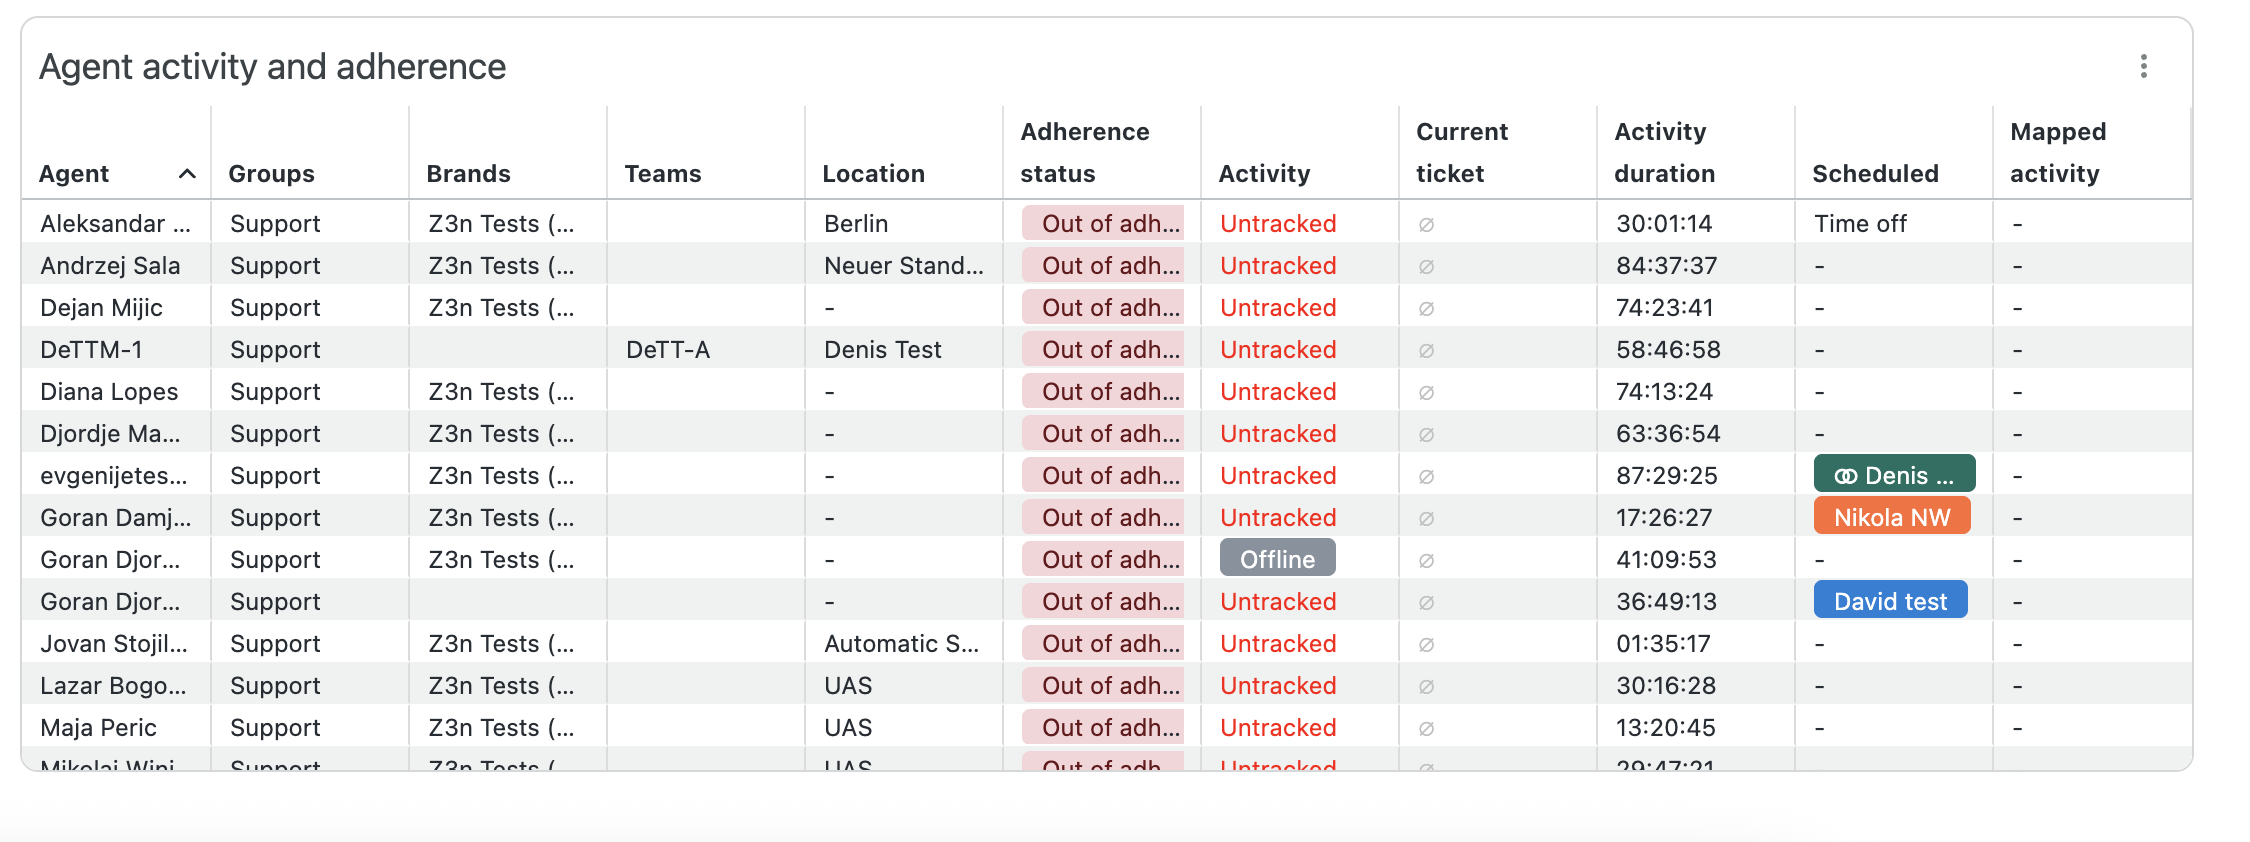
-
Agent activity and adherence:
In this table, you’ll find a detailed table of all agents and their adherence status, including:
- Agent, Group, Brand, Teams, and Location: The agent’s name and organizational attributes.
- Adherence status: Indicates whether the agent is in or out of adherence.
- Activity: Current real-time status tracked in WFM, such as a general task or a ticket workstream.
- Current ticket: If an agent is working on a ticket, you’ll see the ticket ID and how long they’ve been on it.
- Activity duration: The length of time spent in the current adherence status.
- Scheduled: Displays any scheduled agent activities.
- Mapped activity: Displays any mapped agent activities.
The following report is displayed if you are not using omnichannel routing:
-
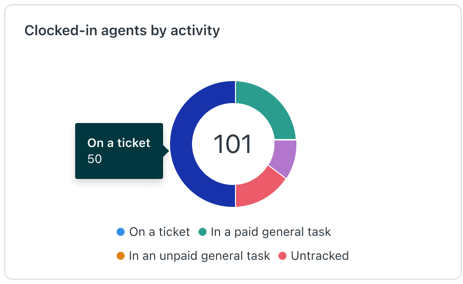
Clocked-in agents by activity: A pie chart showing the number agents
working on the following activities:
- On a ticket
- In a paid general task
- In an unpaid general task
- Untracked
The following reports are displayed if you are using omnichannel routing:
-
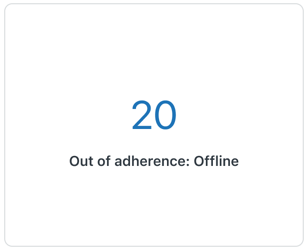
Out of adherence: Offline: Displays the number of agents who are out of
adherence and currently offline.
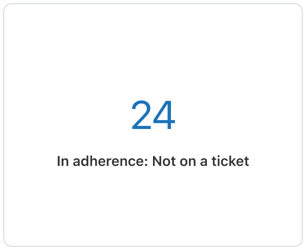
-
In adherence: Not on a ticket: Displays the number of agents who are in
adherence and are not working on a ticket.
Saving your dashboard filter selections
You can save dashboard filter selections so they persist when you reopen the dashboard.
To save your dashboard filter selections
- In any real-time monitoring dashboard, configure the filters as required.
- In your web browser, bookmark or copy the URL displayed for the dashboard.
Now, when you visit the URL you saved, the dashboard will open with the filters you configured.