- Use natural language to query your business information.
- Manually build a report using datasets and configurable fields.
This article contains the following topics:
Understanding available data
For this EAP, the following datasets are available:
- Support tickets: Contains detailed ticket information such as attributes, status, timings, customer and agent metadata, AI-assisted suggestions, and enhanced writing features usage.
- Agent daily snapshot: Contains agent activity metrics such as ticket volumes, resolution stats, AI and enhanced writing feature usage, roles, groups, and other agent-level attributes.
Creating a report using a prompt
Analyst copilot understands natural language prompts, so you can simply ask a question to create a report.
To create a report using a prompt
- On the Analyst copilot home page, click the
prompt type icon (
 ) to choose the prompt type you want from
the following:
) to choose the prompt type you want from
the following:- Analyze data: Uses existing memories to create the report. This prompt type is suitable for most users.
- In-depth exploration: Uses existing memories and deeper analysis to create the report. This can be useful for digging into details to discover the reasons behind your results.
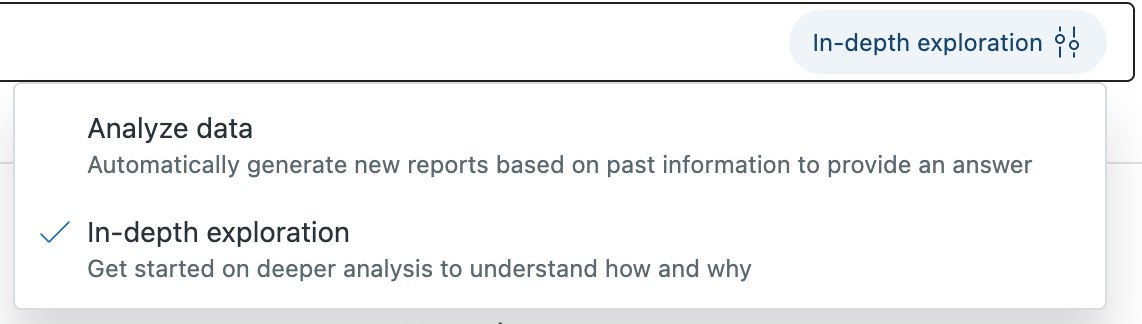
- Enter your prompt. For example, “What’s happening with my
tickets?”
 Tip: For prompt ideas, see Using natural language prompts to create Analyst copilot reports.
Analyst copilot returns an answer and relevant memories.
- Click an item in the Sources panel to see further information that was
used to create the report.
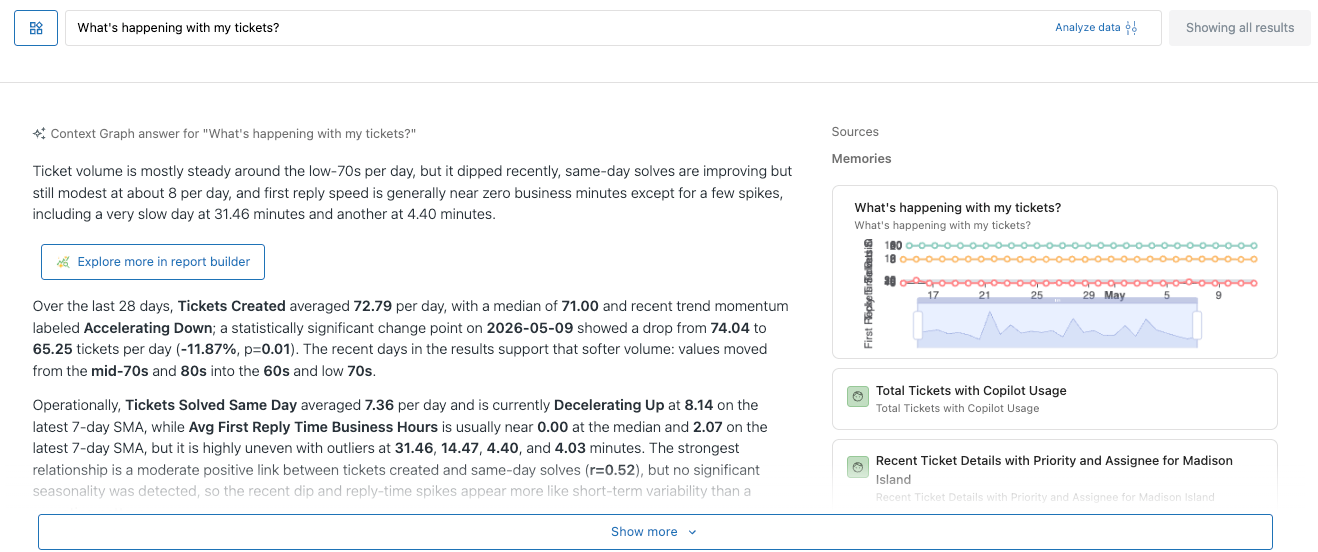
Below your report, you’ll see a list of assets (such as reports, dashboards, and datasets) related to your question.
Here are more examples of prompts you can use to query your business information:
- How many unsolved tickets do I currently have?
- Who solved the most tickets last year?
- Show my tickets by status
- How many unsolved tickets are assigned to Rob Stack?
If Analyst copilot does not have sufficient information to answer your question, no answer or memories are displayed.
Building reports manually
In this section, you’ll create a report using the metrics and attributes in one of your datasets.
Use this procedure to create a simple report containing metrics, attributes, and a filter. This example displays all tickets solved by Rob Waller in 2024.
To create a simple report
- In Analyst copilot, click the create icon
(+), then select Report.
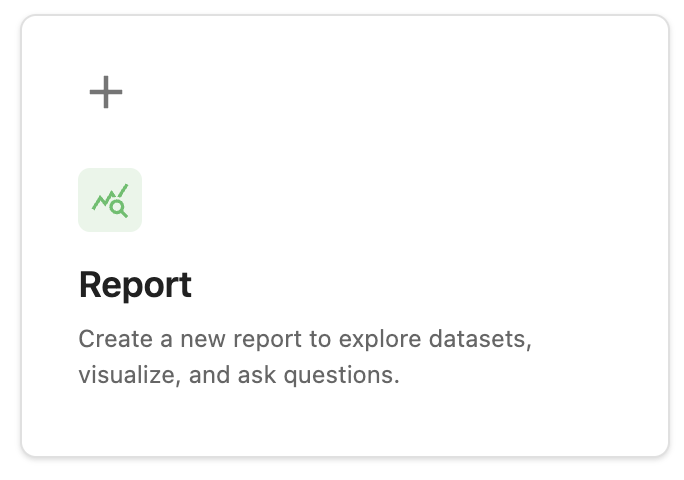
- On the Select a dataset to query page, click the dataset containing the information you want to report, for example, Support tickets. A new page opens with a blank report.
- Filter the report to display tickets solved in 2024. Under the filters panel, click the add icon (+).
- In the filter chooser, click Ticket solved. The filter is added to your report.
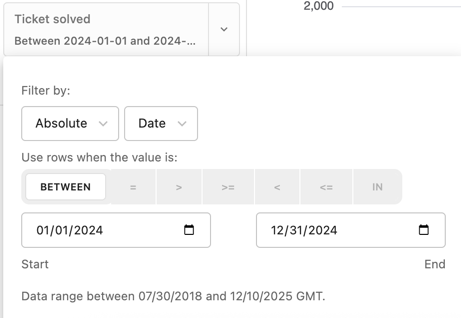
- Apply a date range to the filter. Click the Ticket solved filter you just added.
- In the filter options, configure the following settings:
- Filter by: Select Absolute and Date.
- Use rows when the value is: Select BETWEEN.
- Start and end dates: Set these values to the start and end of 2024 as shown in the screenshot below.
- Under the filters panel, click the add icon (+).
- In the filter chooser, click Assignee name. The filter is added to your report.
- In the filter options, configure the following settings:
- Use rows when the value is: Select IN.
- From the list of names, choose Rob Waller.
- Click Add filter and select Ticket status.
- From the list of statuses, select Solved (the status name might
vary if you've configured custom ticket statuses).Tip: While you are creating the report, watch the status indicator at the bottom left of the page. This provides helpful suggestions to improve your report and also informs you when your actions are added to Analyst copilot's memories, where they can be accessed later.
Changing how your report is displayed
Once you've created a report, you can add more information to it or change how it's displayed.
Adding columns
You can add more columns to a report to show more information.
To add columns to a report
- From the Dataset panel of your report, drag the dimensions you want into the Fields section.
- Drag and drop the dimensions you added into the order you want.
Changing a report visualization type
You can choose from a range of visualization types such as tables, pie charts, and column charts to present your report how you want.
To change the visualization type
- In a report, click the Type drop down in the Visualization section.
- From the list, select the visualization type you want.
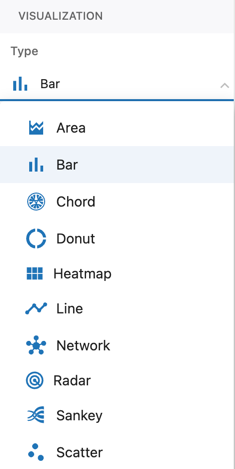
The report updates to display the new visualization type.
Using conditional formatting
- Business leaders or supervisors often require "at-a-glance" visual cues (for example, red for low performance, green for targets met) driving immediate, actionable insights, accelerating decision-making speed, and reducing cognitive load for users
- Support Agents appreciate the ability to view their performance against their peers or a benchmark, so they can easily see if they need to take action to improve their performance.
To conditionally format report results
- In a report, click Conditional formatting.
- In the Add conditional formatting panel, configure the following:
- Apply conditional formatting to: Choose the measure you want to conditionally format.
- Field: Choose the measure you want to measure, for example, Ticket status.
- Operator: Choose the operator you want to use. The available operators will vary depending on the field type you choose. Example include, is, is greater than, and equals.
- Value: Choose the value you want to evaluate for formatting.
- Fill color: Choose the color that the result will be displayed in if it evaluates as true.
- Click Apply.
Your new rule is displayed
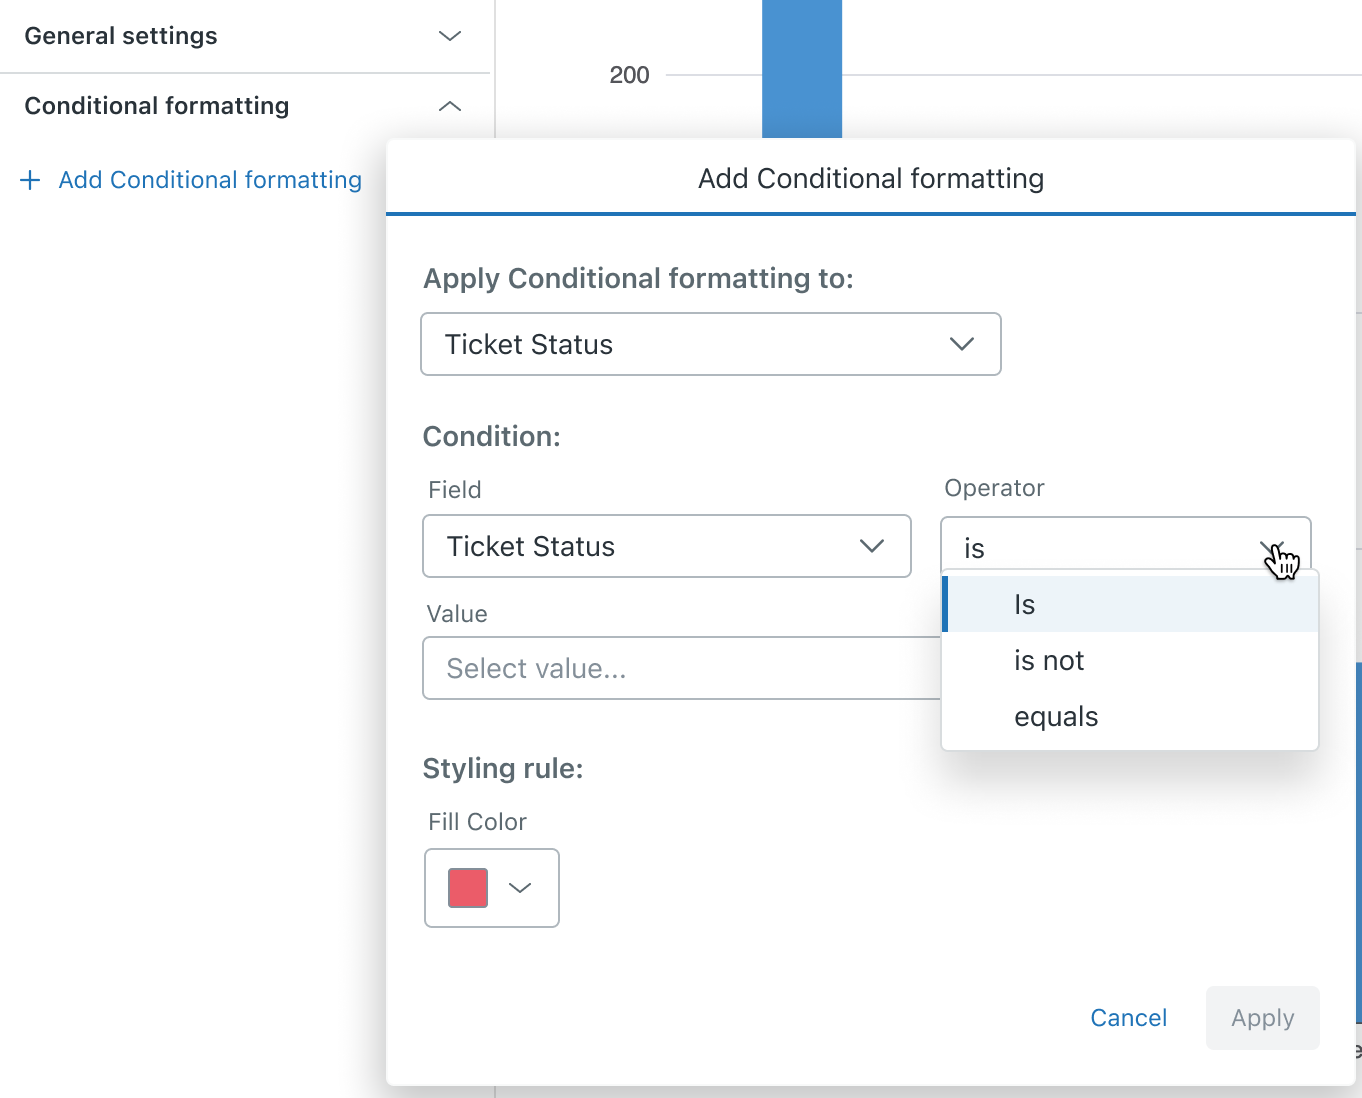
Example
You configure a rule with the following values:
- Field: Ticket status
- Operator: is
- Value: Open
- Fill color: Red
Analyst copilot displays open tickets in red.
Configuring advanced report options
There are several capabilities you can use to fine-tune your report configuration and presentation.
To configure advanced report options
- In a report, click the options menu (
 ) .
) .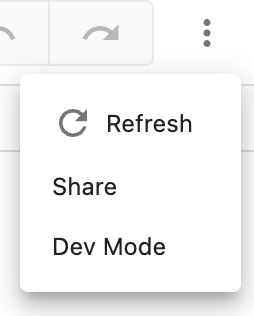
- Select one of the following options:
- Refresh: Refreshes your report with the latest results.
- Share: Opens the share report page where you can share a URL to your report, or save it as an image file.
- Dev mode: Displays the report configuration in JSON format. You can modify the configuration as required.
Using suggestions to give reporting ideas
You can use either AI-powered or manually-generated suggestions to give you ideas on further reports you might find useful.
To use AI-powered suggestions
- In a report, review the suggestions at the bottom of the page when a memory is created.
- Click the suggestion you want to review.
The suggestion is expanded with more information.
- Click Apply suggestion to update your report or click Try
this in a new report to open the suggestion in a new report.

To manually generate suggestions
- Open the memories panel.
- Click a memory for which you want to generate suggestions.
- In the memory narration panel, click the find inspiration icon (
 ).
).Analyst copilot displays suggestions at the bottom of the page.
Saving reports
Once you've finished editing your report, save it so you can work on it later, or share it with others.
To save a report
- In a report, click Save or Save as.

- Provide the following information:
- If you're saving a report for the first time:
- On the Save report as page, provide the following
information:
- Name: Enter a name for the report.
- Description: Optionally, enter a description for the report.
- Project: Choose the project where your report will be saved.
- URL: The URL for the report is created automatically from the report name, but you can change this if required.
- Click Save.
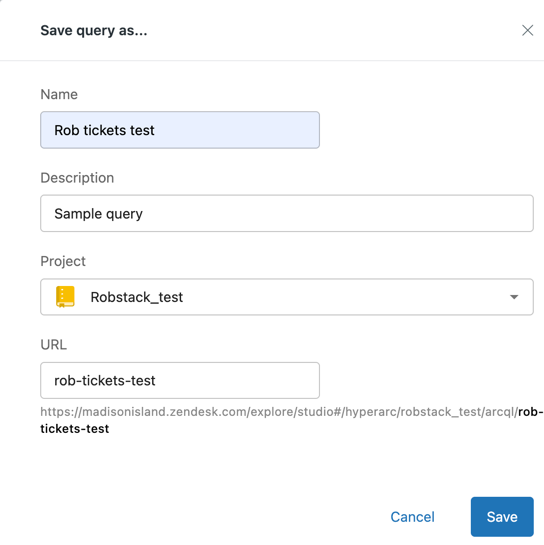
- On the Save report as page, provide the following
information:
- If you're saving a report that was previously saved:
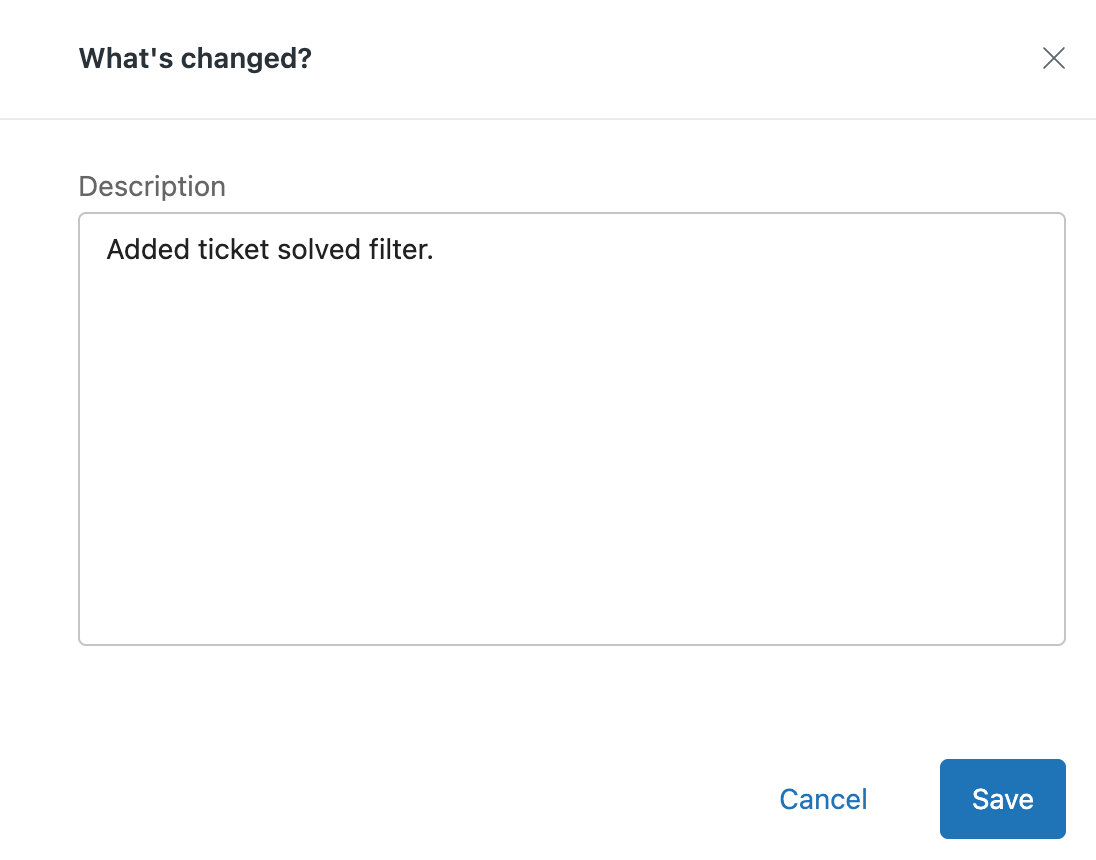
- On the What's changed page, review the AI-generated summary of changes since you last saved, or provide your own summary.
- Click Save.
- If you're saving a report for the first time: