Answer Bot works with Zendesk Guide to intelligently suggest articles that might help customers resolve issues before they need to call an agent. To learn more about Answer Bot, see Zendesk bot documentation.
You can use Explore to create reports that help you analyze how well Answer Bot is doing and to help you measure the savings it's making in your organization. Explore contains a built-in dashboard that displays common statistics about Answer Bot, but you can also create your own reports. In this article, you'll be introduced to some of the basics around creating reports for Answer Bot.
This article contains the following topics:
What you'll need
Skill level: Intermediate
Time required: 30 minutes
- Editor or Admin permissions (see Adding users to Explore)
- Zendesk Guide Professional or Enterprise with the Answer Bot add-on
- A blank Explore report using the Answer Bot: Article Recommendations dataset. For help creating a new report, see Creating reports.
Basic reports
In this topic, you'll learn about some of the basic Answer Bot metrics you can use to determine it's effectiveness in your organization.
This section contains the following topics:
Suggestions
When a customer contacts you, Answer Bot will scan the text of the request and suggest relevant articles that could resolve the issue for the customer.

These are known as suggestions.
To see the number of suggestions Answer Bot has made
- In the Metrics panel of your blank report, click Add.
- From the list of metrics, choose Answer Bot suggested articles > Suggested articles, then click Apply.
Explore displays the total number of suggestions made by Answer Bot.

Clicked articles
From the list of suggested articles, the customer can visit any of them to see if the article solves their problem.

These are known as clicked suggestions.
To see the number of clicked suggestions
- In the Metrics panel of your blank report, click Add.
- From the list of metrics, choose Answer Bot suggested articles > Clicked articles, then click Apply.
Explore displays the total number of suggestions clicked by customers.

Resolutions
A resolution happens when the end user who was offered an Answer Bot suggestion marks their request solved.

To look at the number of Answer Bot resolutions
- In the Metrics panel of your blank report, click Add.
- From the list of metrics, choose Answer Bot suggested articles > Resolutions, then click Apply.
Explore displays the total number of resolutions to Answer Bot suggestions.

Rejected articles
A rejection happens when the end user who was offered an Answer Bot suggestion marks their request as not solved.

To look at the number of Answer Bot rejections
- In the Metrics panel of your blank report, click Add.
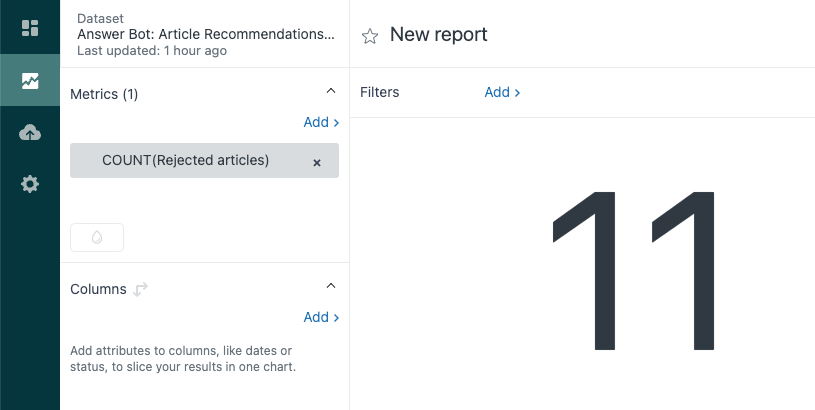
- From the list of metrics, choose Answer Bot suggested articles > Rejected articles, then click Apply.
Explore displays the total number of rejections to Answer Bot suggestions.

Now, you'll move on and use these metrics to create more complex reports.
Advanced reports
In this topic, you'll use the information you've already learned to produce more complex reports.
This section contains the following topics:
Top ten articles for Answer Bot resolutions
To get the best from Answer Bot, create Help Center articles with clear titles that contain information to help identify the problem in their first paragraph. Use this report to help you identify the top ten articles that Answer Bot has suggested and that have resulted in resolving the customer's problem. This can help you learn what kind of articles provide the best results with Answer Bot.
To create the top ten articles report
- In the Metrics panel of your blank report, click Add.
- From the list of metrics, choose Answer Bot answers > Resolutions, then click Apply.
- In the Rows panel, click Add.
- From the list of attributes, choose Article > Article translation title, then click Apply. Explore displays a table showing all articles in your Help Center together with the number of Answer Bot resolutions.
- Now, you'll restrict this to just the top ten results. In the result manipulation menu (
 ), click Top/bottom.
 - On the Top/bottom filter page, check Top, then enter 10 in the number field.
- Click Apply. Only the top ten results are now displayed.

Bot answers by status
In this example, you'll create a report that shows the status of each bot answer for this year.
- In the Metrics panel of your blank report, click Add.
- From the list of metrics, choose Answer Bot answers > Attempts, then click Apply.
- In the Columns panel, click Add.
- From the list of attributes, choose Answer Bot answer > Answer status.
Explore displays a pie chart showing the percentage of each bot answer status from:
- Unoffered: The answer has not been offered.
- Offered: The answer has been offered.
- Clicked: The answer has been clicked by a customer.
- Resolved: The answer led to the ticket being resolved.

Now you'll add a date filter that lets you restrict the result to this year only.
- In the Filters panel, click Add.
- From the list of filters, choose Time - Answer Bot answer created > Answer created - Year, then click Apply.
- Click the filter you just added and then choose Edit date ranges.
- On the date range page, choose This year, then click Apply.
Explore recalculates the results to display only the status of the bot answers from this year.
Next steps
The Answer Bot datasets contain many metrics and attributes that you can use to help you create your own reports. For a list of available metrics and attributes, see Metrics and attributes for Zendesk Guide.