Summary: ◀▼
The Copilot: Agent productivity dashboard gives you a single place to track AI usage across agent tools, auto assist, AI suggestions, and enhanced writing. You can review adoption, acceptance rates, ticket counts, and reply or resolution times, then filter by ticket details like date, assignee, channel, group, brand, and status to spot trends and improve workflows.
Analyst copilot features a prebuilt dashboard to help you monitor your copilot activity. The Copilot: Agent productivity dashboard provides a centralized view of how agents are interacting with Copilot AI capabilities across four key areas: agent tools usage, auto assist, AI suggestions, and enhanced writing. The dashboard helps you understand adoption, track performance, and identify opportunities to optimize workflows using AI. For more information about the Copilot add-on, see About Zendesk Copilot.
This article contains the following topics:
Accessing the Copilot: Agent productivity dashboard
You can access the Copilot: Agent productivity dashboard from the analyst copilot home page using the following procedure:
To access the Copilot: Agent productivity dashboard
- In Analytics, click the Home (
 ) icon
in the sidebar.
) icon
in the sidebar. - On the analyst copilot home page, search for, then click Copilot: Agent
productivity.
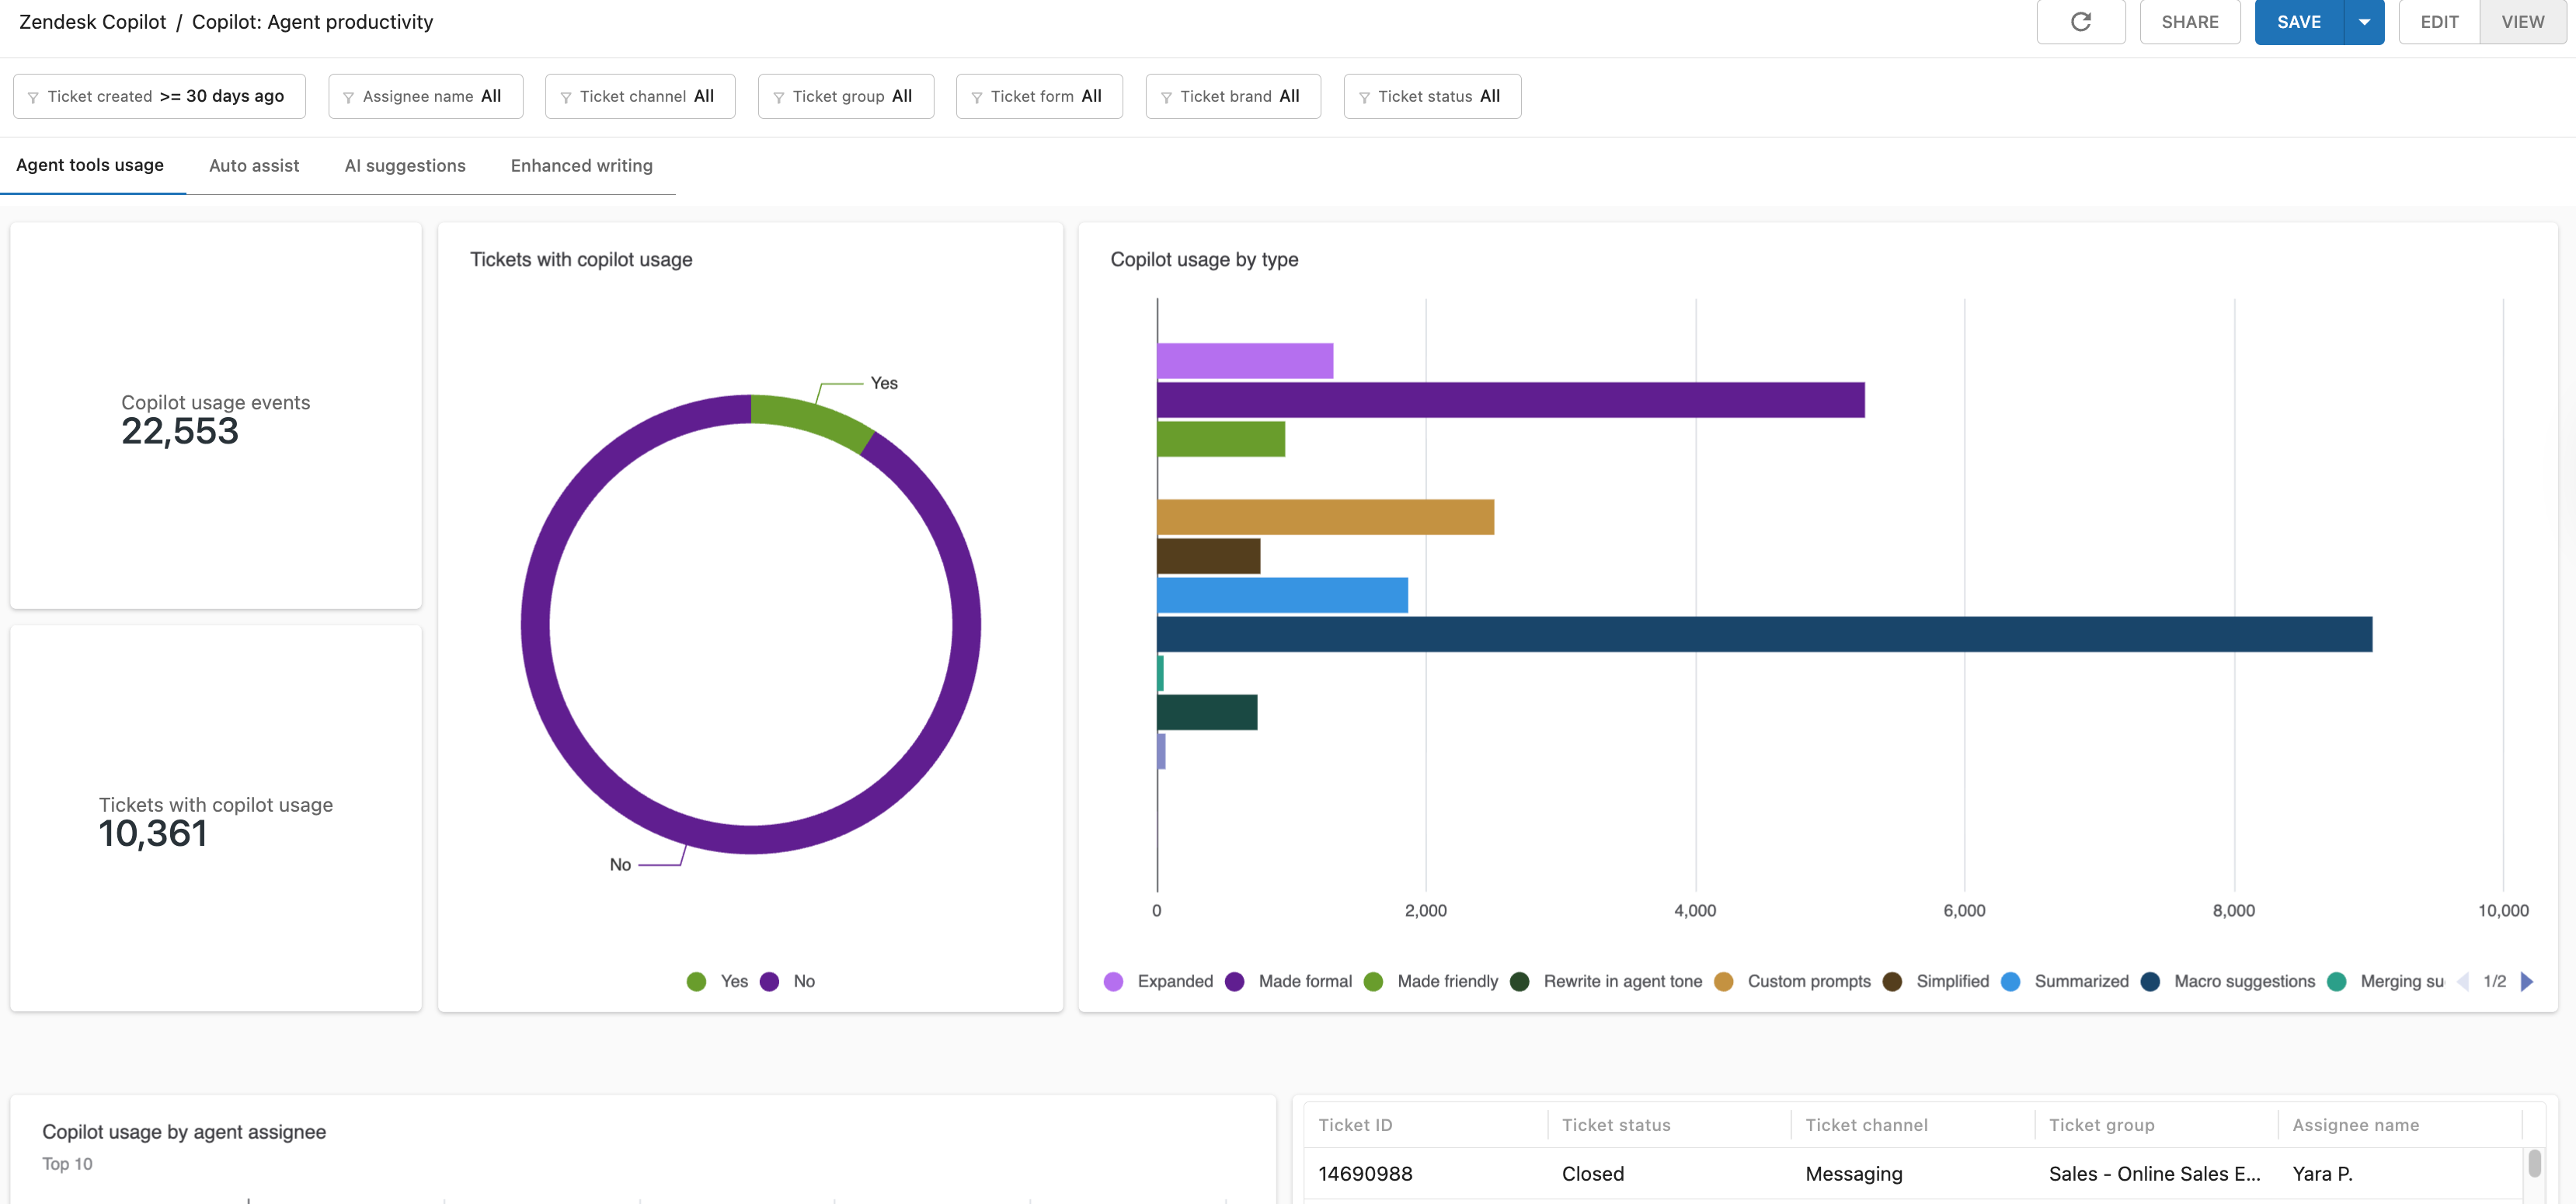
The dashboard opens on the Agent tools usage tab.
Understanding the Copilot: Agent productivity reports
The agent productivity dashboard contains the following tabs:
- Agent tools usage: Reports that help you understand copilot usage in your organization.
- Auto assist: Reports that help you understand auto assist usage in your organization.
- AI suggestions: Reports that help you understand AI suggestions usage for tickets and channels.
- Enhanced writing: Helps you to understand which tickets and features are using enhanced writing tools, for example, "Make more formal."
All reports can be filtered by ticket created date, assignee name, ticket channel, ticket group, ticket brand, and ticket status.

Understanding the agent tools usage tab
The agent tools usage tab provides an overview of how the Copilot add-on is being used in your organization, which agents are using it, and resolution statistics.
Agent tools usage tab reports
The agent tools usage tab contains the following reports:
-
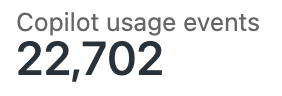
Copilot usage events: A count of how many times the Copilot add-on was used
over the time period you selected.
-
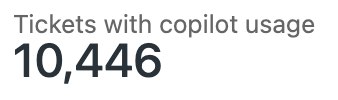
Tickets with Copilot usage: A count of the number of tickets on
which Copilot capabilities were used.
-
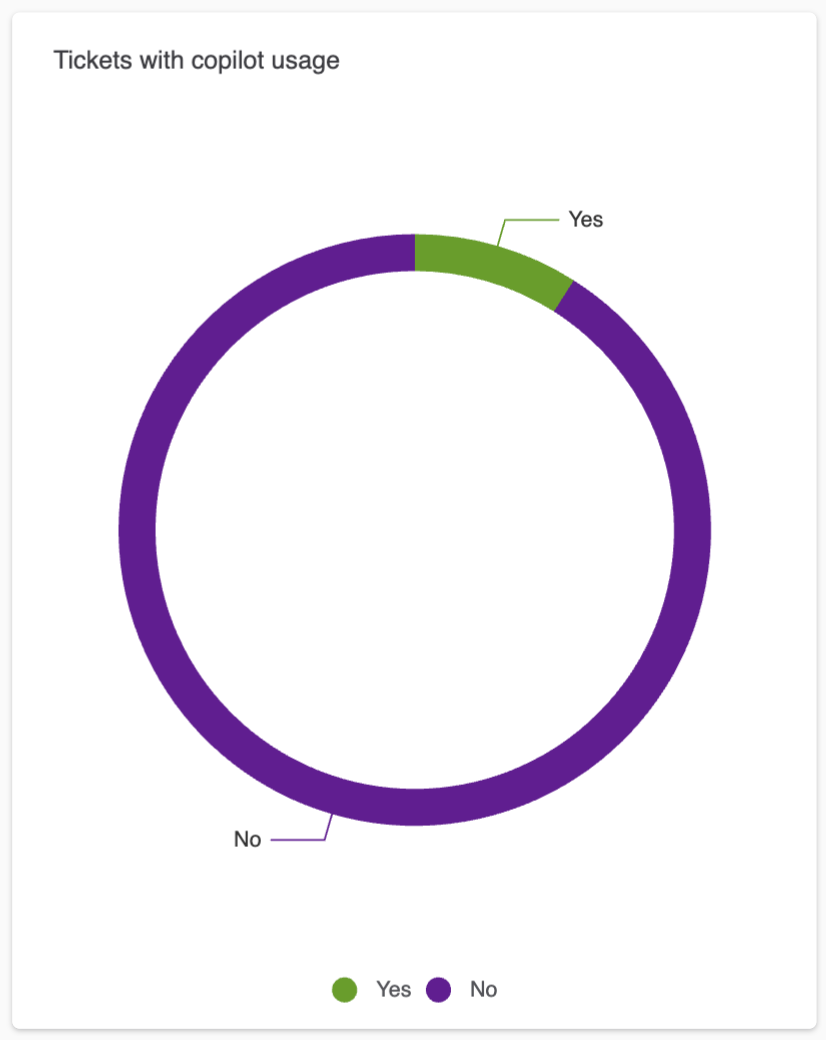
Tickets with Copilot usage: A donut chart displaying the tickets
that did and did not use Copilot capabilities.
-
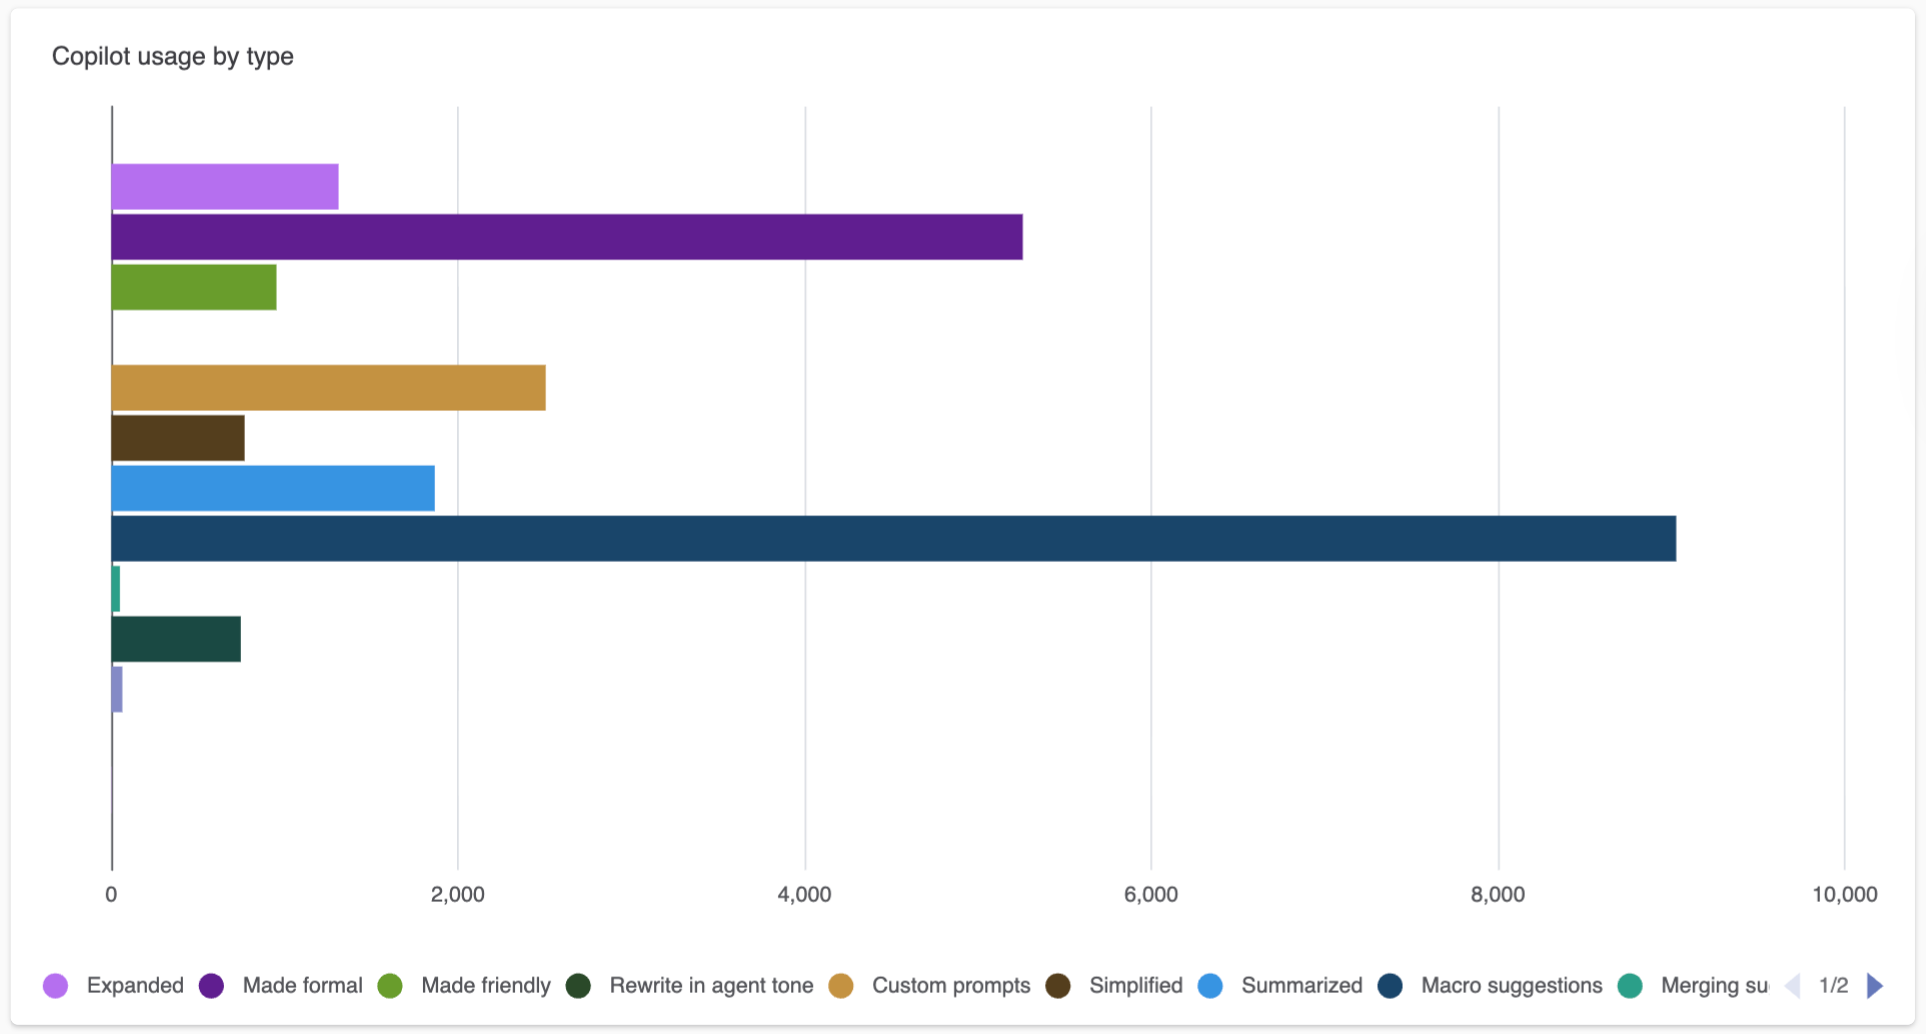
Copilot usage by type: A bar chart displaying the number of
tickets for each type of Copilot usage, for example, made friendly, or
summarized.
-
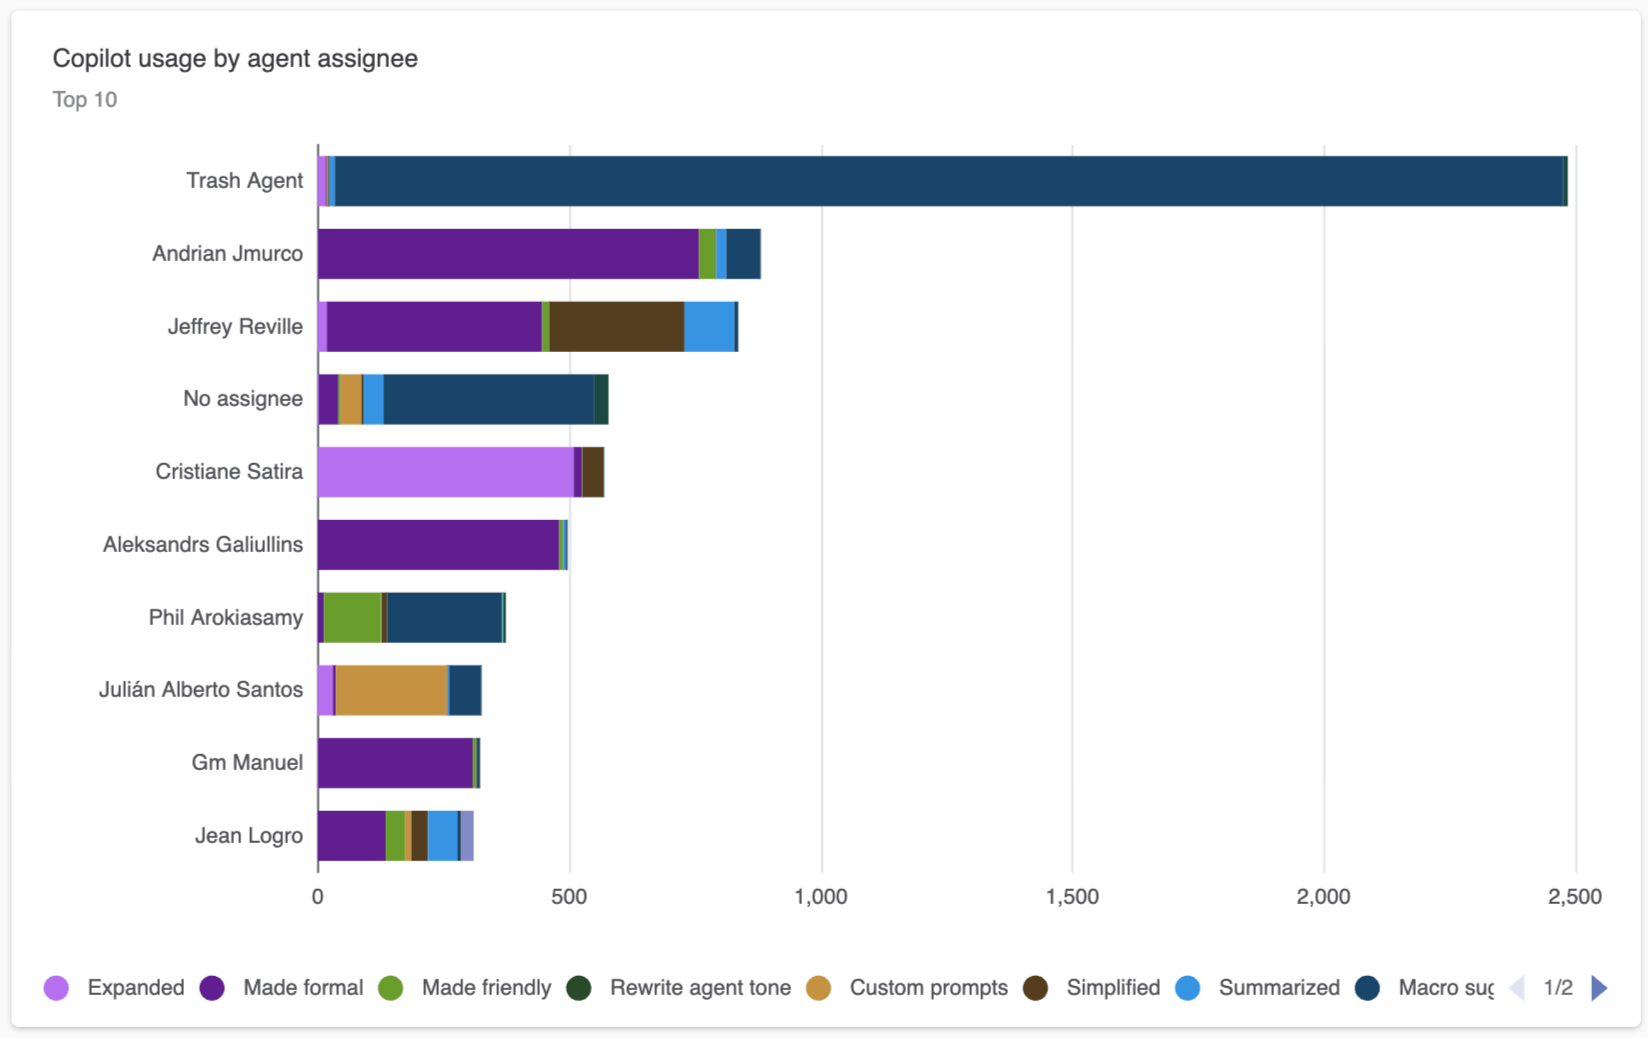
Copilot usage by agent assignee: A stacked bar chart displaying
the top ten agents by Copilot usage. Each bar is split by Copilot usage
type.
-
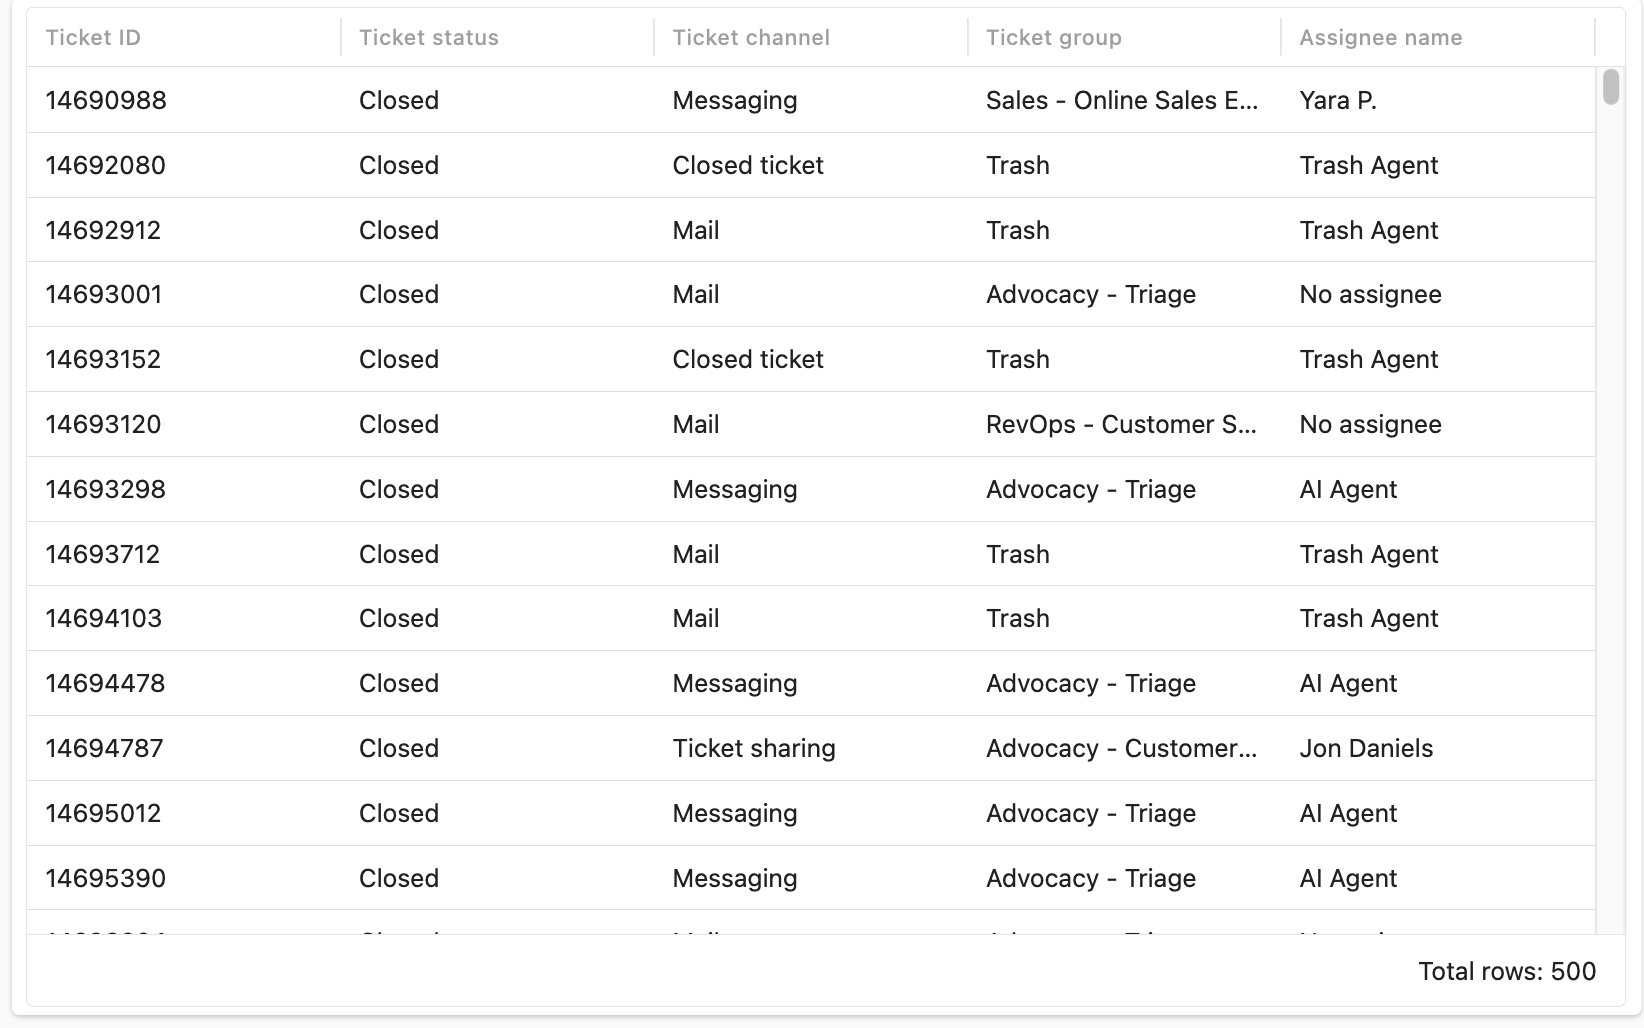
Ticket details: Displays details about each ticket that Copilot
was used on.
-
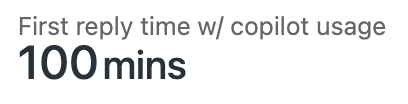
First reply time w/copilot usage: A KPI showing the first reply
time for tickets where Copilot was used.
-
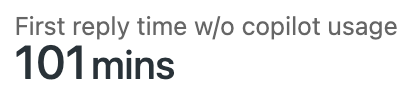
First reply time w/o copilot usage: A KPI showing the first reply
time for tickets where Copilot was not used.
-
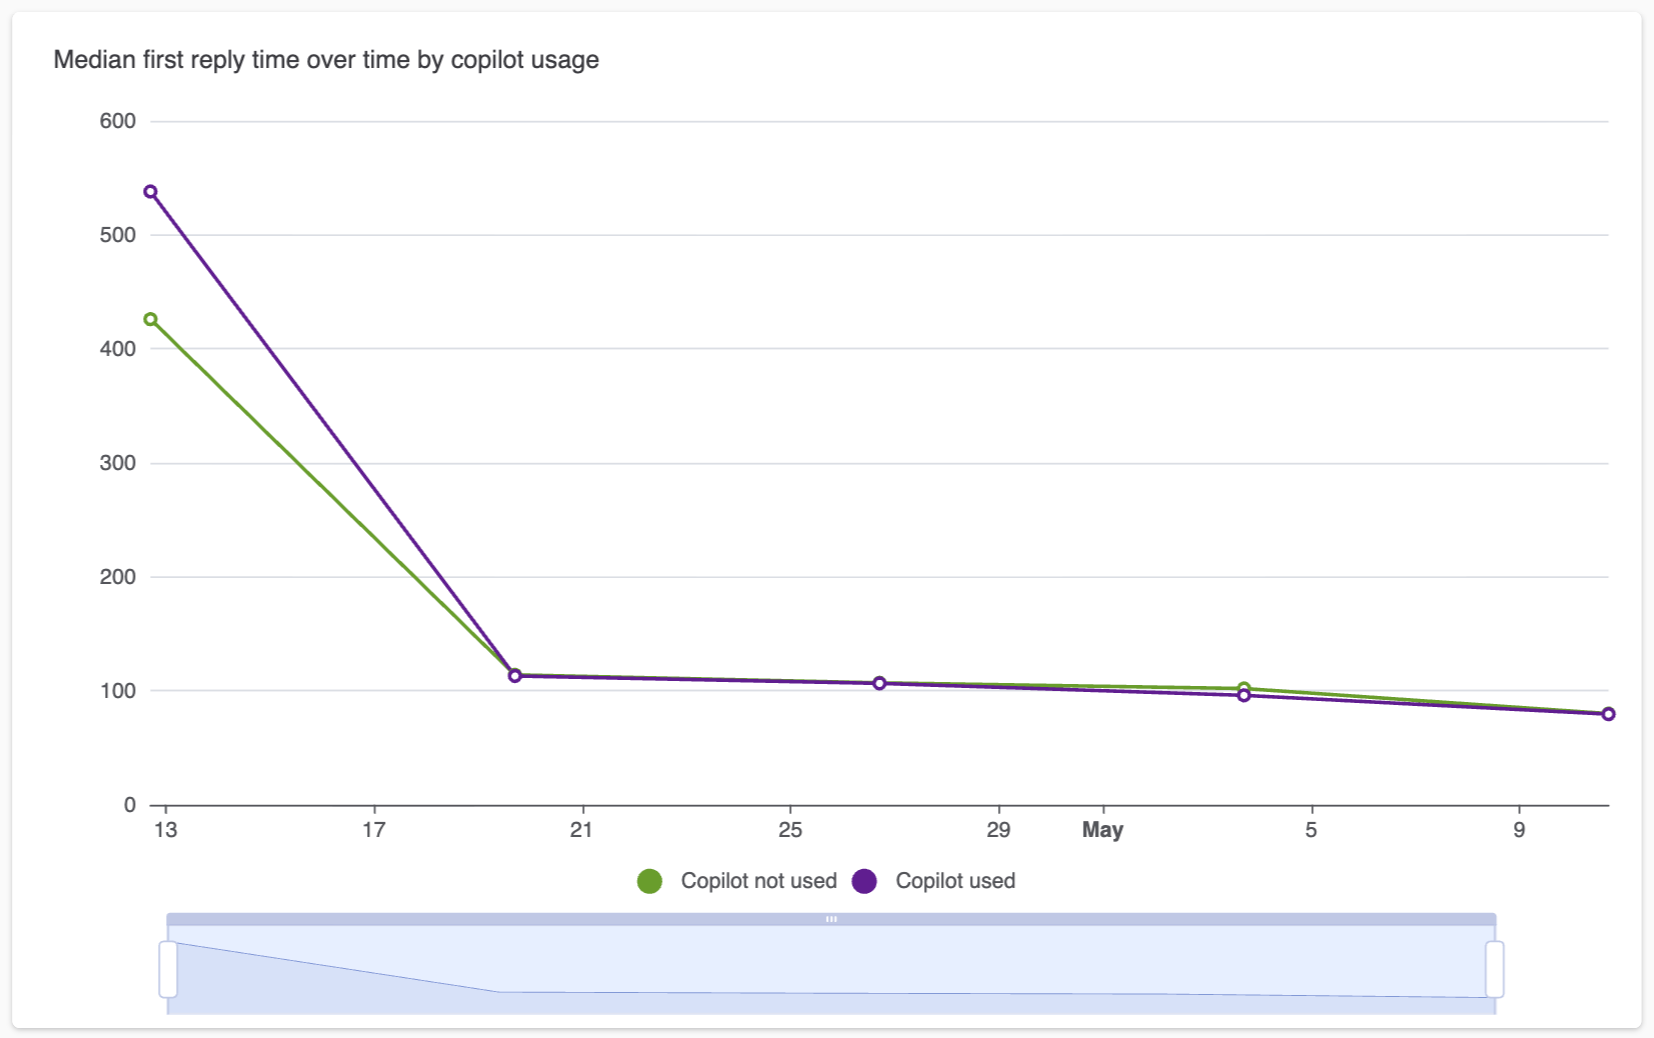
Median first reply time over time by copilot usage: A line chart
comparing the median first reply time with and without Copilot.
-
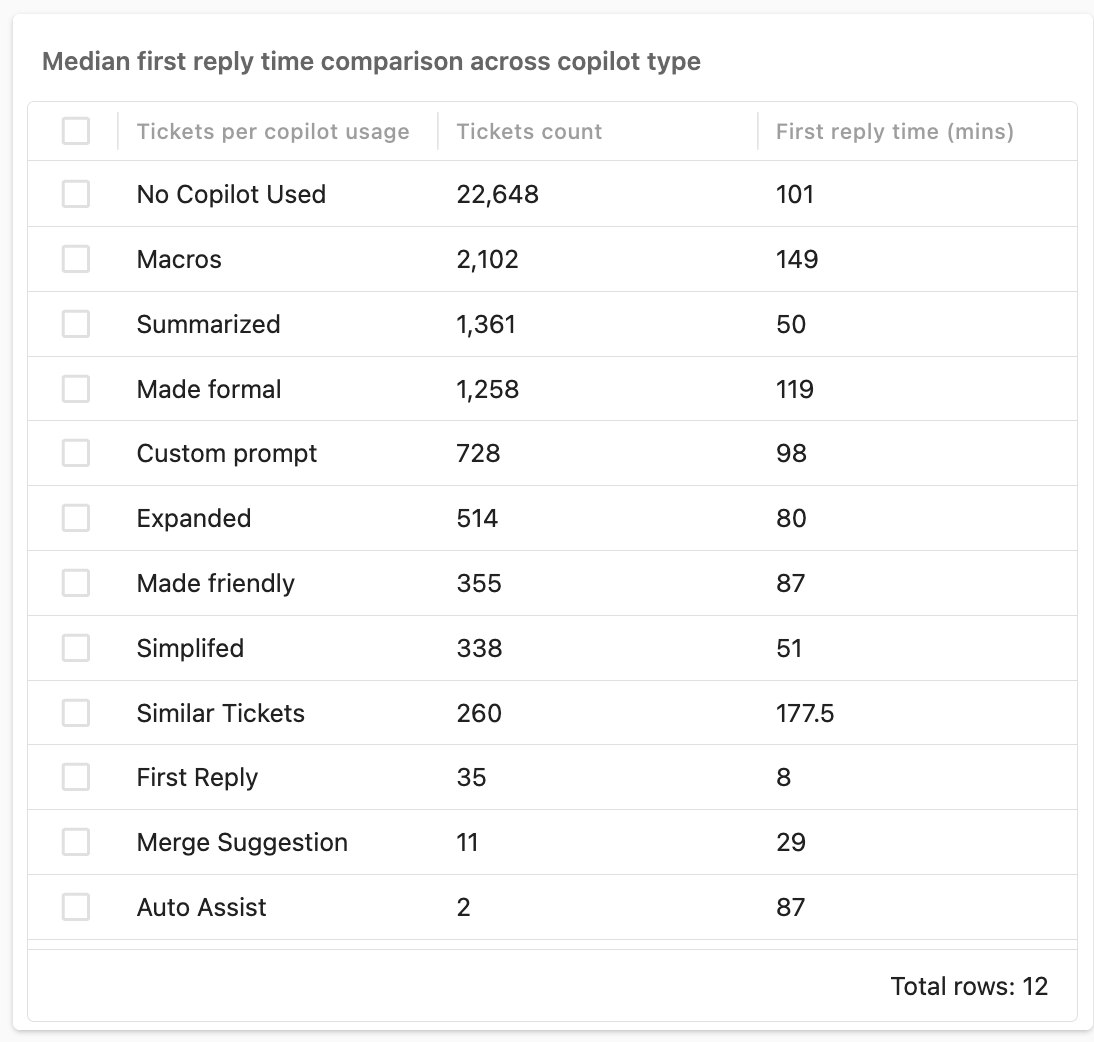
Median first reply time comparison across copilot type: A table
showing the number of tickets and the median first reply time sorted by
Copilot use type.
-
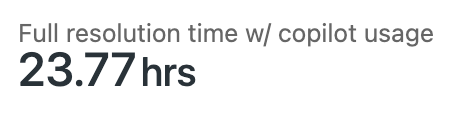
Full resolution time w/copilot usage: A KPI showing full
resolution time for tickets where Copilot was used.
-
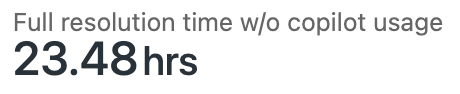
Full resolution time w/o copilot usage: A KPI showing full
resolution time for tickets where Copilot was not used.
-
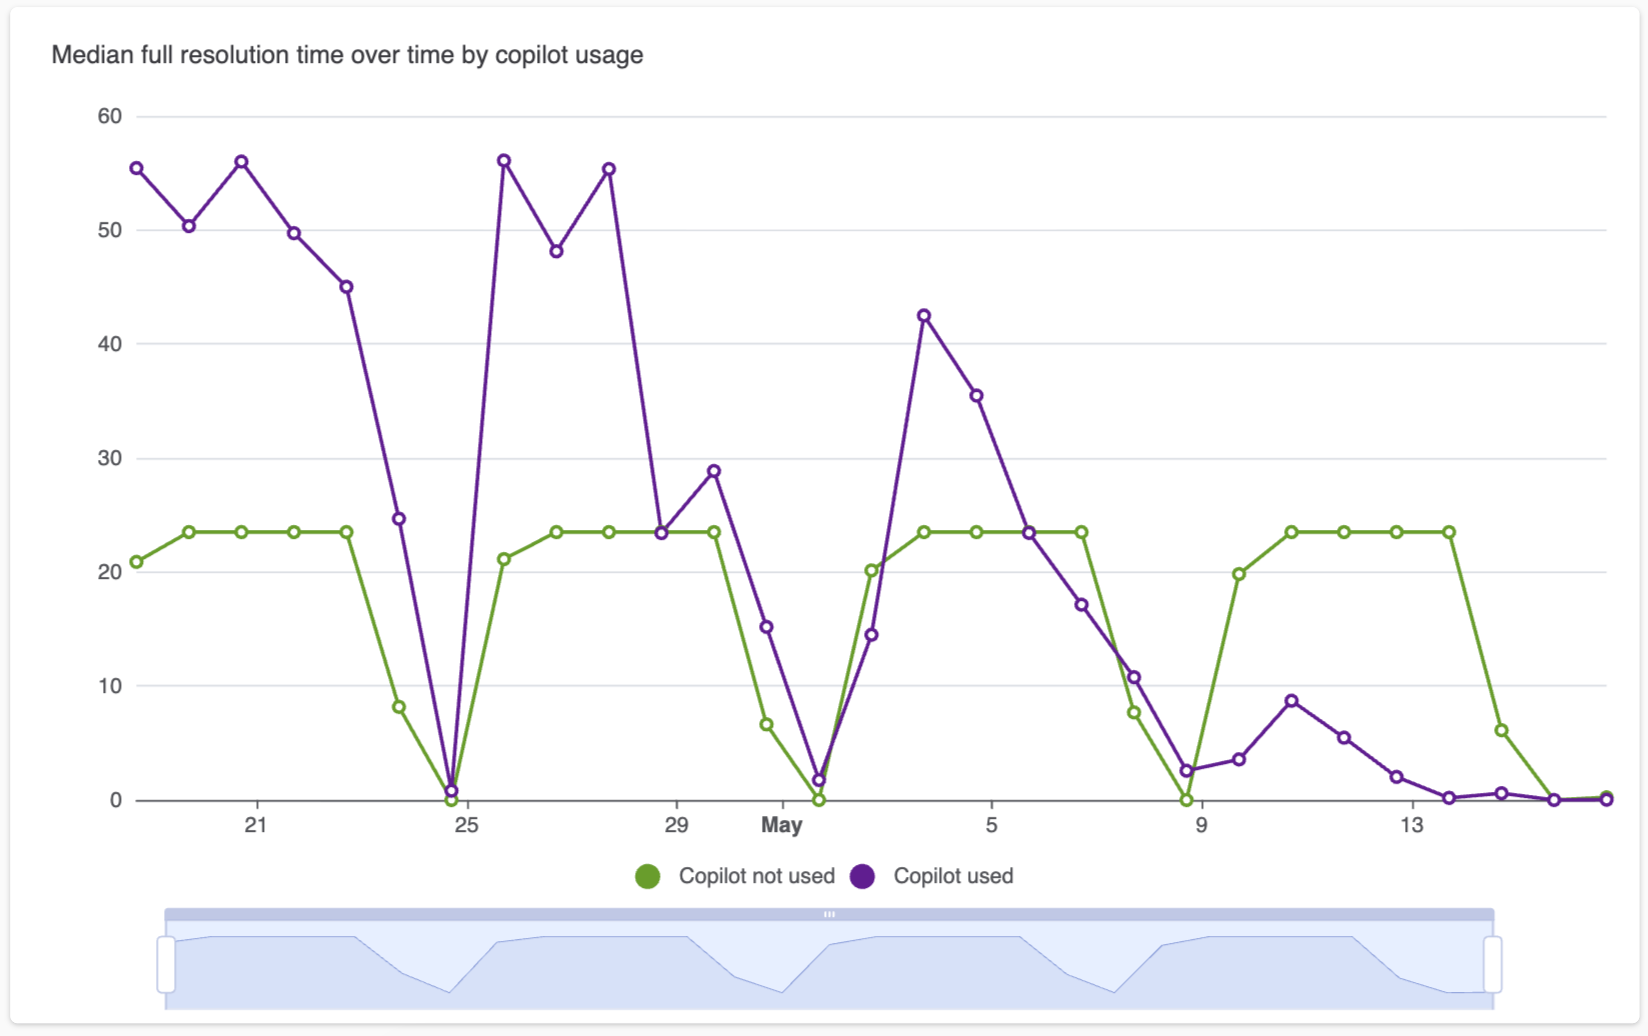
Median full resolution time over time by copilot usage: A line
chart comparing the median full resolution time with and without
Copilot.
-
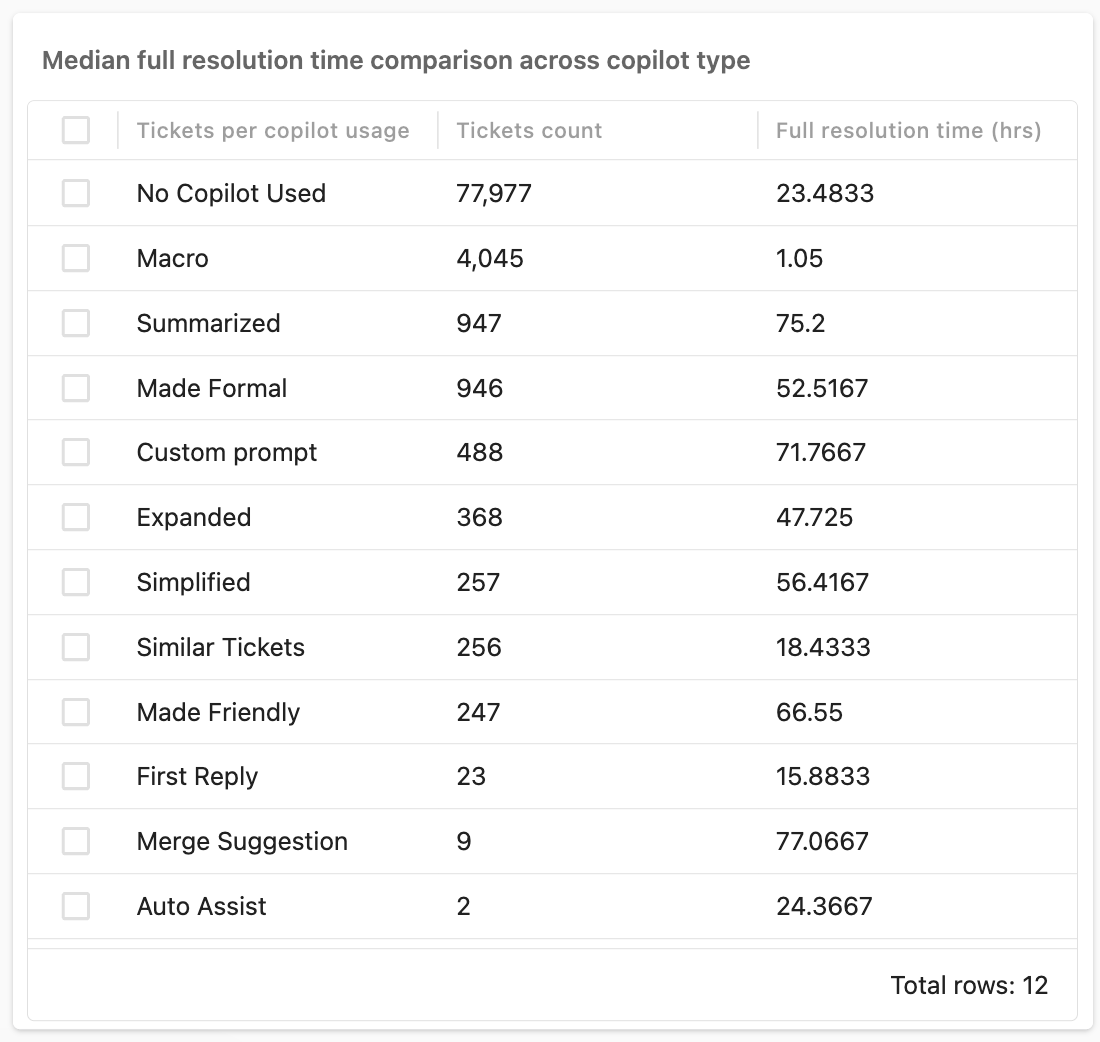
Median full resolution time comparison across copilot type: A
table showing the number of tickets and the median full resolution time
sorted by Copilot use type.
Understanding the auto assist tab
The auto assist tab contains reports about agents' usage and acceptance of auto assist suggestions.
Auto assist reports
The auto assist tab contains the following reports:
-
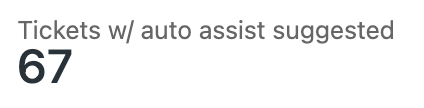
Tickets w/auto assist suggested: A KPI displaying the number of
tickets where auto assist made a suggestion.
-
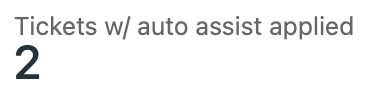
Tickets w/auto assist applied: A KPI displaying the number of
tickets where an auto assist suggestion was applied.
-
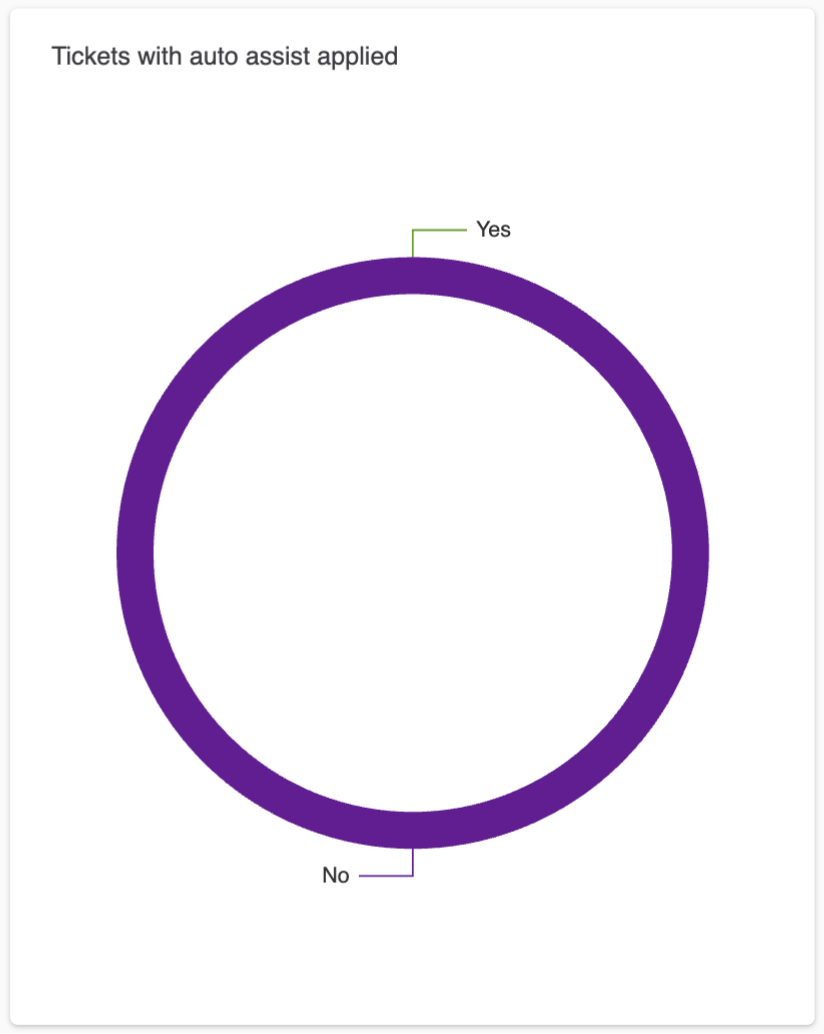
Tickets with auto assist applied: A donut chart displaying all
tickets split by which ones did, or did not have an auto assist
suggestion applied.
-
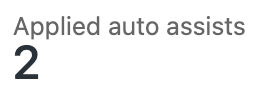
Applied auto assists: A KPI displaying all auto assist
suggestions that were applied.
-
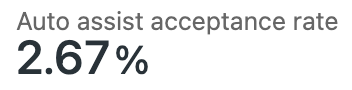
Auto assist acceptance rate: A KPI displaying the percentage of
auto assist suggestions that were applied.
-
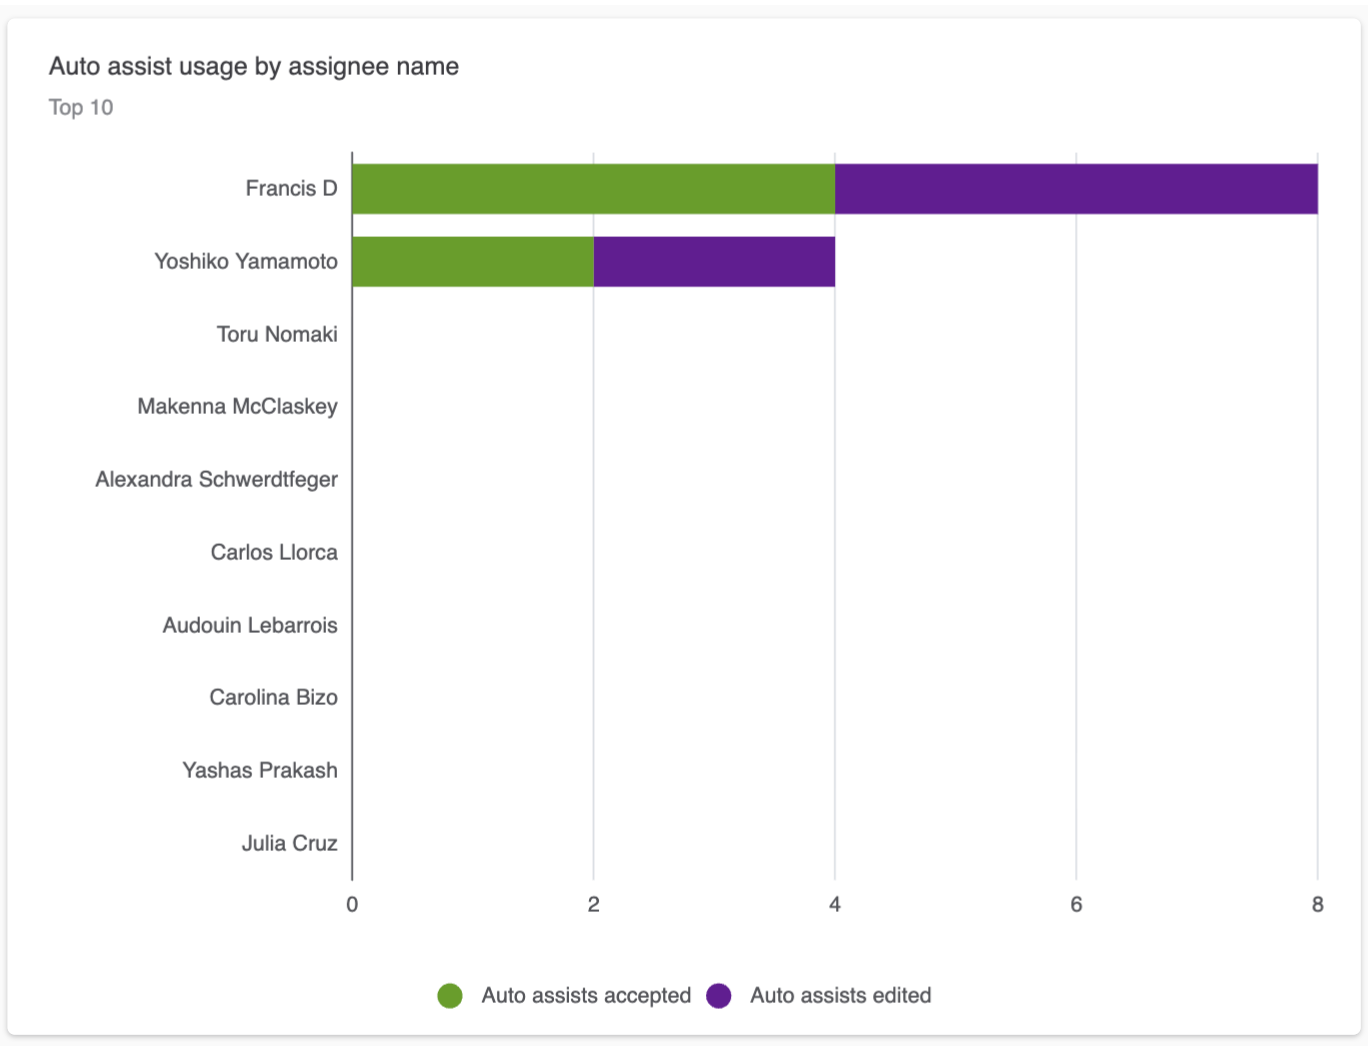
Auto assist usage by assignee name: A stacked bar chart
displaying the top 10 agents who accepted or edited an auto assist
suggestion.
-
Procedures adoption and performance: A table displaying the
number of auto assist procedures applied by auto assist.

Understanding the AI suggestions tab
The AI suggestions tab contains reports about agents' usage and acceptance of suggestions from AI features including merging suggestions, quick answers, similar tickets, suggested first replies, and suggested macros.
AI suggestions reports
The AI suggestions tab contains the following reports:
-
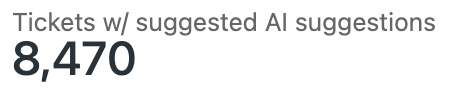
Tickets w/ suggested AI suggestions: A KPI displaying the number
of tickets where an AI suggestion was offered at least once.
-
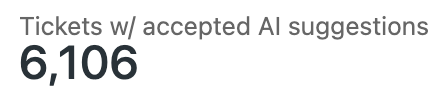
Ticket w/accepted AI suggestions: A KPI displaying the number of
AI suggestions accepted by agents.
-
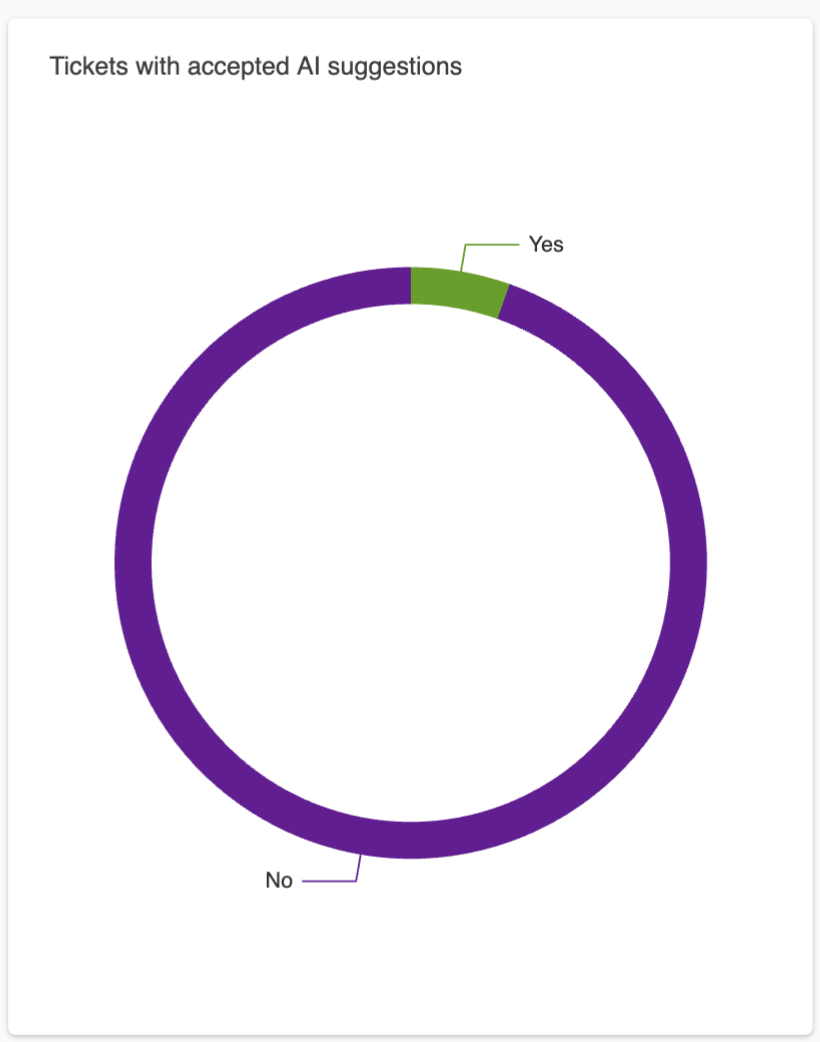
Tickets with accepted AI suggestions: A donut chart displaying
the number of tickets with and without AI suggestions.
-
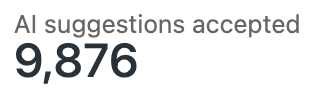
AI suggestions accepted: A KPI displaying the number of AI
suggestions accepted by agents.
-
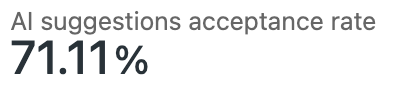
AI suggestions acceptance rate: A KPI displaying the number of AI
suggestions that were accepted, divided by the total number of AI
suggestions shown.
-
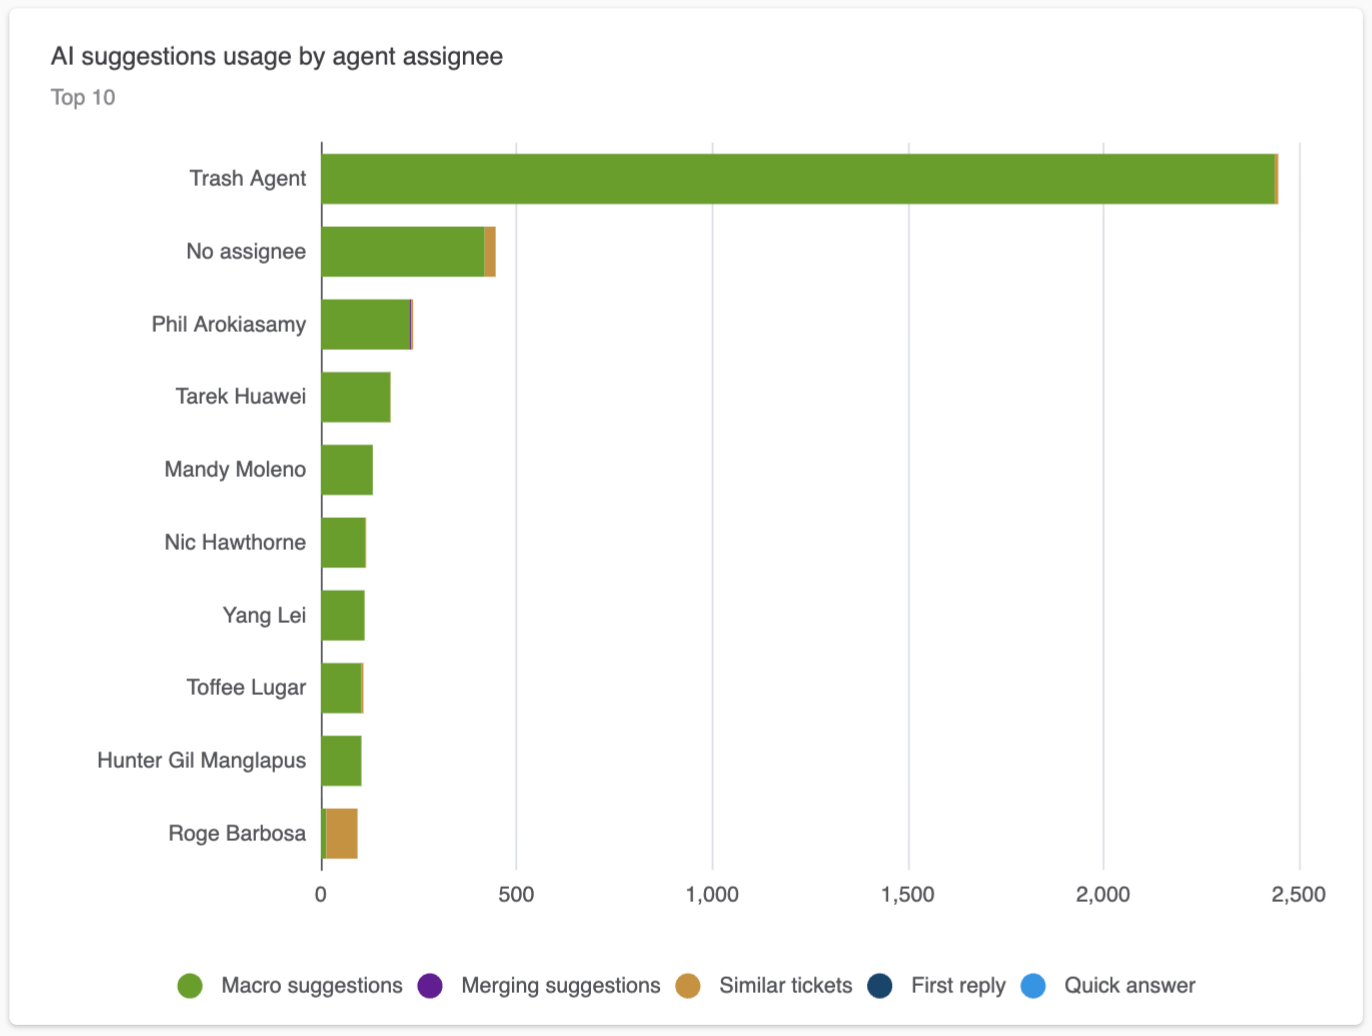
AI suggestions usage by agent assignee: A stacked bar chart
displaying the top agents by tickets they worked on with AI suggestions
shown at least once.
-
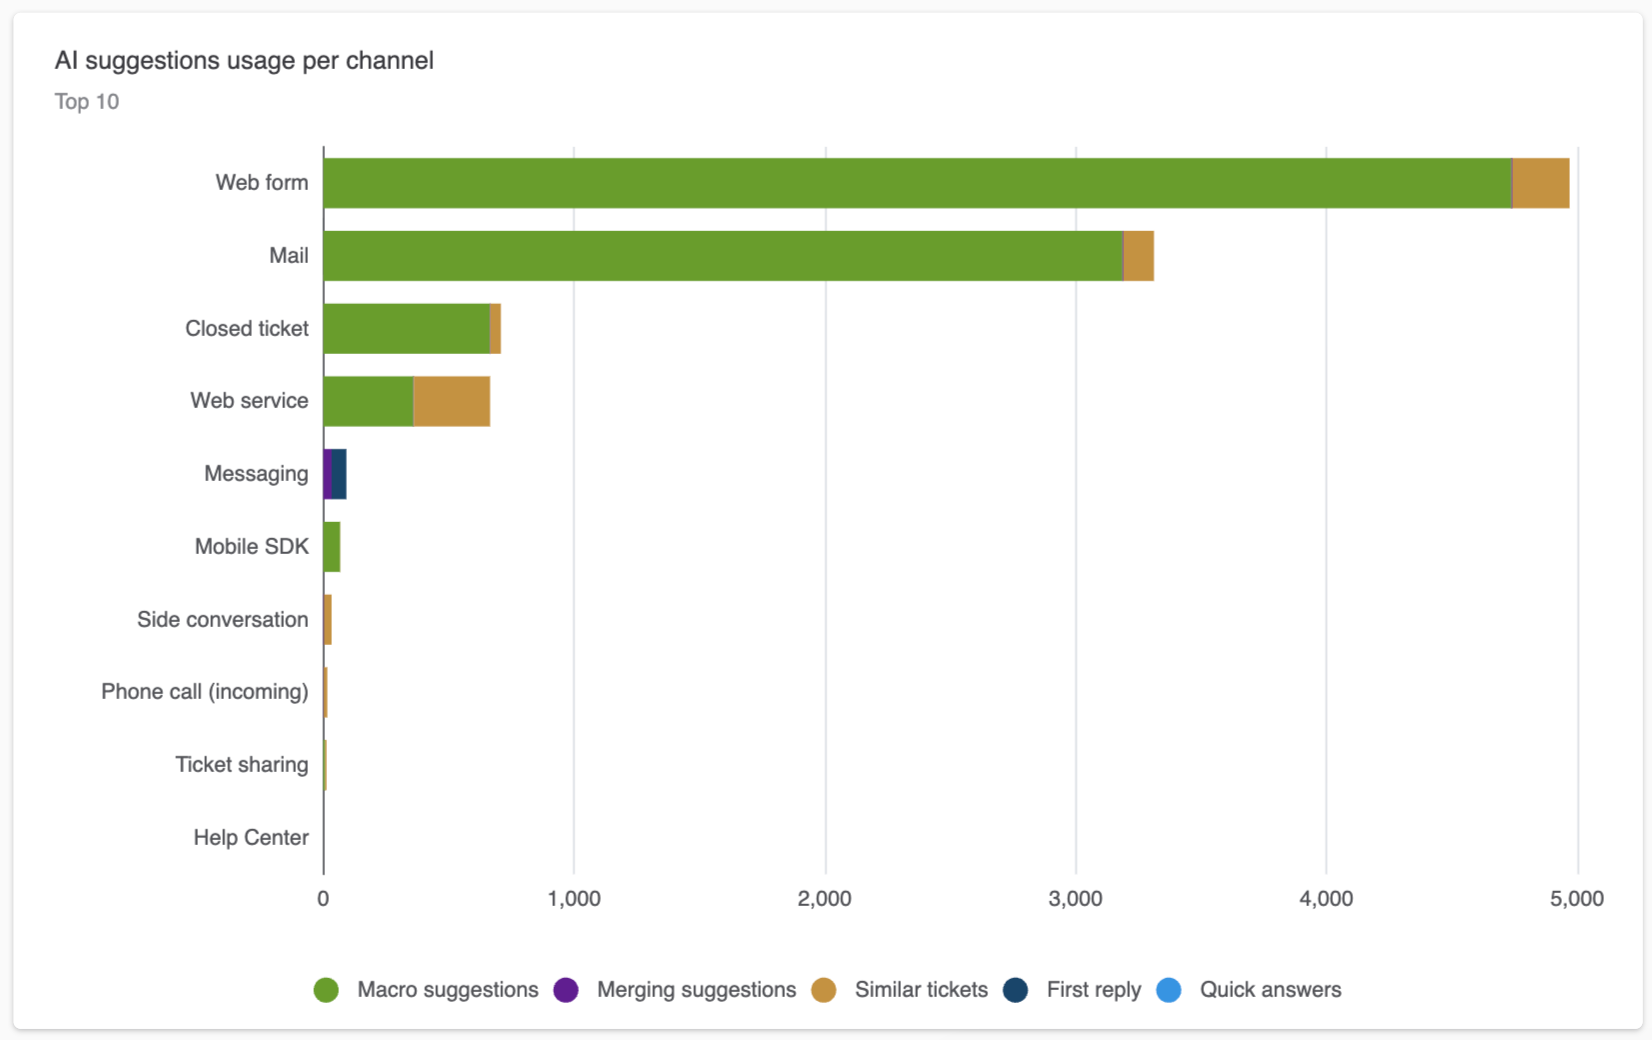
AI suggestions usage per channel: A stacked bar chart displaying
the top channels where AI suggestions were shown at least once.
-
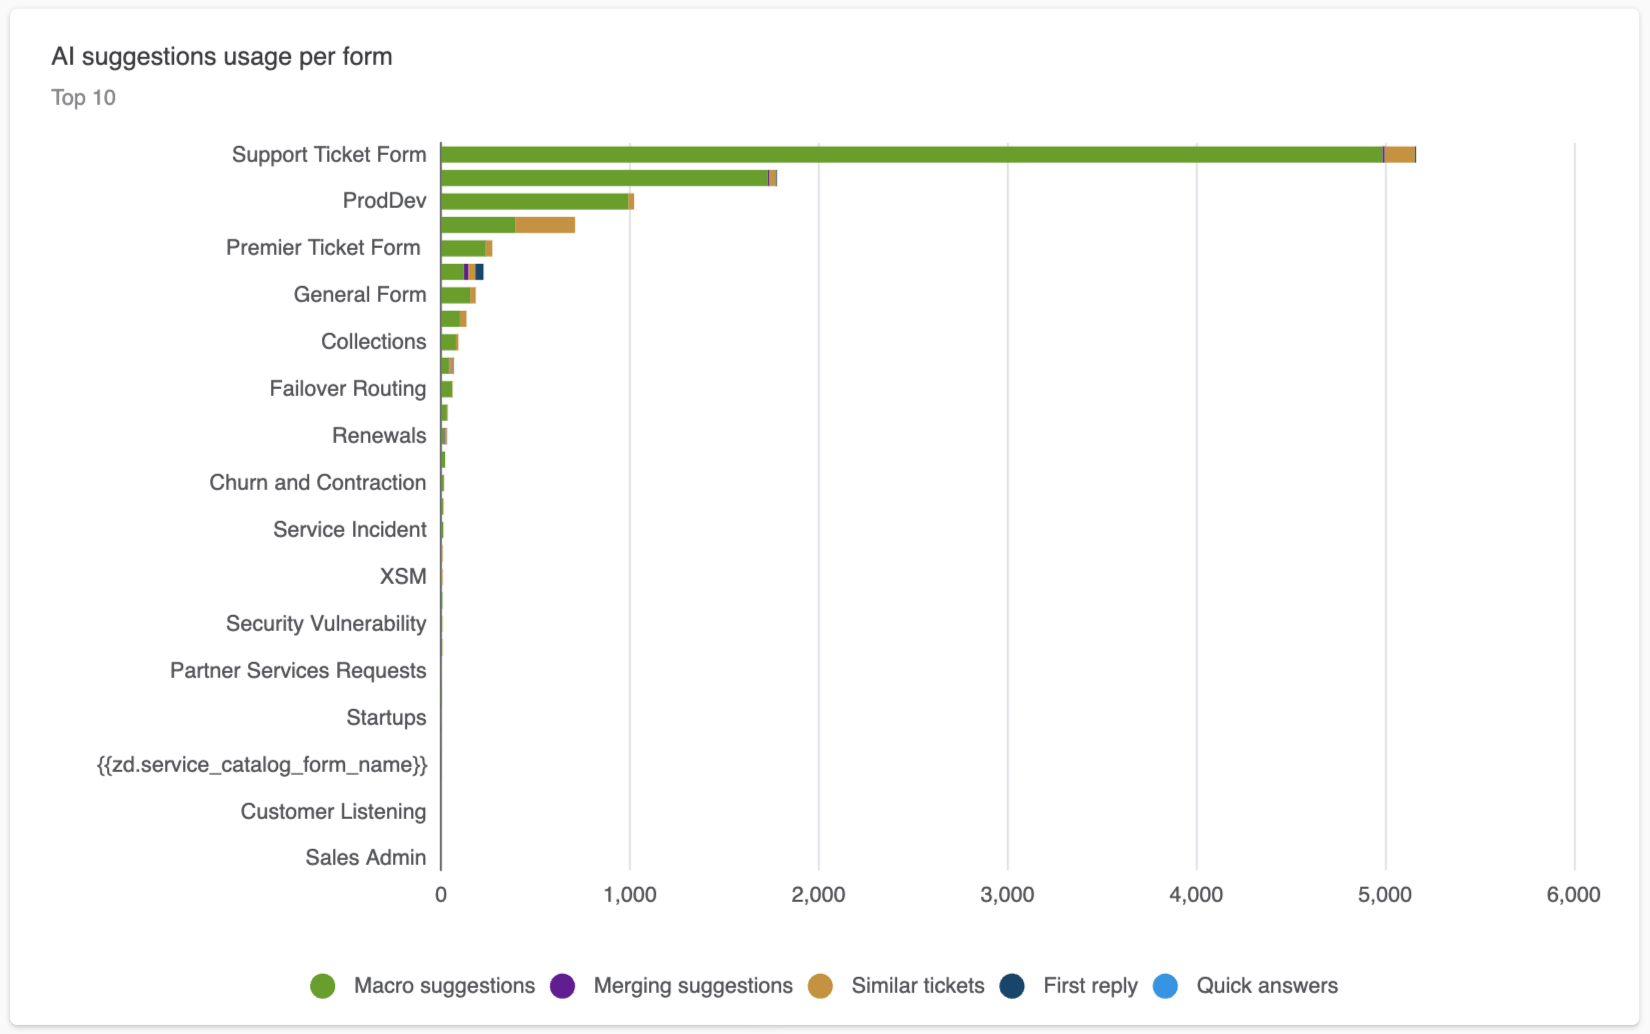
AI suggestions usage per form: A stacked bar chart displaying the
top ticket forms where AI suggestions were shown at least once.
Understanding the enhanced writing tab
The enhanced writing tab contains reports about how the feature was used to improves the content of agent comments and macros. For more information about enhanced writing tools, see About Zendesk Copilot.
Enhanced writing tab reports
The enhanced writing tab contains the following reports:
-
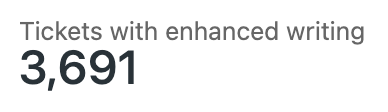
Tickets with enhanced writing: A KPI displaying the number of
tickets for which enhanced writing was used.
-
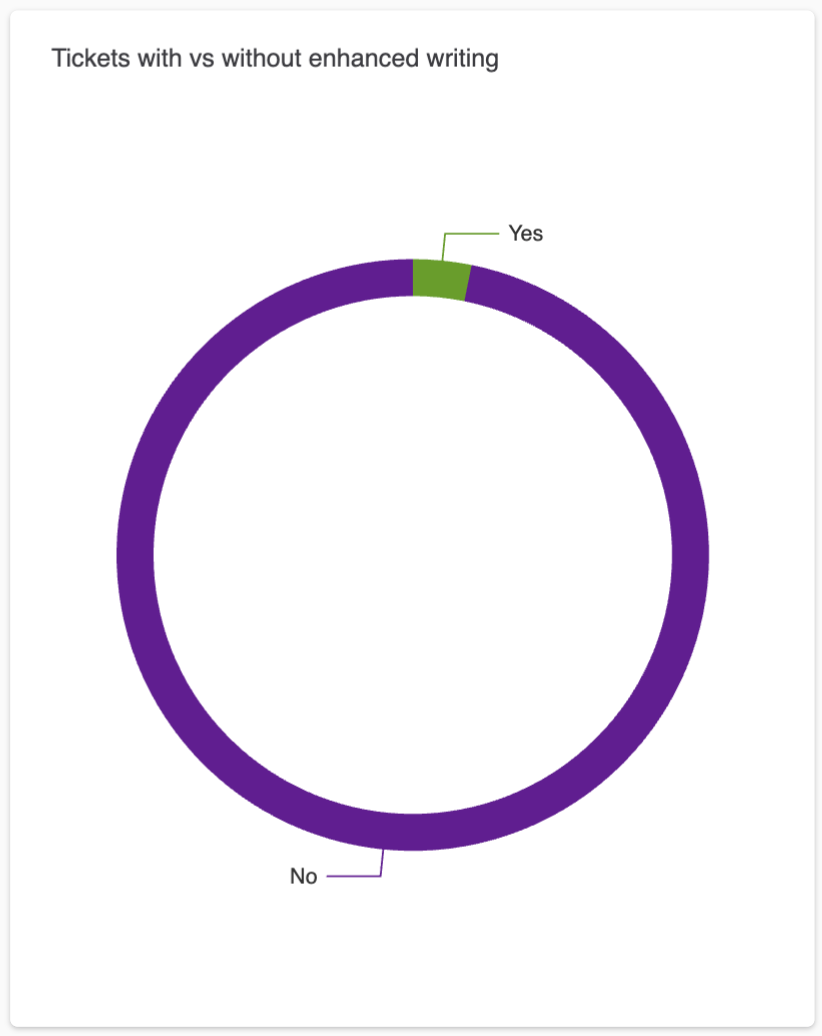
Tickets with vs without enhanced writing: A donut chart showing
the number of tickets that did and did not use enhanced
writing.
-
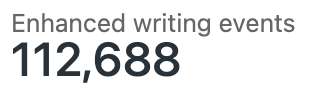
Enhanced writing events: A KPI displaying the number of times
that enhanced writing was used.
-
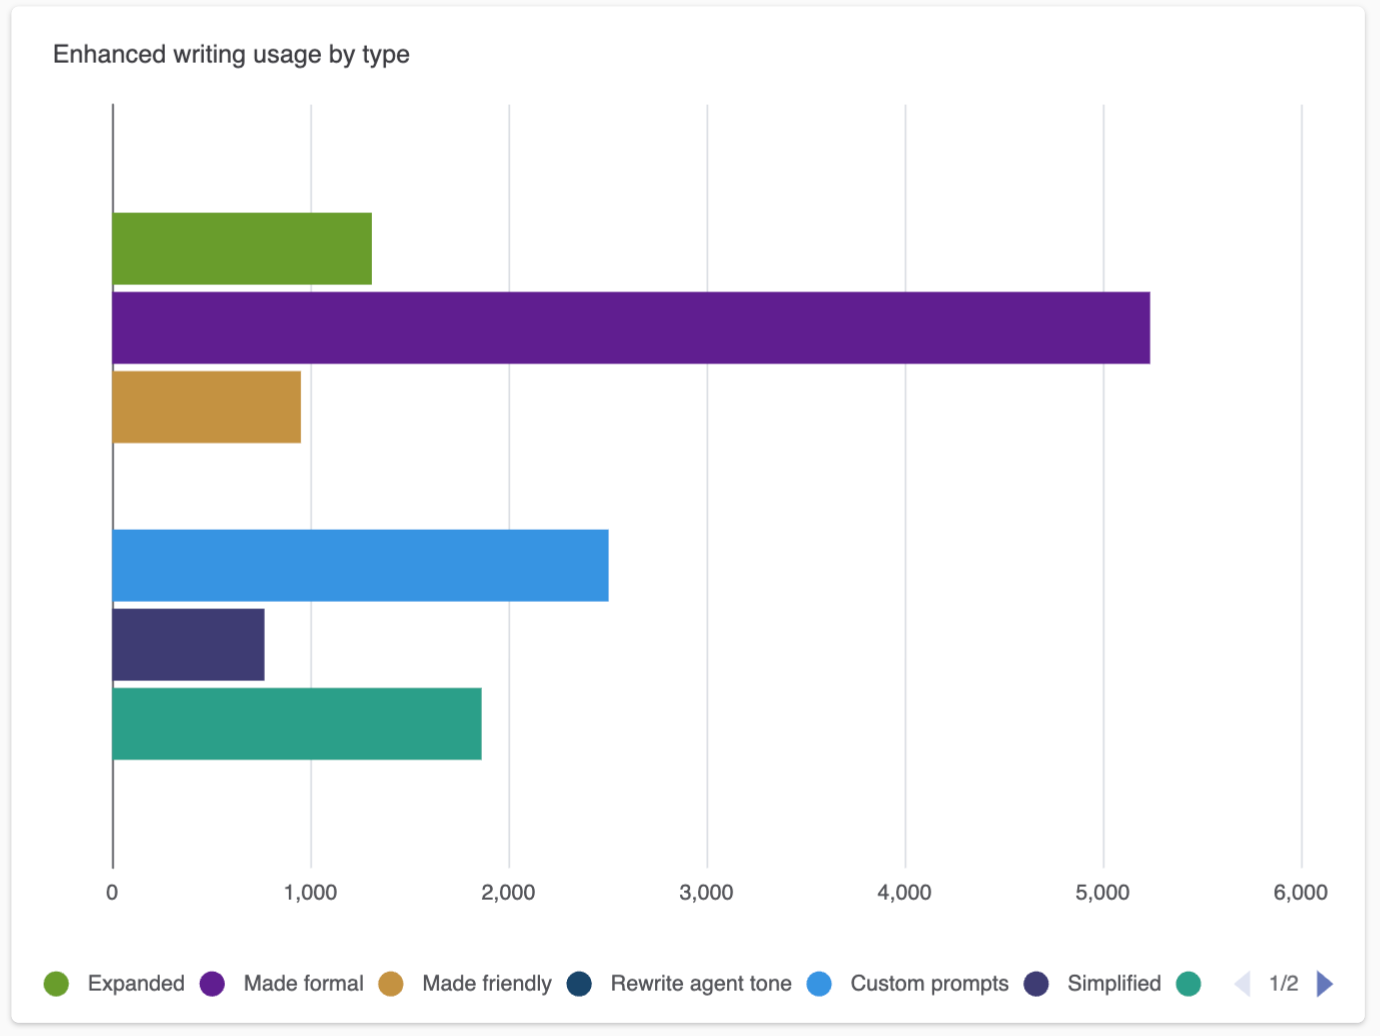
Enhanced writing usage by type: A bar chart displaying the number
of times that enhanced writing was used broken down by type, for
example, "Make formal" or "Make friendly".
-
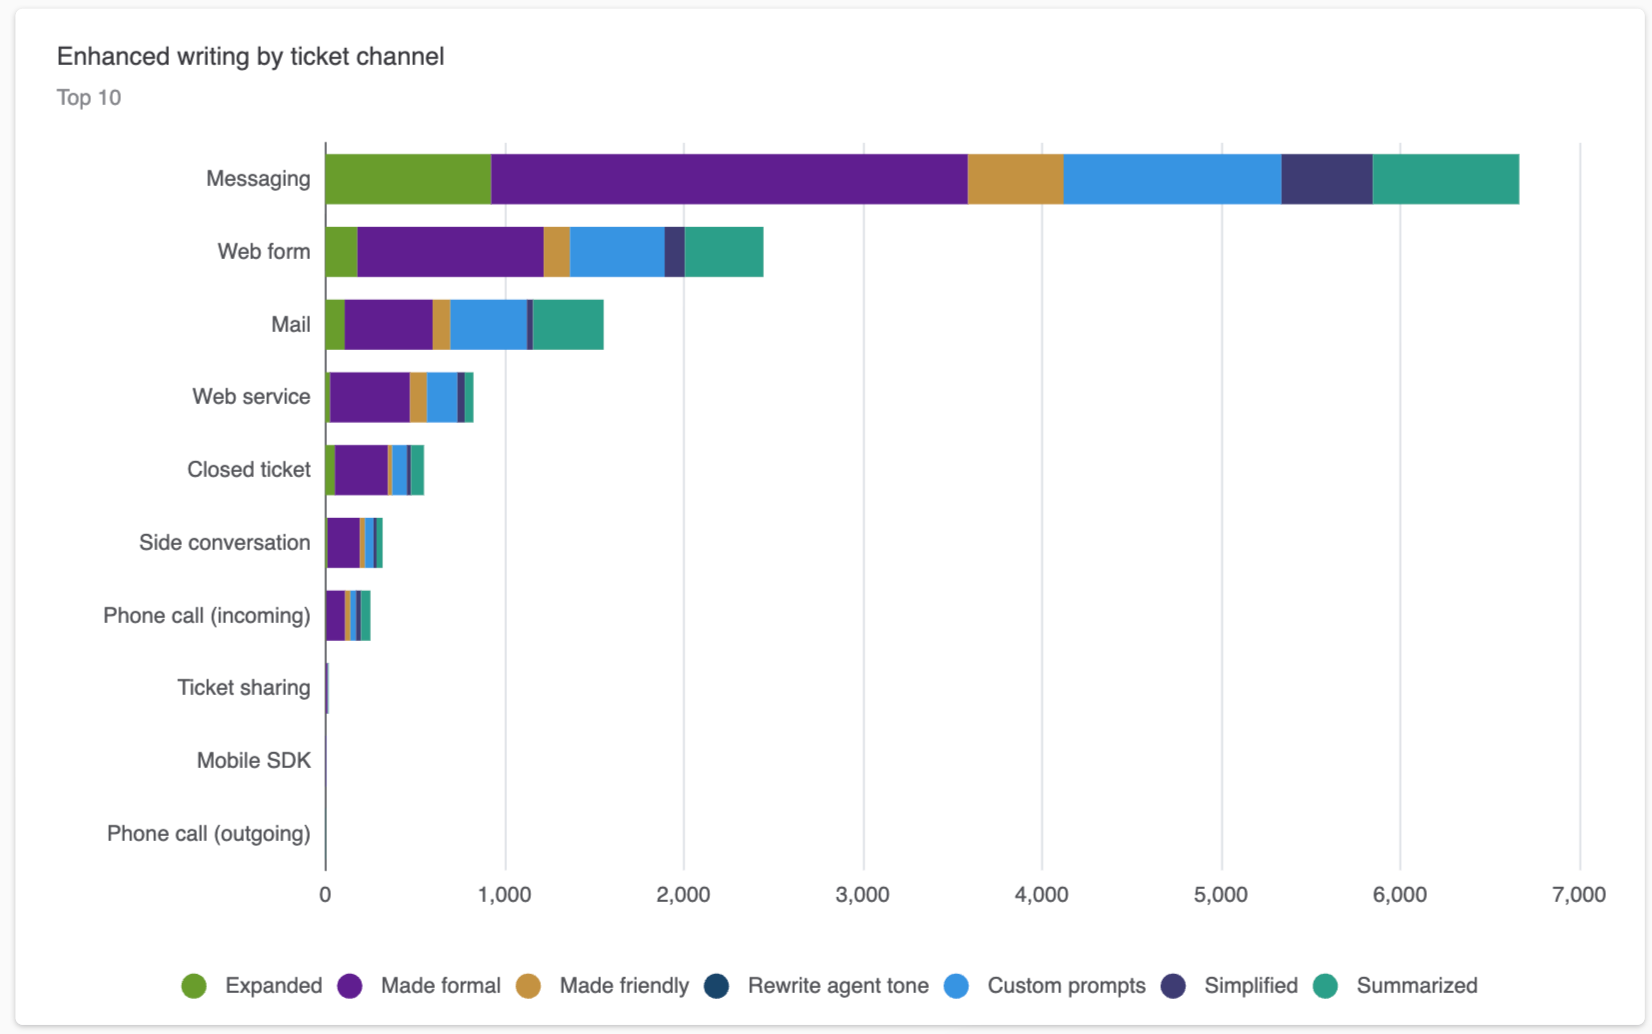
Enhanced writing by ticket channel: A stacked bar chart
displaying the number of times that enhanced writing was used broken
down by channel.
-
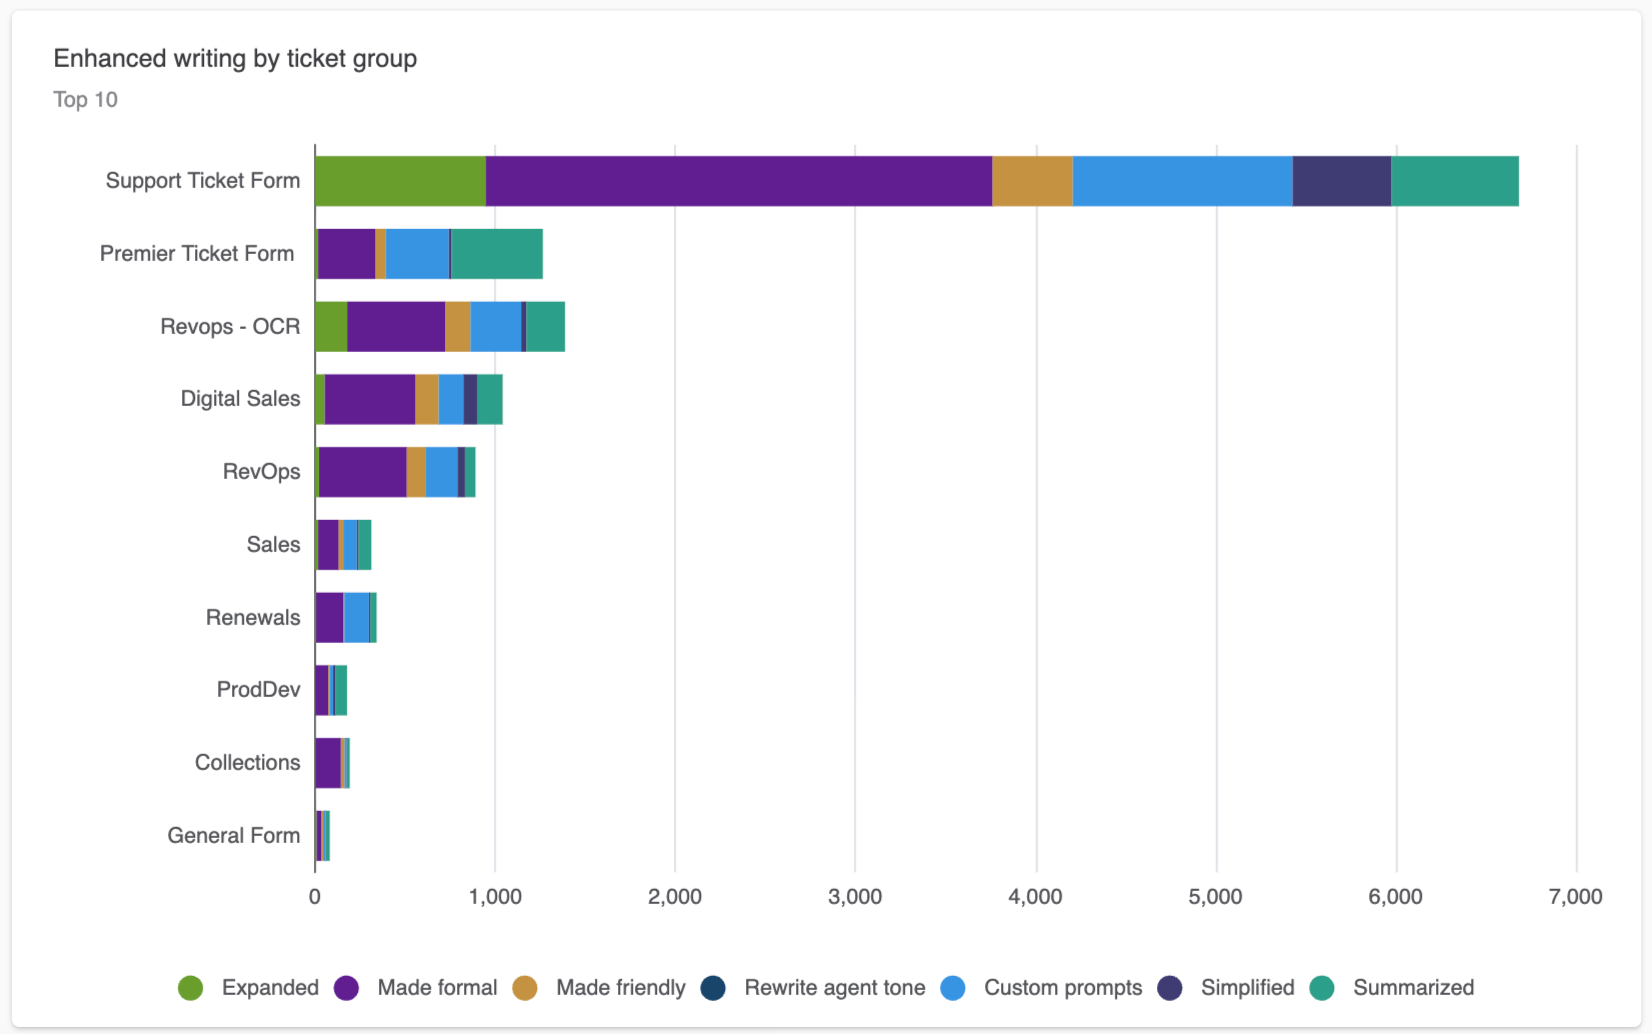
Enhanced writing by ticket group: A stacked bar chart displaying
the number of times that enhanced writing was used broken down by
group.