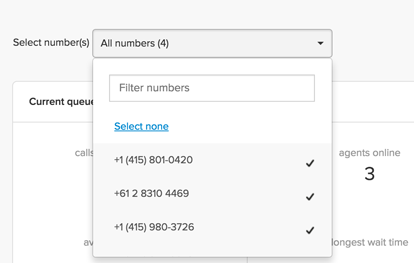
With the Talk Team dashboard, you can view details about current queue activity, account-wide activity for the current day, and individual agent activity. Filter by numbers or agent groups to get further insight.
This article covers the Talk Team dashboard. If you use Talk Professional or Enterprise, see Analyzing call activity with the Talk Professional dashboard.
Accessing the Talk dashboard
For Team plans, you can view the Talk dashboard in two ways:
To view the Talk dashboard
- In Admin Center, click
 Channels in the sidebar, then select Talk and email > Talk.
 - On the Talk settings page, click Dashboard.
To view the dashboard, your account must be a member of the Admin or Team lead Talk role in the Zendesk Admin Center. Support Enterprise customers can control access to dashboards by creating custom roles with the Can view Zendesk Talk dashboard permission though to interact with the dashboard, you'll still need to be a member of the Admin or Team lead Talk role. To learn how to configure roles for your users, see Giving agents access to Talk.
Select the number or numbers you want to view data for.

Viewing current queue activity
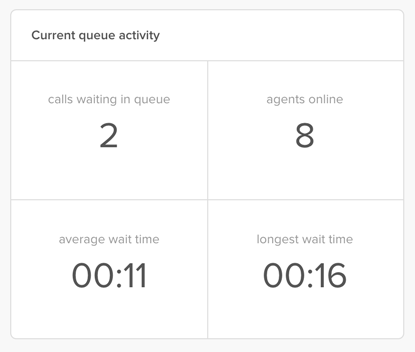
In the Current queue activity section, you can see real-time details about your call queue. For details on each metric, see Zendesk Talk dashboard metrics reference.

Viewing an overview of account call data
The Overview section displays additional metrics on your account's call activity from midnight to midnight for the current day. The time zone is based on your account settings.

The Overview section updates every five minutes or when you refresh the page in your web browser.
For details on Overview metrics, see Zendesk Talk dashboard metrics reference.
Viewing agent activity for Talk Team
The Agent Activity section shows a summary of call activity and current availability status for each agent. For details on the metrics in this section, see Zendesk Talk dashboard metrics reference.

- Narrow down groups in the drop-down menu.

- Change an agent's availability status next to their name.
