Verified AI summary ◀▼
Use the BotQA dashboard to track your AI agent's performance, focusing on metrics like escalation rates, repetition, and sentiment. Filter data by time, bot, and conversation outcome to gain insights. The dashboard helps you identify areas for improvement, such as high escalation rates or negative sentiment, ensuring your AI agents handle customer interactions effectively and reduce the need for human intervention.
The BotQA dashboard helps you understand important metrics about your AI agent’s performance, such as how often the bot's conversations were escalated to human agents, the bot got stuck in a loop, the bot’s communication efficiency was marked lower compared to an average agent’s, and the bot exhibited a negative sentiment.
Accessing the BotQA dashboard
You can access the BotQA dashboard from the list of dashboards in Zendesk QA.
- In Quality assurance, click Dashboards
 in the sidebar.
 - From the list of dashboards, select BotQA.
Filtering the BotQA dashboard
Dashboard filters allow you to narrow the data based on time period, specific bots, and conversation outcome. See About dashboards in Zendesk QA.
To filter the BotQA dashboard
-
In the BotQA dashboard, select from
the following filters:
- Date Filter: Select the relative or exact dates of the bot conversations for which you want to see data. By default, the dashboard returns data for the last month.
- Bot Name: Select one or more individual bots you want to see data for. By default, the dashboard returns data for all bots.
-
Conversation Outcome: Select bot-only to filter for conversations in which the user spoke with a bot only or escalated to filter for conversations in which the user requested to speak to a human agent.
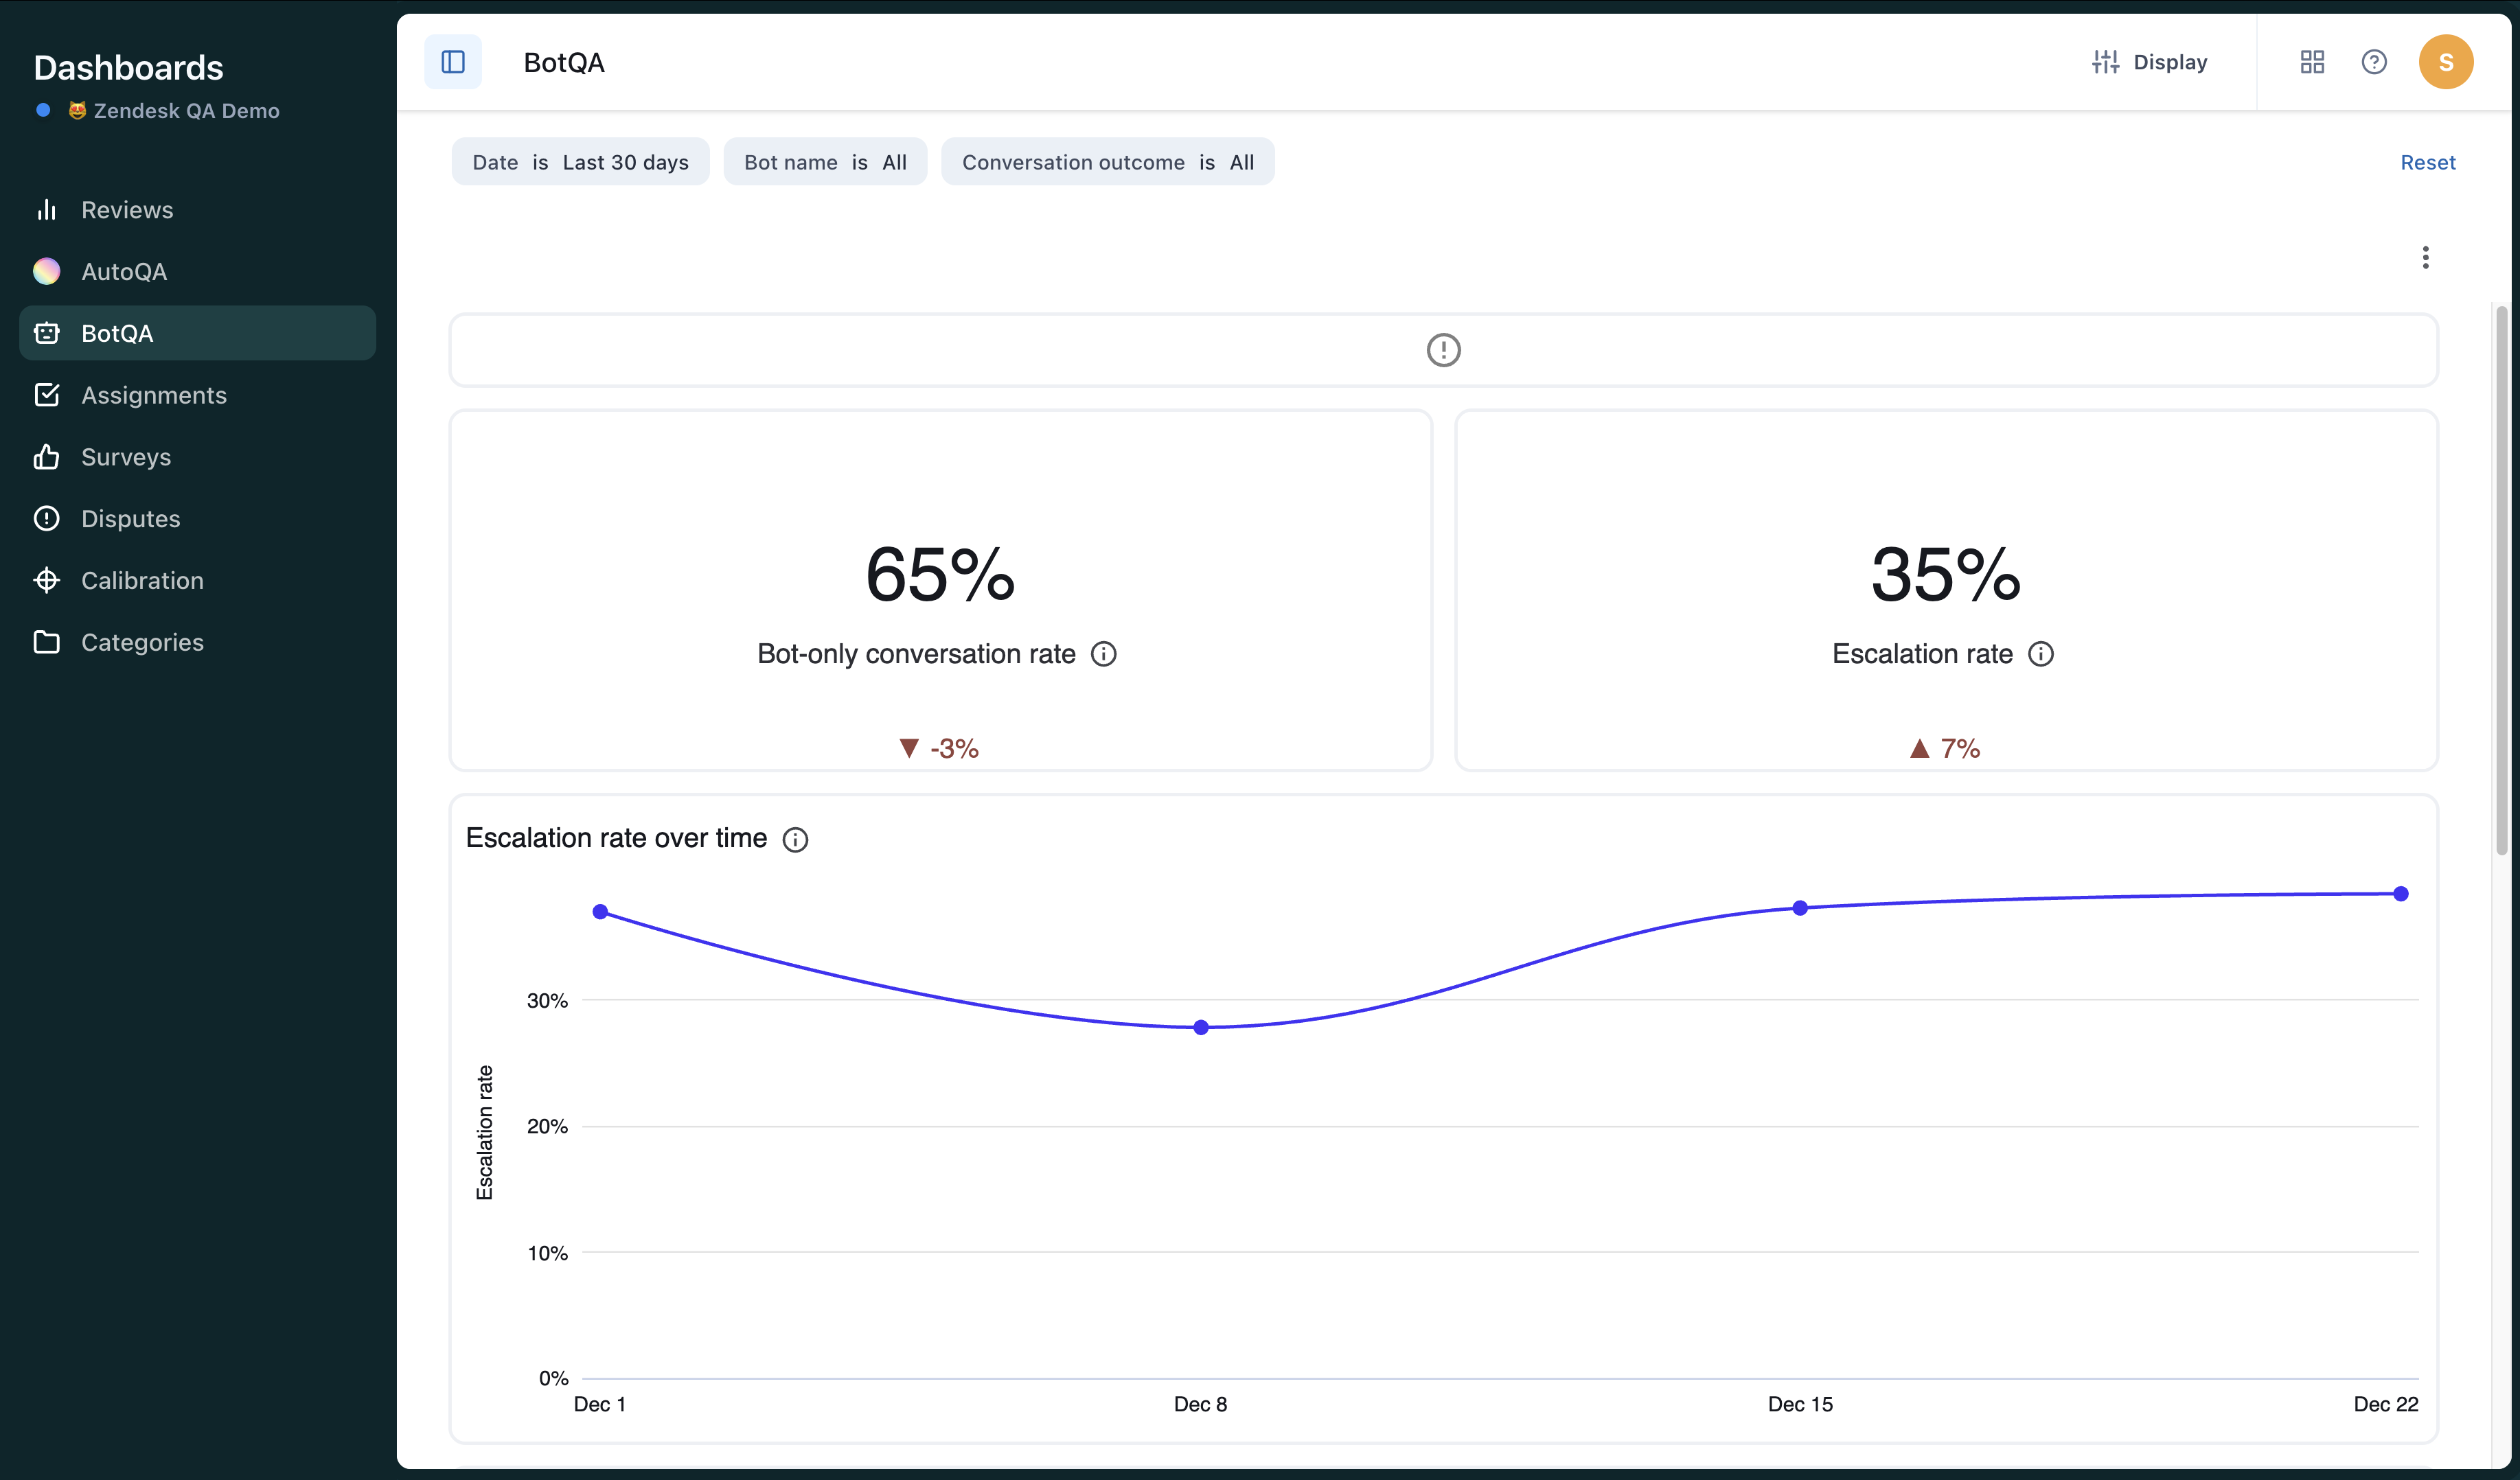
Understanding the BotQA dashboard
The BotQA dashboard contains the following reports:
-
Bot-only conversation rate: Percentage of conversations without human agent
involvement.

-
Escalation rate: Percentage of conversations in which the customer asked to talk
to a human agent.

-
Escalation rate over time: Percentage of conversations in which the customer
asked to talk to a human agent by week of conversation creation date.

-
Breakdown by conversation outcome: Comparison of the count of conversations
without human agent involvement (bot-only conversations) and the count of conversations
where the customer asked to talk to a human agent (escalated conversations).

-
Bot repetition rate: Percentage of conversations in which the bot gave the same
answer multiple times.

-
Bot low communication efficiency: Percentage of conversations in which the bot
handled the conversation at least 20% less efficiently than an average human
agent.

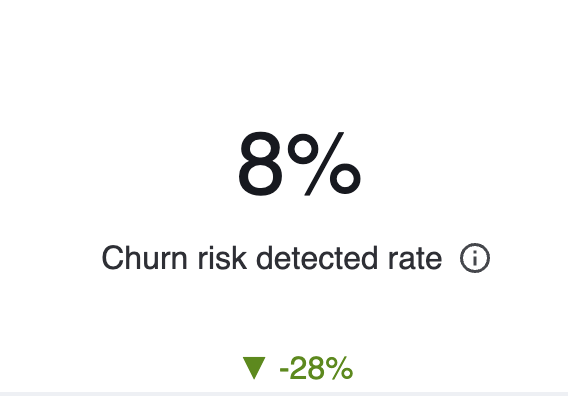
-
Churn risk detected rate: Percentage of conversations with the bot that showed
signs of customer attrition, where the customer considered switching or promised to
leave.
-
Bot negative sentiment rate: Percentage of conversations in which the bot
expressed dissatisfaction or frustration.

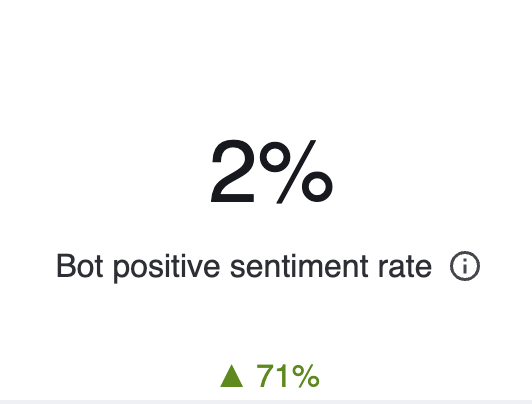
-
Bot negative sentiment rate: Percentage of conversations in which the bot expressed
satisfaction or positive sentiment.
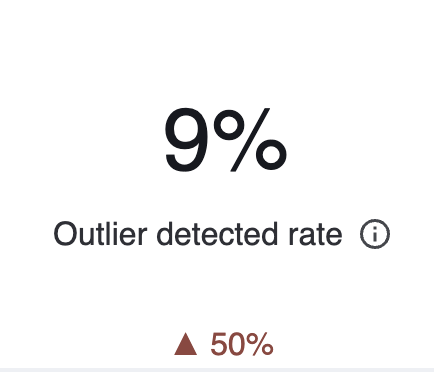
-
Outlier detected rate: Percentage of conversations involving the bot that were
unusual or atypical, involving more back-and-forth to reach a resolution.