Verified AI summary ◀▼
Dashboards in QA provide insights into your customer service quality. You can filter data to assess team performance, customize display settings, and download reports in CSV or PDF formats. Access additional data points by drilling down into specific metrics, and check the last data update time to ensure you're viewing the latest information. This helps you manage and improve your support operations effectively.
Dashboards in Zendesk QA offer valuable insights into the quality of your customer service. They allow you to view, customize, and download reports that give you an overview of your Zendesk QA data.
Use dashboard filters to efficiently locate the data necessary for assessing and enhancing your team's performance.
This article contains the following topics:
Using dashboard filters
Dashboards display a list of filters that help you analyze the data in your workspaces and quickly find the information you need. You can apply one or more filters to your workspaces.
To apply dashboard filters
- In Quality assurance, click
 Dashboards in the sidebar.
 - The following dashboards are available in Zendesk QA, depending on your permissions:
- Select the filters you want to apply from the filter row on the top. The default filter
applied is Last 30 days.
Click the plus sign (
 ) to access additional filters.
See Understanding dashboard filters.
Tip: The system reverts to the default filter and resets all applied filters every time you visit a different page in Zendesk QA. To save your dashboard filters for your next visit, you can use browser bookmarks, such as Google Chrome bookmarks. - (Optional) Click the display menu icon (
 ) in the top right to choose how to display your data
and which cards to show or hide on your dashboard. See Understanding the Display settings menu.
) in the top right to choose how to display your data
and which cards to show or hide on your dashboard. See Understanding the Display settings menu. - (Optional) Click the options menu (
 ) to download your filtered data.
 - (Optional) Click Reset to clear all applied filters.
Understanding the Display settings menu
Use the display settings menu icon (![]() ) in the top right corner to select how to display your
data and which cards and charts to display or hide on your dashboard.
) in the top right corner to select how to display your
data and which cards and charts to display or hide on your dashboard.
The data varies by dashboard but can include:
- Conversation created date
- Review created date
Self-reviews:
- Exclude self-reviews
- Include self-reviews
- Show only self-reviews
Date granularity:
- Day
- Week
- Month
- Quarter
Assign CSAT score to:
- Owner of the ticket
- Agent with most replies
Display data based on:
- CSAT survey reply date
- Conversation creation date
- CSAT survey sent date
Survey chart attribute:
- Survey response reason
- Survey response language
- Survey response predicted driver
- Conversation channel
- Conversation source
- Conversation tag
Understanding dashboard filters
Depending on the dashboard you select, you can apply the following filters:
| Filter name | Description |
| Date filter | Select a time period. By default, the dashboard returns data for the last
month. See Time period
selection. Dates are also determined based on the Display settings selection. |
| Workspaces | Choose your workspaces. This filter displays results based on selected workspaces. You'll see data only for workspaces that you are a member of. |
| Reviewer | The user giving the review. |
| Reviewee | The user receiving the review. |
| Group | Allows you to select a group. Using groups helps you avoid selecting multiple
agents each time you want to see a group's performance. This filter limits the options to conversations in which reviewees and reviewers from those groups participated. For example, filtering the reviews dashboard by a group returns reviews submitted by users in that group or reviews received by users in that group. This means users who aren’t part of the group can still appear in the results if they receive reviews from someone in the group or submit reviews for someone in the group. |
| Scorecard | Allows filtering by scorecard if multiple scorecards are available. |
| Category | Display results based on selected categories. |
| Connection name | Choose your connection (for example, if you're using multibrand Zendesk instances). |
| Hashtag | Report on the hashtags left in the Zendesk QA comment section. |
| Helpdesk tag | Filter by connection ticket tag. |
| Conversation channel | Display results based on the conversation channel. For example, only email reviews. |
| Assignment name | Access manual review data based on active assignments that are accessible to you. |
| Helpdesk field and value | Filter by ticket fields. |
| Root cause | Select one or more root causes. |
| Root cause tier | Select one or more root cause tier. |
| Root cause sub-tier | Select one or more root cause sub-tier. |
| Language | Display results based on selected conversation languages. |
| Rating category | Display results based on selected autoscoring categories. |
| Participant type | Bot or user. |
| Connection | Display results based on connections. |
| Rating score | Display results based on selected rating score values. |
| Low bot communication efficiency | Show results based on if the low bot communication efficiency insight is detected or not. |
| Bot repetition | Display results based on whether bot repetition insights are detected. |
| Churn risk | Display results based on whether churn risk insights are detected. |
| Escalation | Display results based on whether escalation insights are detected. |
| Exceptional service | Display results based on whether extra mile insights are detected. |
| Follow-up | Display results based on whether follow up insights are detected. |
| Outlier | Display results based on whether outlier insights are detected. |
| Dead air | Display results based on whether dead air lasting longer than the set threshold was detected in voice conversations. |
| Recording disclosure missing | Display results based on whether the speaker disclosed that the voice conversation was being recorded. |
| Sentiment | Display results based on whether sentiment insights are positive or negative. |
| Helpdesk tag | Display results based on ticket tags . |
| Call | Display results for voice calls only, text-based interactions (chats and emails) only, or both. |
| Coaches | The users who provided coaching. |
| Coachees | The users who were coached. |
Time period selection
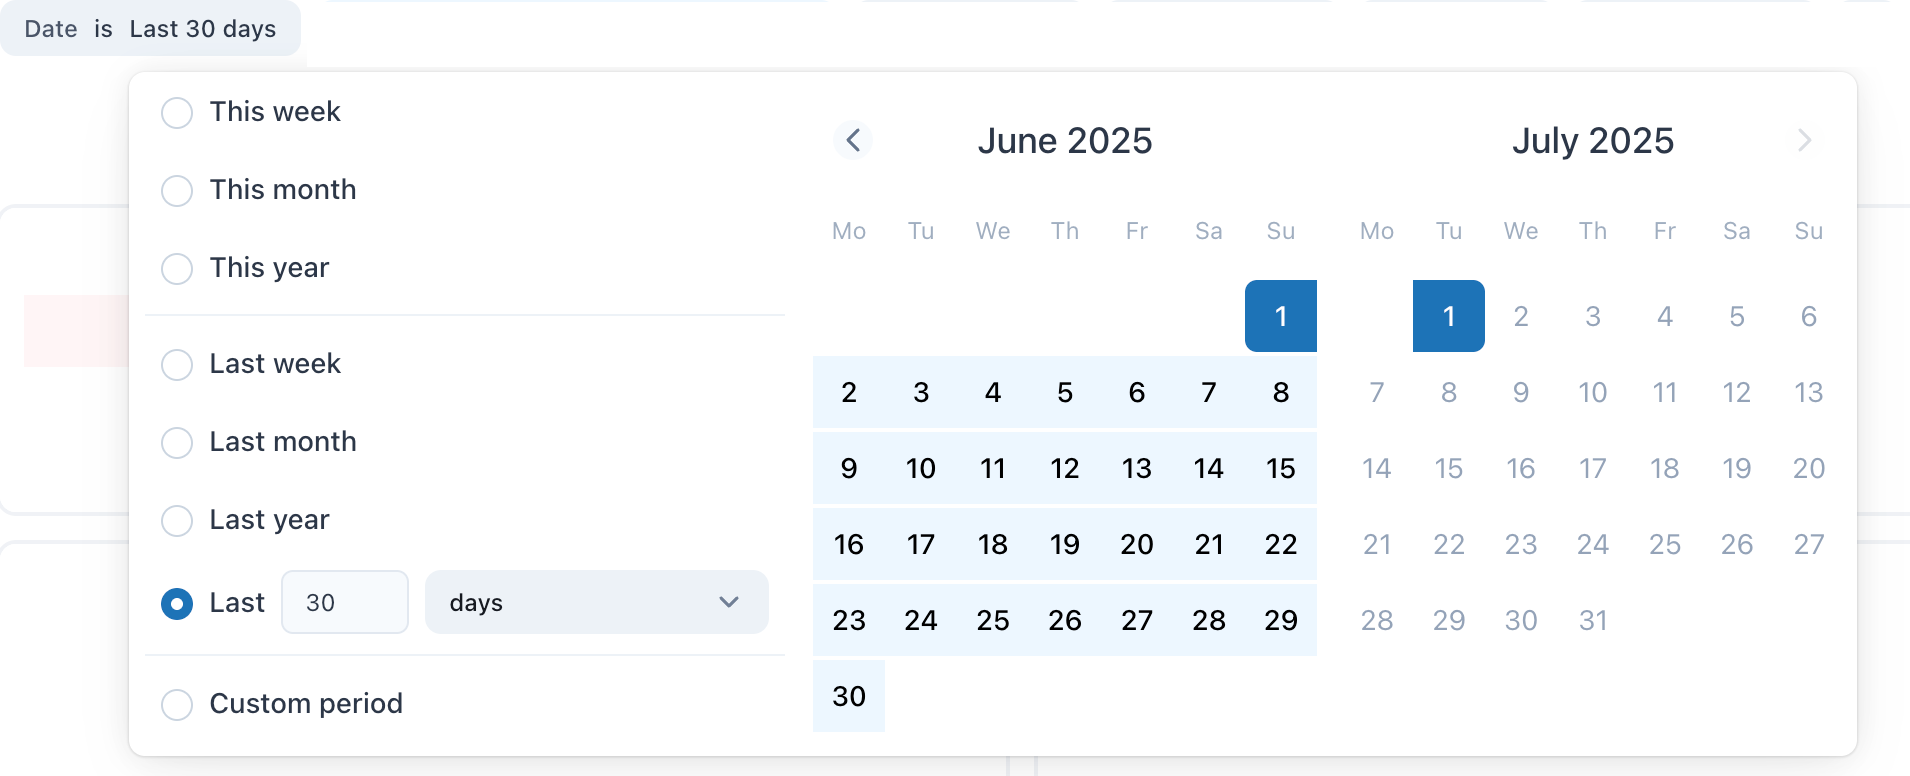
- "This" date range selections: Include today as one of the days counted for this week, month, or year.
- "Last" date range selections: Include the current day, week, month, quarter, or year. For example, defining the custom period "Last 3 days" returns data for the day before yesterday, yesterday, and through the end of today. It includes today as one of the three days. Similarly, "Last 2 months" returns data for the current and previous months.
- Custom period: The date range picker provides a calendar that allows you to select both a start date and an end date. The selected date range includes both the start and end dates. Double-click on a date to select only that day.
Accessing additional data points
Access additional data points by drilling down into specific metrics.
To access additional data points on your dashboard
-
In Quality assurance, click
Dashboards in the sidebar.
- Click to open a dashboard.
- Click on any score, review, category, root cause, or conversation value to access the
list of associated reviewed conversations.
For example, click the percentage value displayed on the Reviews dashboard IQS card or the goal completion percentages in the Assignments dashboard to drill down into the data for each conversation.

You can also click a line on a score graph and use the dropdown menu to select a drill-down option:

- Explore the additional data points or click any conversation link to open it. Both the
review and conversation IDs are hyperlinked for easy navigation to specific review
conversations.

Downloading dashboard data
You can download data from your dashboards either as a whole or for individual cards. The data is available in CSV or PDF file formats.
Downloading all dashboard data
You can download the data from all your dashboard cards.
If the dashboard data is filtered, the download reflects the applied filters. However, hiding display data affects only the dashboard visualization; the data remains visible in CSV and PDF downloads.
To download the dashboard data
- In Quality assurance, click
Dashboards in the sidebar.
- Click a dashboard to open it.
- Click the options menu () in the top-right corner of the dashboard to
download your data.
- Select Download.
- Set the Format to either CSV or PDF.
If you select PDF, specify whether you want to expand tables to show all rows. Note that large tables may render as plain text or limit the number of displayed rows. Additionally, indicate if you want to arrange dashboard tiles in a single column.
If you select CSV, all dashboard cards will be downloaded as individual CSV files in a zip folder.
- Click Download.
Downloading dashboard data for a single card
You can download data individually for specific dashboard cards.
To download dashboard data for a specific card
- In Quality assurance, click
Dashboards in the sidebar.
- Click a dashboard to open it.
- Click the options menu () next to a card and select Download
data.
- Select Download data.
- Select a Format.

- By expanding the Advanced data options menu, you can choose whether to download
your results with visualization options applied or as displayed in the data table.
- With visualizations options applied: The download attempts to reflect any customizations made in the visualization, although it may not match exactly. This includes options such as re-labeling columns, hiding totals, or adding conditional formatting.
- As displayed in the data table: Includes more fields than those currently visible in your dashboard card.
- Data values: You can also choose whether to download your results with data values formatted (for example, rounding, special characters) or not.
-
Number of rows to include: You can specify the number of rows to include. Options include selecting the current result table, all results, or a custom number of rows.
The custom number of rows is limited to 5,000. This number can be increased by selecting All results.
- Click Download.
Accessing the dashboard’s last data update time
The Last data update time card of each dashboard allows you to see when the dashboard was last updated. Time is in UTC:

Dashboard data is updated approximately every 60 minutes. To find the last data update time for a dashboard, navigate to the dashboard. The last updated timestamp card is typically displayed at the top or bottom of the dashboard, or it can be enabled in the Display settings menu. Make sure to refresh the dashboard to view the most current update.