Verified AI summary ◀▼
Use the Surveys dashboard to analyze survey results and gain insights into customer support performance. You can filter data by question type, score, language, and more. The dashboard provides metrics like average score, score breakdown, and survey funnel, helping you understand response rates and feedback reasons. It also offers visual tools like word clouds and tracks agent performance over time.
The Surveys dashboard allows you to view and analyze the results of your surveys.
This article explains how to access and use the Surveys dashboard to gain valuable insights into your customer support performance.
This article contains the following topics:
Related articles:
Accessing and filtering the Surveys dashboard
Access the Surveys dashboard to analyze specific datasets and gain insights into your surveys performance.
To access and filter the Surveys dashboard
- In Quality assurance, click Dashboards
 in the sidebar.
 - Click the Surveys dashboard.
- (Optional) Select any filters you want to apply.
The Surveys dashboard offers the following additional filtering options to help you focus on specific data:
- Question type: The type of survey question (for example, CSAT, CES, or custom types), if applicable.
- Survey: Specific survey selection, if applicable.
- Score: The survey score.
- Response language: The language of survey responses.
- Source: Specific connection, if applicable.
- Helpdesk tag: Connection ticket tags, if applicable.
- Word cloud word: Specific words in comments.
- Comment size: Comment length (short, mid-length, long, very long).
-
Predicted drivers: AI-generated sentiment or reason filtering is
available for comments in English only. This feature helps you categorize customer
feedback comments into predefined categories, providing valuable insights into
customer sentiment and support performance.
Comments are tagged under the following content categories:
- Account
- Refund
- Bad support
- Bad product
- Bad outcome
- Good support
- Feedback for agent
- Complaint
- Confusing
- Crumbs
- Issue not solved
- Issue solved
- Negative sentiment
- Positive sentiment
- Praise
- Good support
- Support not helpful
- Fast support
- Slow support
- Thanks
- Reason for feedback: Manual categorization of feedback.
- Channel: Communication channel filtering.
- Helpdesk field: Custom field filtering for eligible accounts based on connection.
- Helpdesk value: Custom values filtering for eligible accounts based on connection.
Understanding the Surveys dashboard
The following cards are available in the Surveys dashboard to help you understand your survey results:
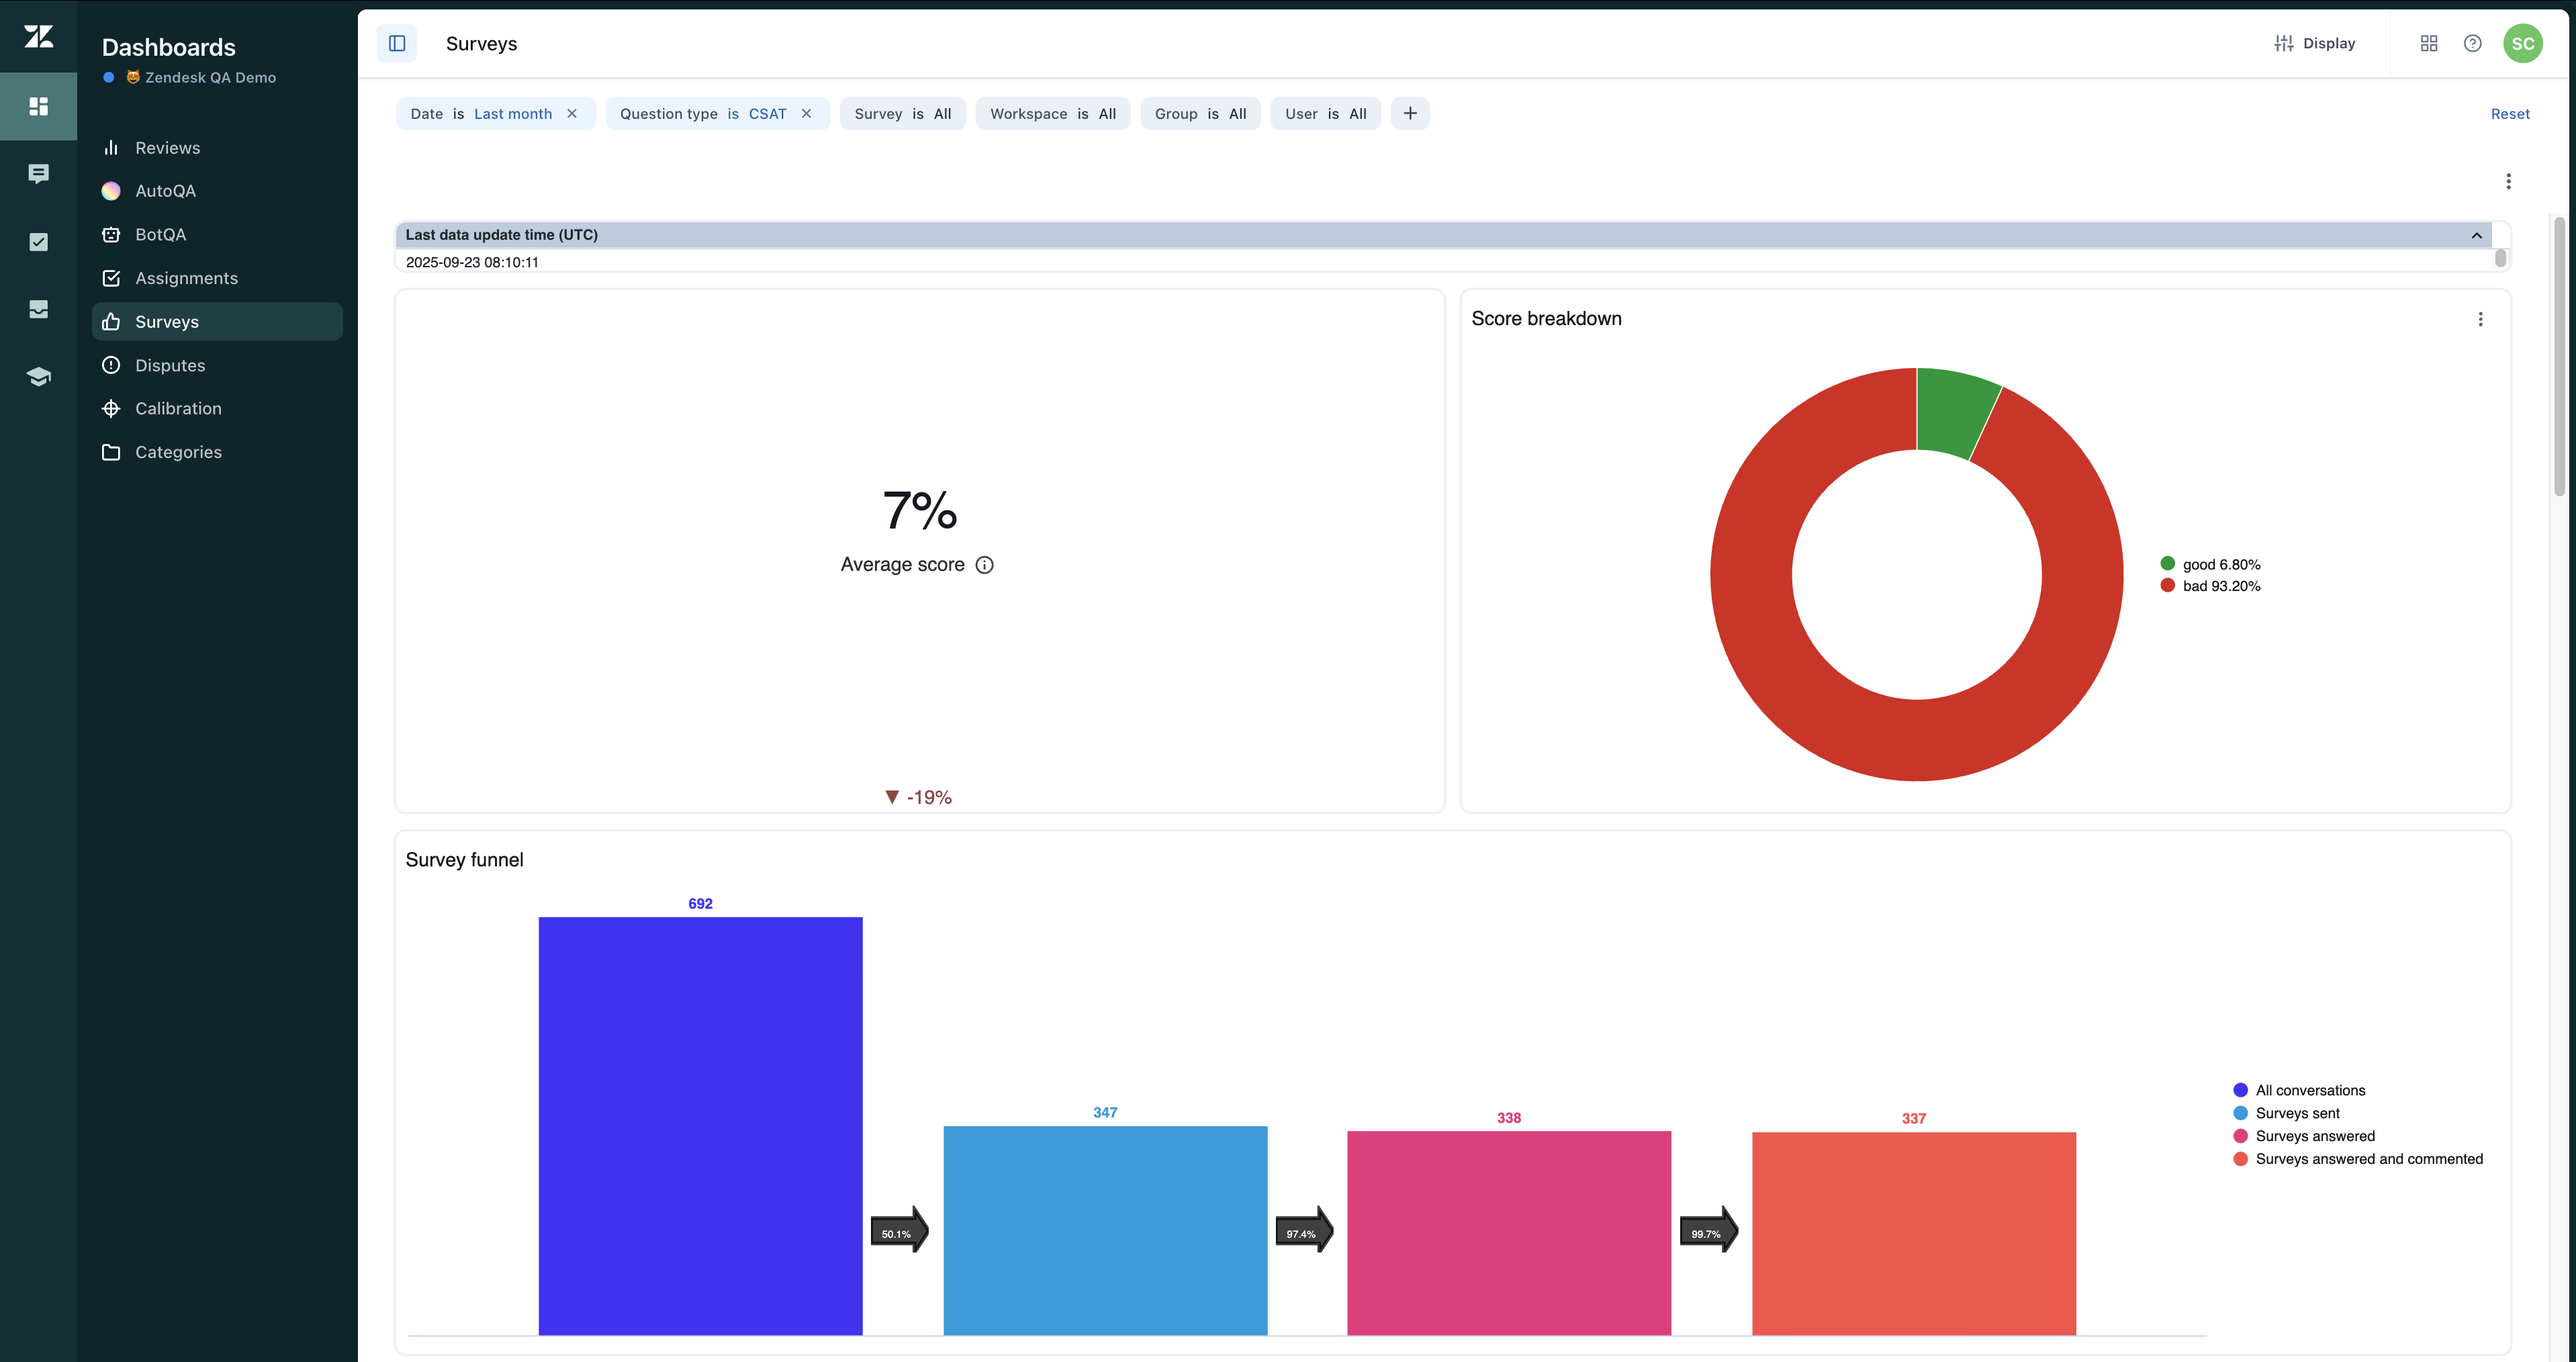
Average score
CSAT is calculated by dividing the sum of all responses by the total possible maximum scores. The average score displays the average Customer Satisfaction Score (CSAT) normalized to a percentage. It also provides a period-over-period growth calculation in comparison to the previous period.
Score breakdown
Score breakdown shows the distribution of survey responses by rating score.
Survey funnel
This card tracks the survey engagement pipeline from conversations to responses.
The survey funnel shows the number of surveys sent versus the number of responses and comments received, allowing you to determine your response rate, including:
- Total conversations
- Surveys sent
- Surveys answered
- Surveys answered with comments
Survey responses
Displays a detailed table of individual survey responses. Agents can be the original score recipients (default) or those with the most replies in the ticket, based on the dashboard parameter selection.
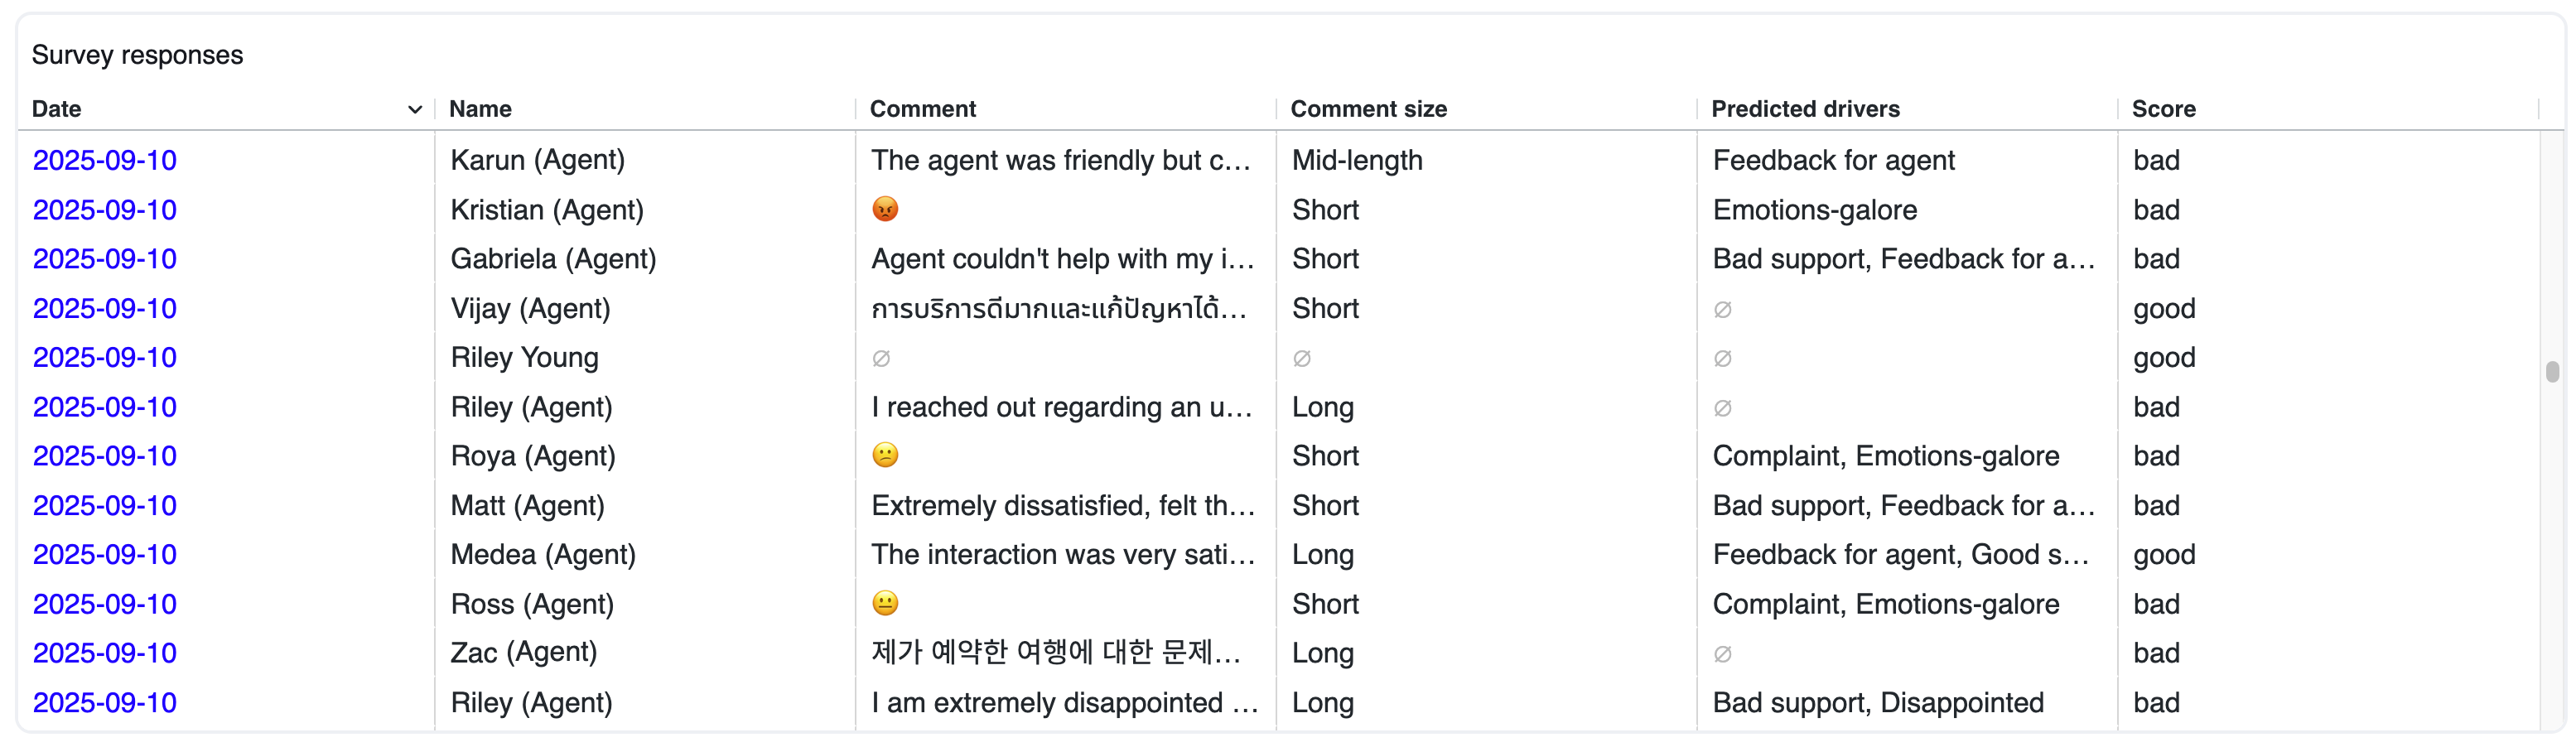
Survey responses include the following fields:
- Date
- Agent name
- Response comment
- Rating score
- Predicted drivers (survey response score insights)
- Comment size classification (short, mid-length, long, very long)
- Custom fields (available in the export file for eligible accounts)
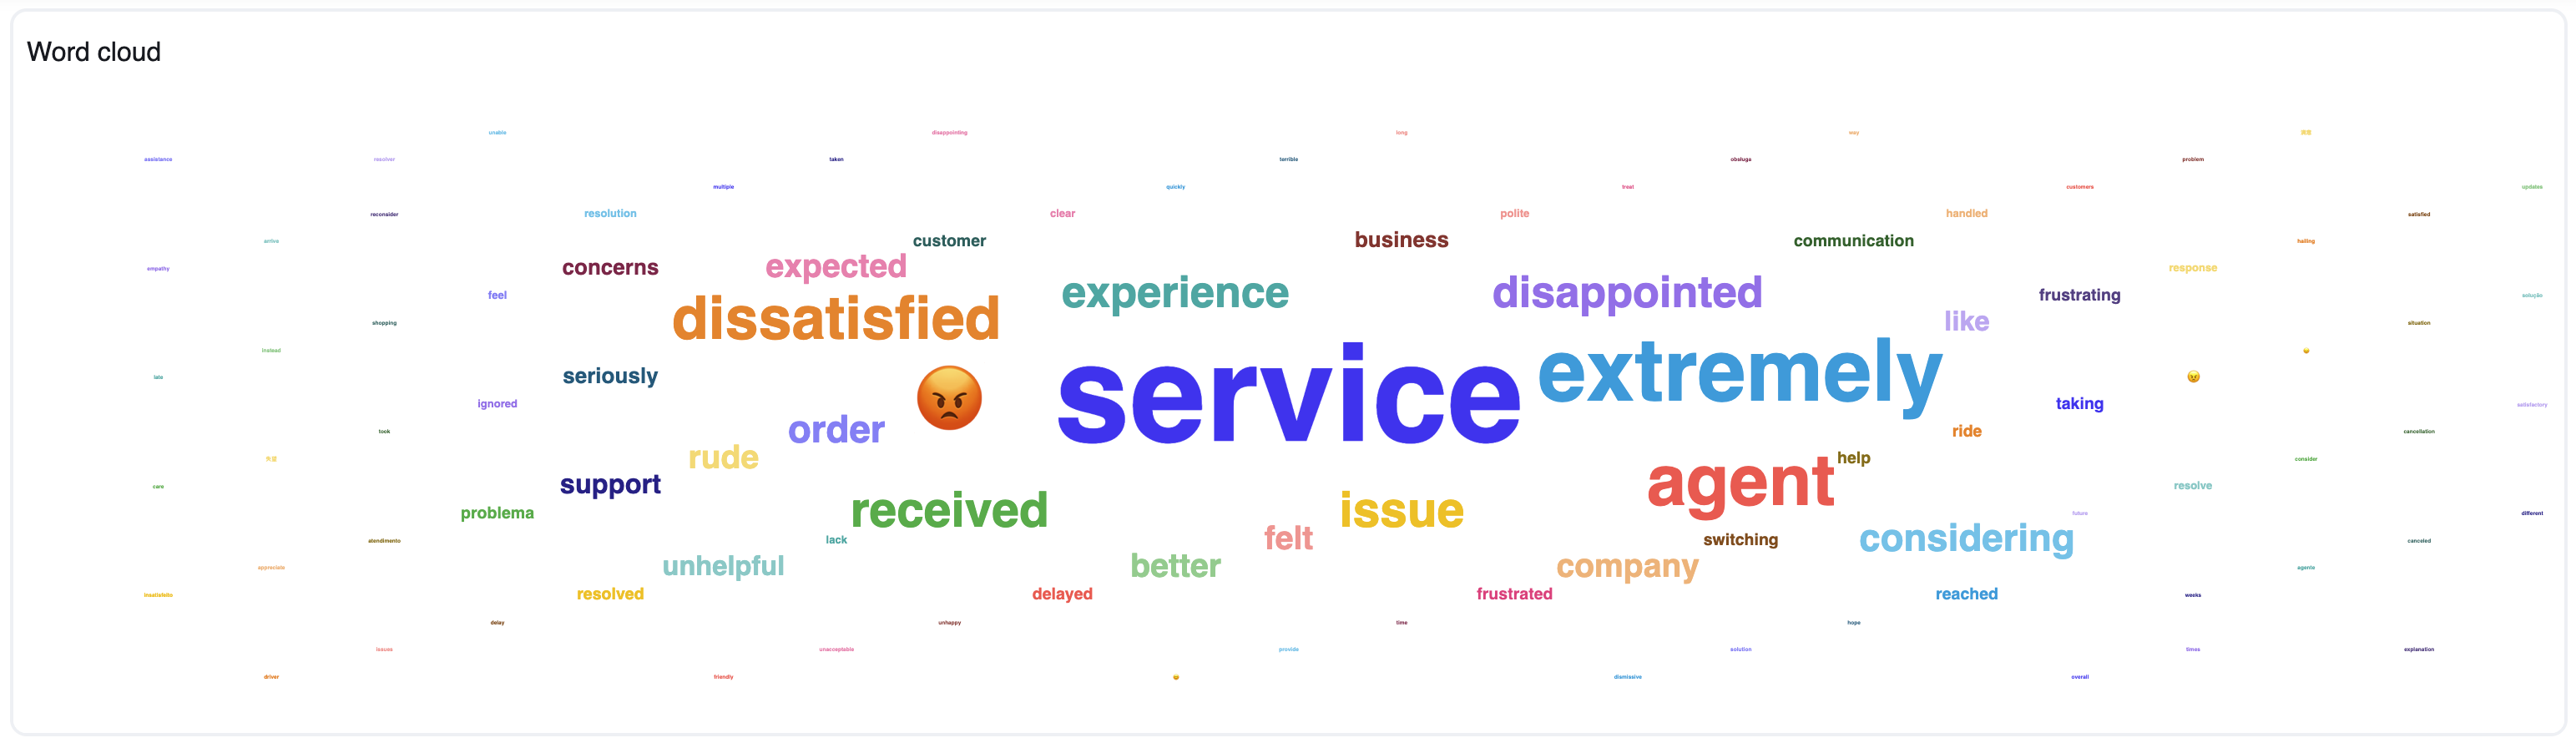
Word cloud
This card provides a visual representation of the top one hundred words mentioned in survey comments.
Reasons
This card shows survey responses by feedback reason tag.
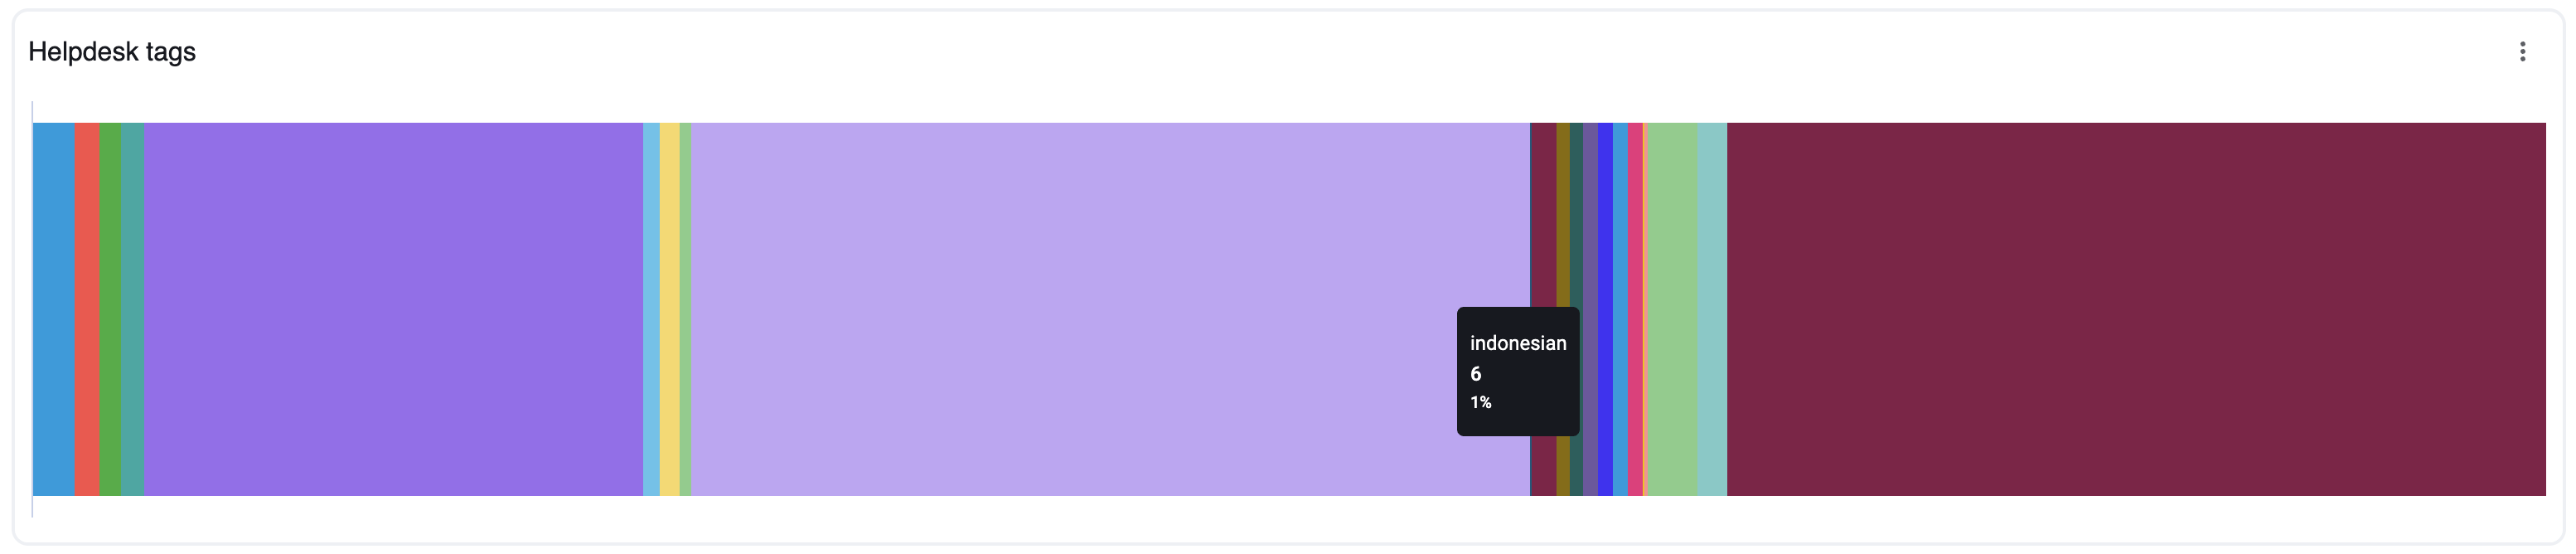
Helpdesk tags
This card shows survey responses by ticket tags from your connected Zendesk Support account, if applicable.
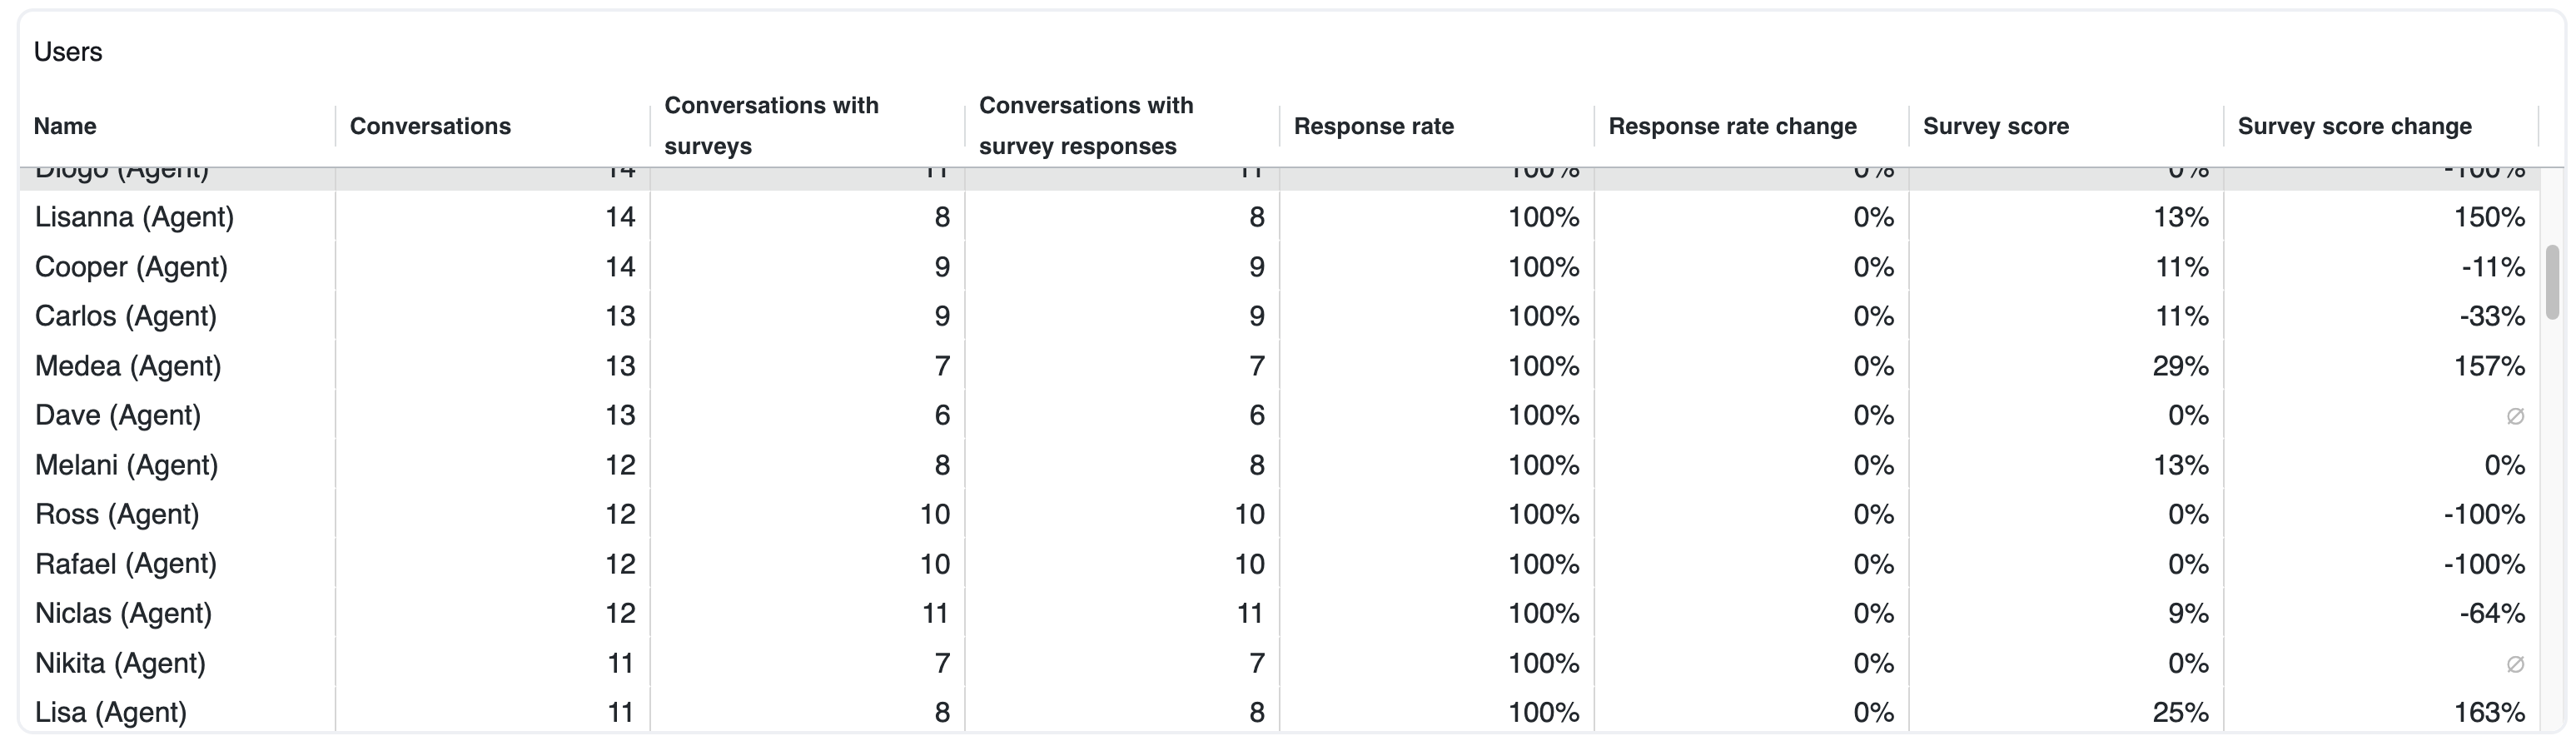
Users
This card shows agent performance analytics and comparisons.
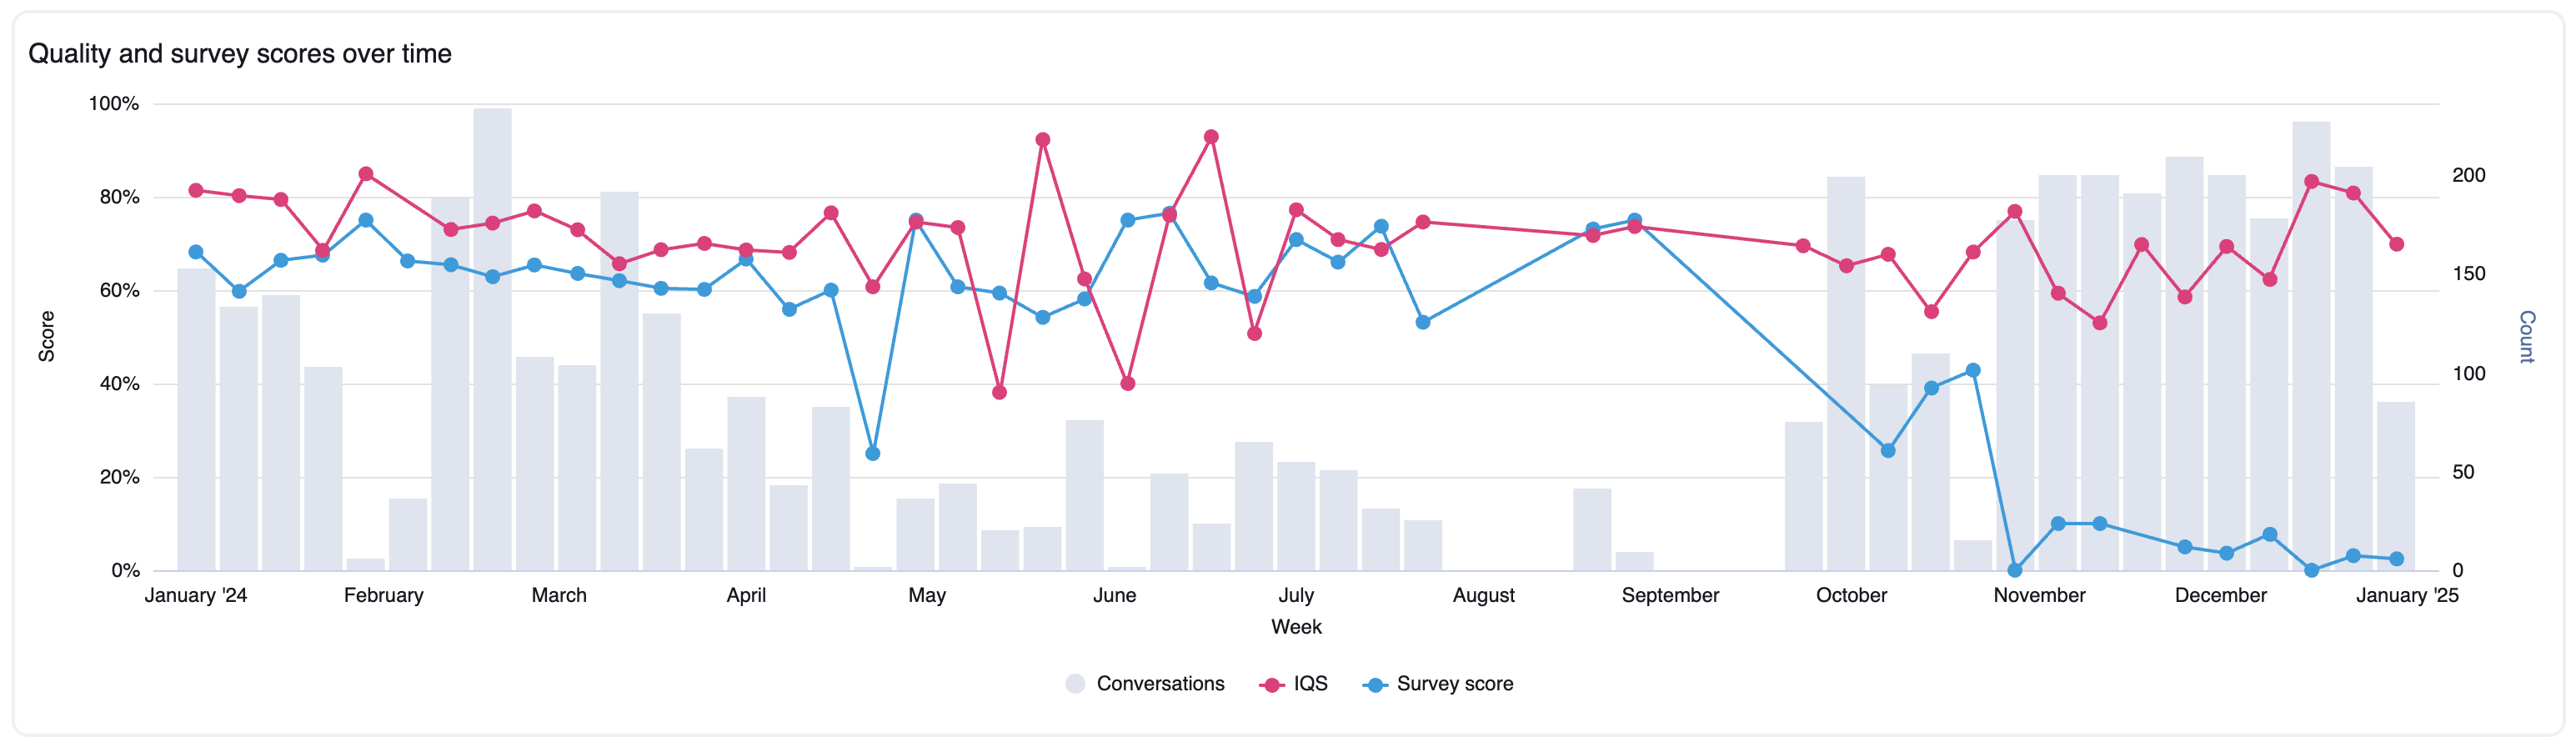
Quality and survey scores over time
This card shows a high-level trend analysis for key operational metrics for a day, week, month, or quarter.
Survey and conversation metrics by attribute
This card shows a segmented analysis based on key conversation or survey attributes.
The default table attribute used to slice the data is "survey response reason." However, you can modify it to a different survey attribute (such as survey response language or survey response predicted driver) or a conversation attribute (including conversation channel, conversation source, or conversation tag) through dashboard parameters. Use the "Select chart attribute" option under Display settings.
Survey and conversation metrics over time by attribute
This card displays your survey scores over different time periods (daily, weekly, monthly, quarterly) and compares them to your targets. It also shows the number of responses.