Verified AI summary ◀▼
AI-powered quick reports let you generate reports using natural language prompts, simplifying data analysis and decision-making. You can refine reports with follow-up prompts, but note limitations like a 200-character input limit and no support for custom fields. Admins can disable this feature if needed. Share feedback via the community area or the feedback icon in the quick report panel.
AI-powered quick reports empower teams to ask questions in natural language to create reports in seconds, simplifying data analysis and driving faster decision-making. You don’t need to select metrics and attributes; you just ask questions.
By using simple prompts, you can quickly transform analytics into actionable insights, identify trends, and democratize data across your organization.
This article contains the following topics:
Understanding quick reports
To help you go from your data to decisions more quickly, use quick reports, which harness the power of AI to enable you to write simple prompts to generate the reports you need.
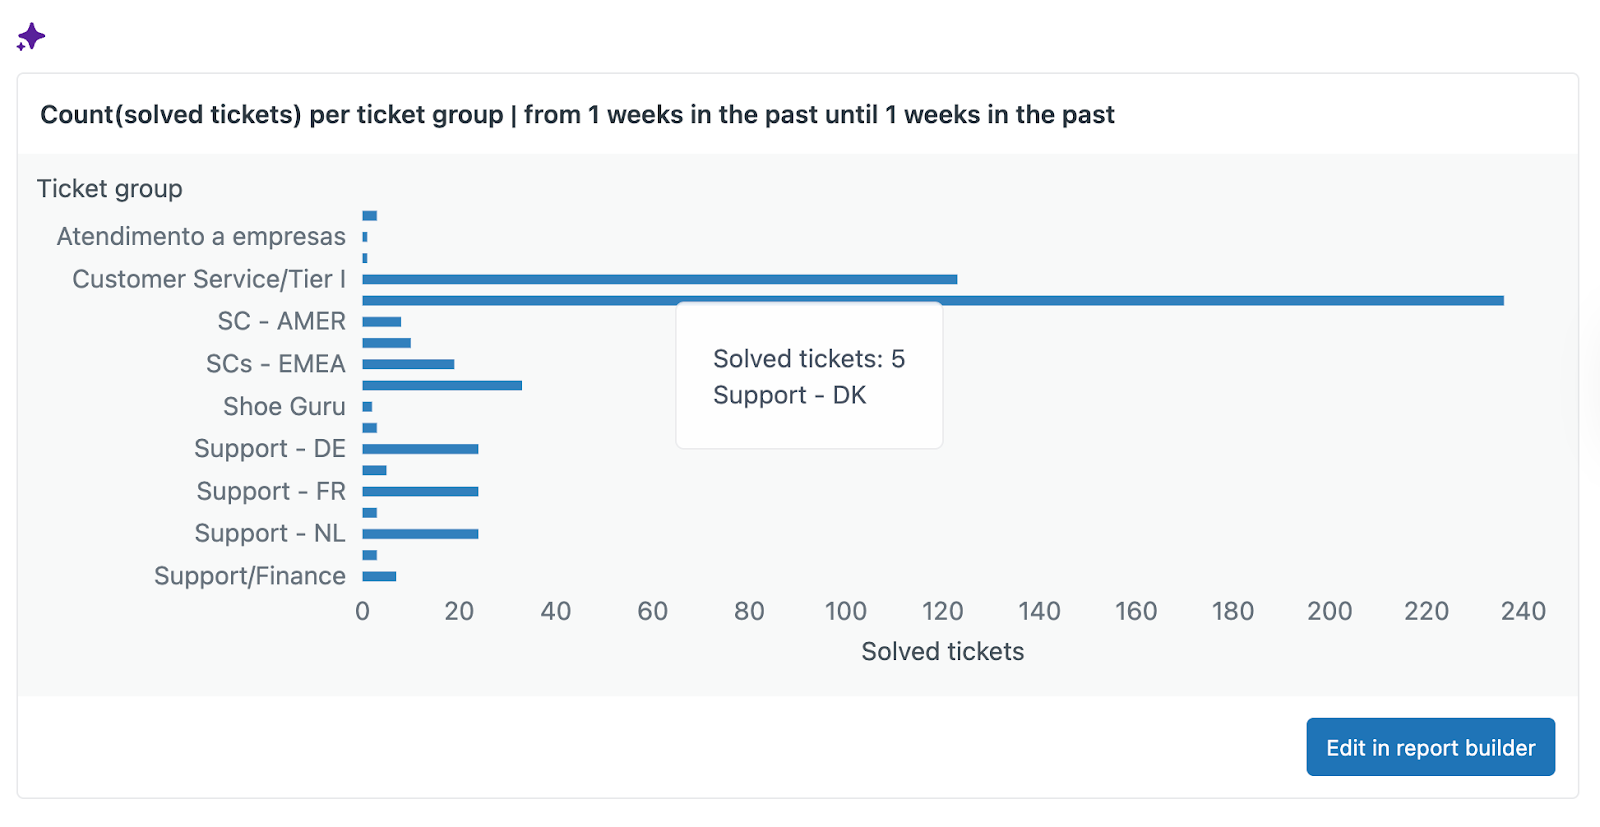
For example, if you want to know which of your agents created the most tickets last week, ask the questions “In the past week, which agent solved the most tickets?” Analytics will immediately generate the report for you:

You can then supply follow-up prompts to refine the report. For example, “Make that a pie chart” gives you:
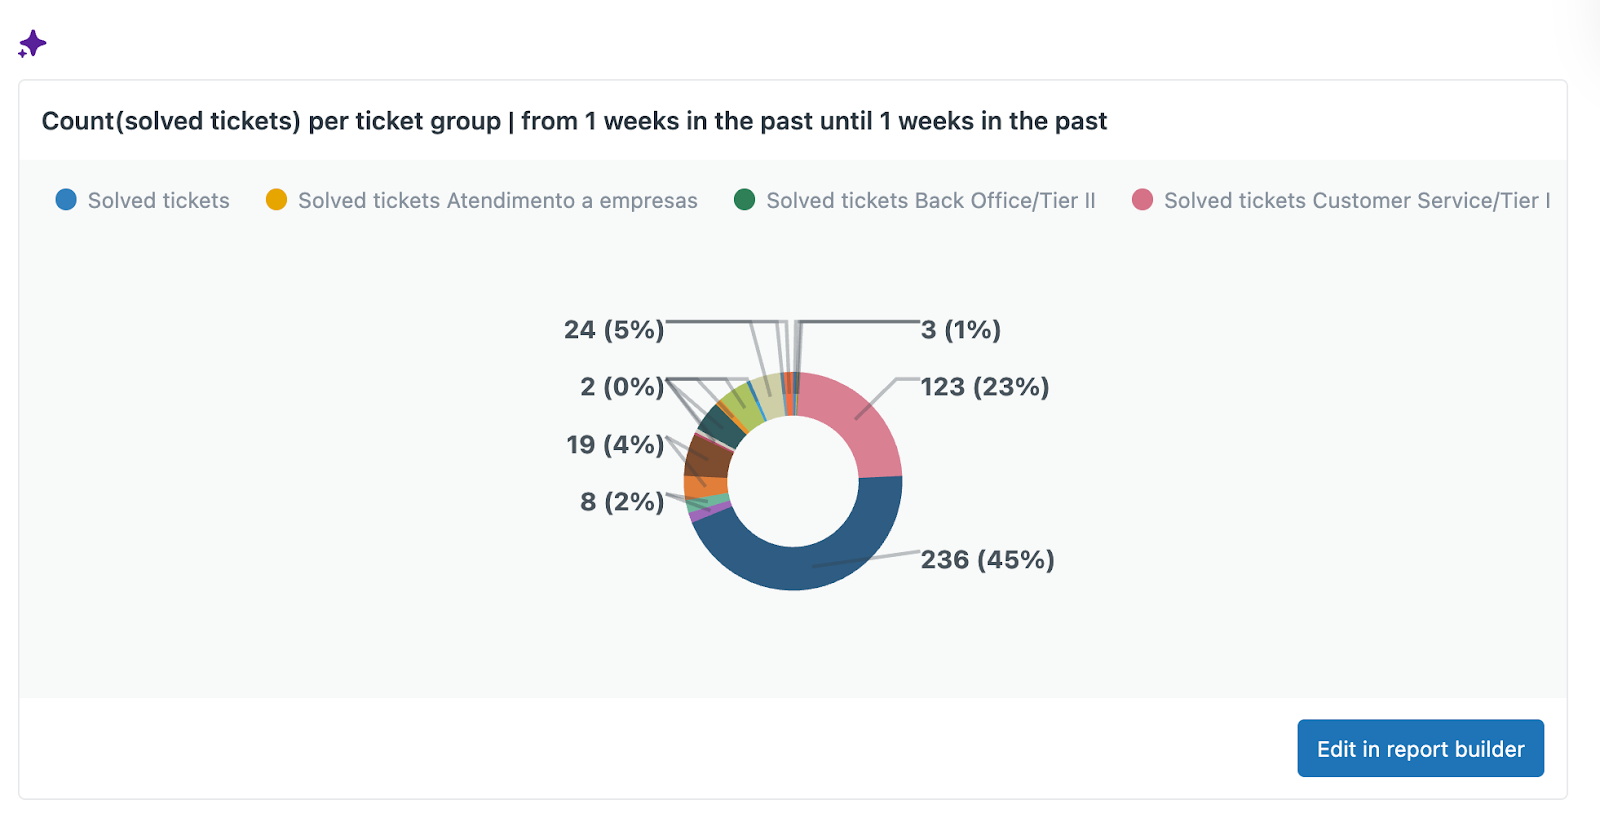
When you’ve generated a report, you can open it in report builder to fine tune it to look exactly how you want or add it to a dashboard.
Considerations for using quick reports
- Only the Support: Tickets dataset can be used to generate reports.
- All languages supported by OpenAI can be used to generate reports.
- Quick reports are available for historical data, but not live data.
- Each user can generate a maximum of 150 reports per day. This limit resets every 24 hours, regardless of the time zone of the account and user.
- The input query cannot exceed 200 characters.
- Quick reports don't support custom fields or calculated metrics and attributes.
Creating quick reports
In this section, you’ll learn how to create a quick report. You don’t have to use the example used here, feel free to experiment with your own prompts. Be as specific as possible with your prompts to generate the best results.
To create a quick report
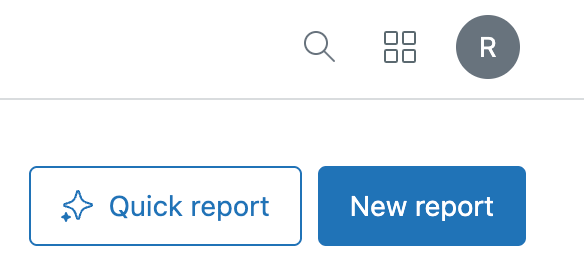
- In analytics, click the reports icon (
 ).
). - In the reports library, click Quick report.
The quick report panel opens.
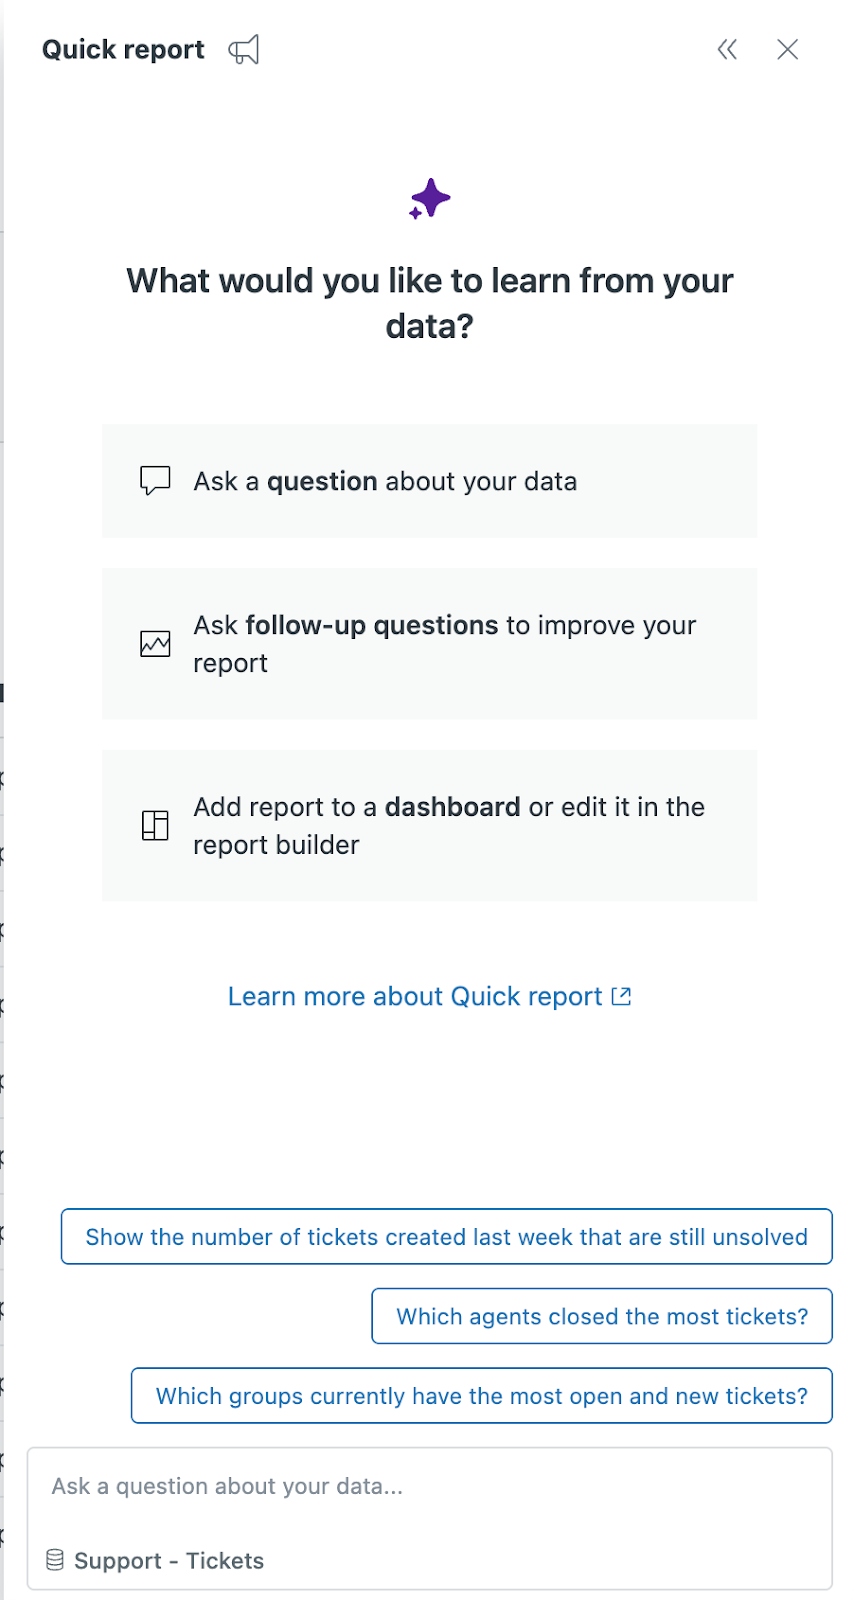
- In the prompt area at the bottom of the quick report panel, enter a prompt to analyze your data.
See Writing effective prompts. For example:
- Which agents solved the most tickets last week?
- Which groups currently have the most unsolved tickets?
- How is our first reply trending?
Your report is generated and displayed in the quick report panel.
You can now make changes to the report in two ways:
- Click Edit in report builder to edit the report in report builder.
- Refine the report using further AI prompts. See Refining quick reports.
Refining quick reports
Once you’ve generated a report, you’ll typically want to make changes to it in order to get it looking just how you want. You can use quick reports to refine the report without opening report builder.
To refine your report, enter further requests in the prompt area at the bottom of the quick report panel. For example, you could enter:
- Make the report a pie chart.
- Show only results from last week.
- Show me data for the HR group only.
- Slice the report by channel.
- Replace the metric with the first reply time.
- Use the average aggregator.
- Go one step back (or undo the last change).
If you can't use a prompt to get the report you need, click Edit in report builder to make changes to the report using report builder.
Writing effective prompts
When creating a quick reports prompt, you can specify the following parameters:
- Metrics (measures)
- Attributes (slicers)
- Filters (data or time)
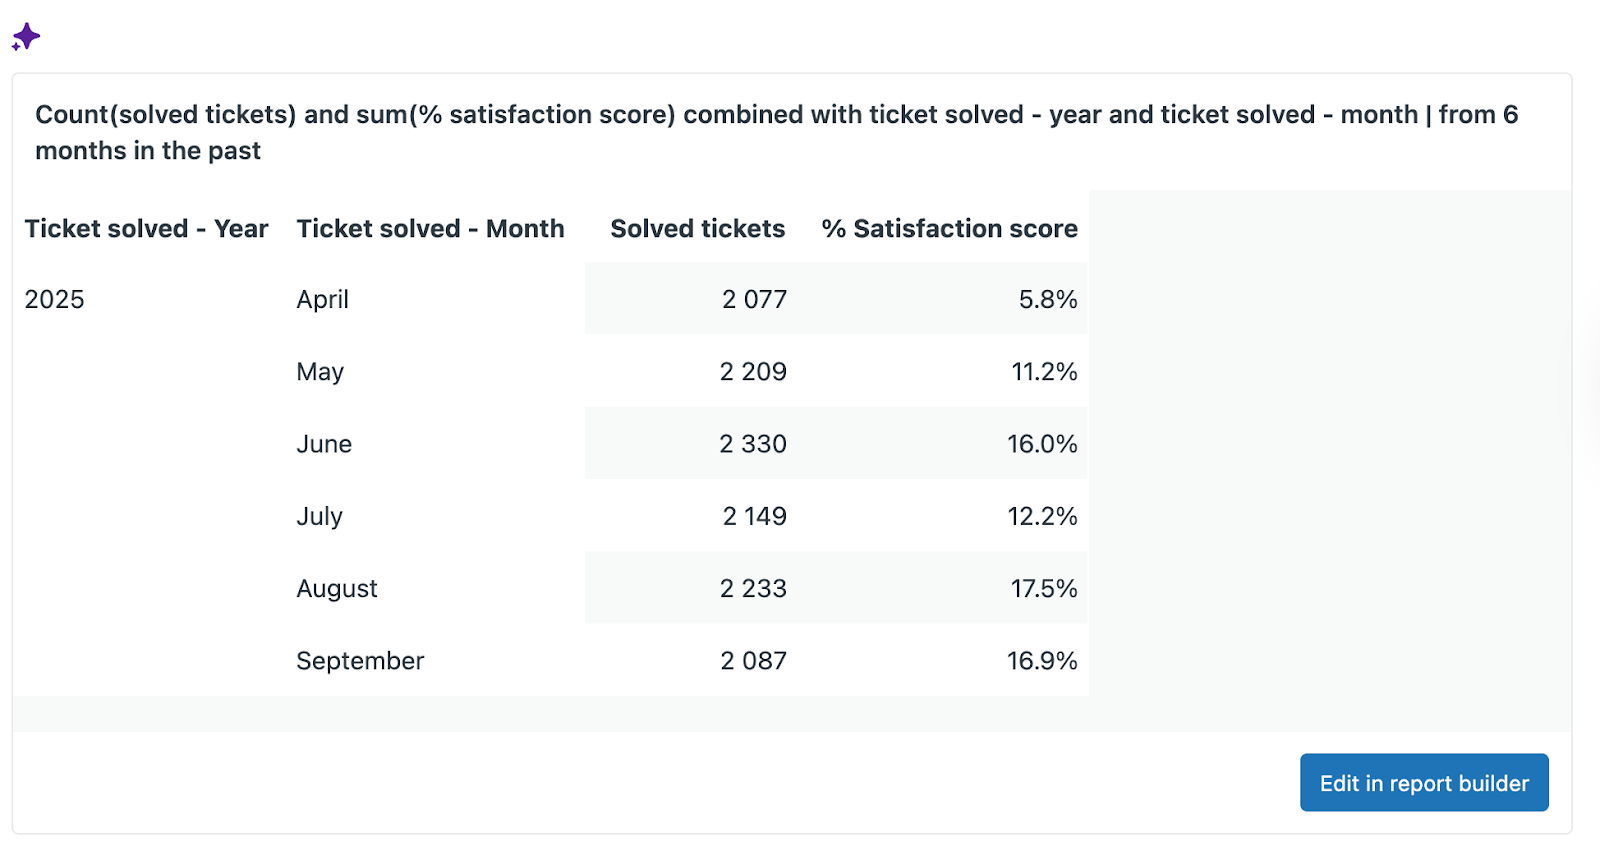
Here’s an example of a well-structured prompt and the results:
"Solved tickets and CSAT by month for the past 6 months as a table"
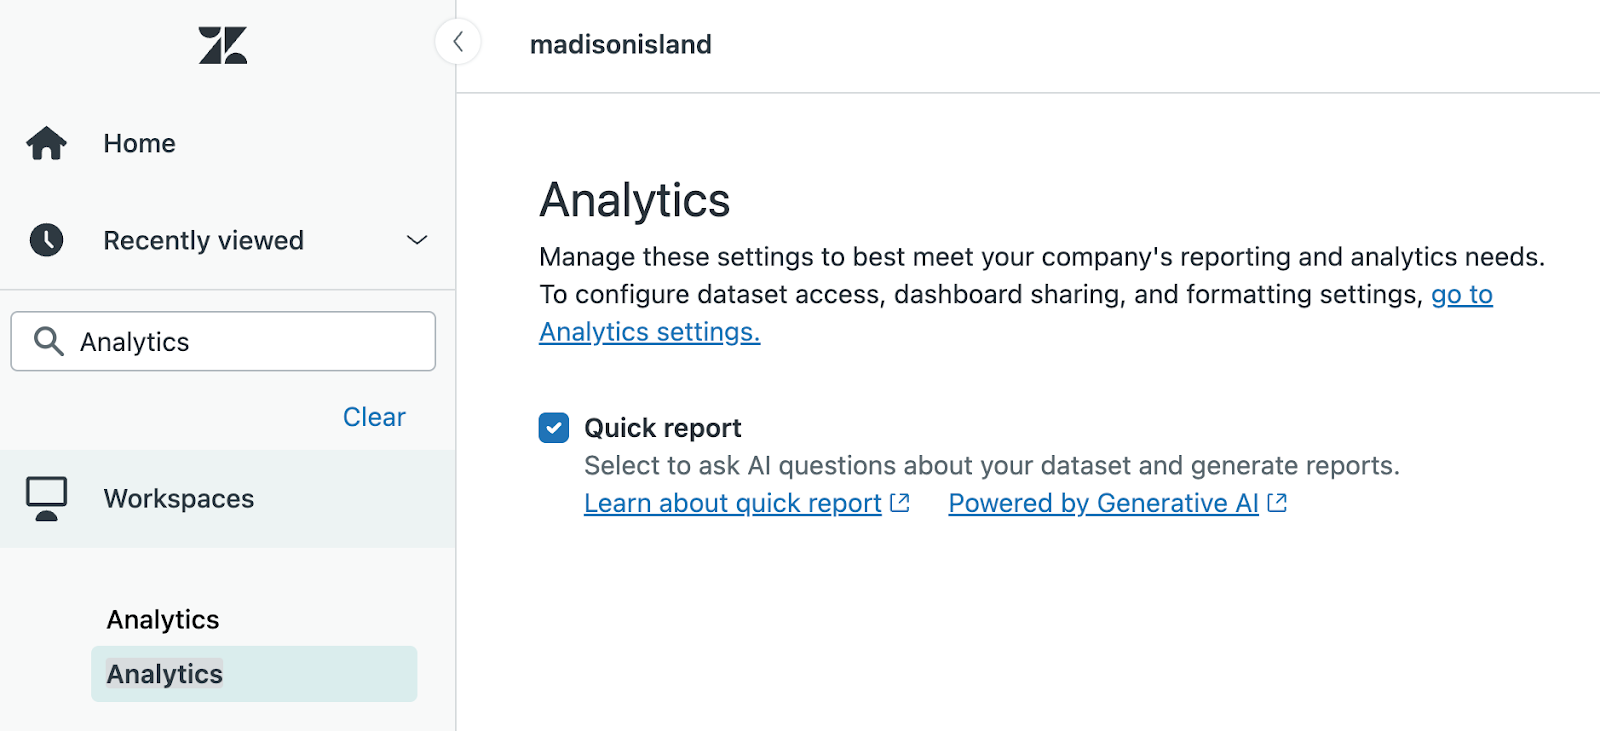
Turning off quick reports
If your company’s policy doesn’t allow the use of OpenAI or other generative tools, account admins can turn off quick reports.
To turn off quick reports
-
In Admin Center, click
 Account in the sidebar, then select Billing > Subscription. Workspaces > Analytics.
 - On the Analytics page, deselect Quick report.