Recent searches
No recent searches
Reporting on % of tickets solved within a set period of time
Answered

Posted Dec 17, 2021
I'm looking for help/a recipe for reporting on how many tickets (or the % of tickets) solved within 30 days and 60 days of being created. My organization has an expectation that 85% of tickets received will be solved within 30 days, and 98% will be solved within 60 days. I have looked into setting up SLAs to make this reporting possible but it doesn't seem to allow me to setup this specific SLA (i.e. ticket must be solved within 30 days of creation).
1
24
24 comments
ZZ Graeme Carmichael
Mark
Start by making a custom attribute to calculate the days between the ticket created date and solved date.
DATE_DIFF([Ticket solved - Date],[Ticket created - Date],"nb_of_days")
Then use this to create your brackets of tickets in a another new custom attribute.
IF [Days Between Created and Solved]<=30
THEN "30 Days and Under"
ELIF [Days Between Created and Solved]<=90
THEN "90 Days and Under"
ELSE "91 Days and Over"
ENDIF
... to give a report like this:
1
Mark Sokolowski
Thanks, Graeme! This did exactly what I was hoping for. Now, if I wanted the D_Count of tickets shown in the table for solved under 30 days expressed as a percent of total tickets solved, would that be easiest accomplished by creating another custom attribute based on the 2nd one?
0
ZZ Graeme Carmichael
Mark it is a little easier than that.
You can use result manipulation to add your total figures.
From you query, go to Results Manipulation>Result Path Calculation and use the settings:
This will give you:
To display both the ticket count and the percentages, you need a custom metric that is just a duplicate of our DCOUNT(Tickets)
....to give...
1
Suhan Li
This is very helpful.
Is it possible to get days in business days only?
Thanks,
0
Dave Dyson
That's going to depend on how you define "business days". Zendesk can give you first resolution time or full resolution time in business hours, and if you have a set number of business hours per "business day" (for example, if each business day is 8 hours), then you could just divide by that:
Then you could use that instead of the DATE_DIFF formula that calculates the number of days. However, this may give you undesirable results, if your business days vary from day to day, or if a ticket is created late on one business day and solved early the next, it would be counted as one business day instead of two -- so again, it depends how you want to define that.
My recommendation would be to just use the raw first or full resolution time in business hours, and base your time brackets on that, if that works with your business commitments.
0
shilpi dutta
I need a little help. Being a Beginner, I am trying to create an exact same report, however, I am getting an error and must be creating the attribute incorrectly. Would you know what is wrong? do I have to link both of them somehow?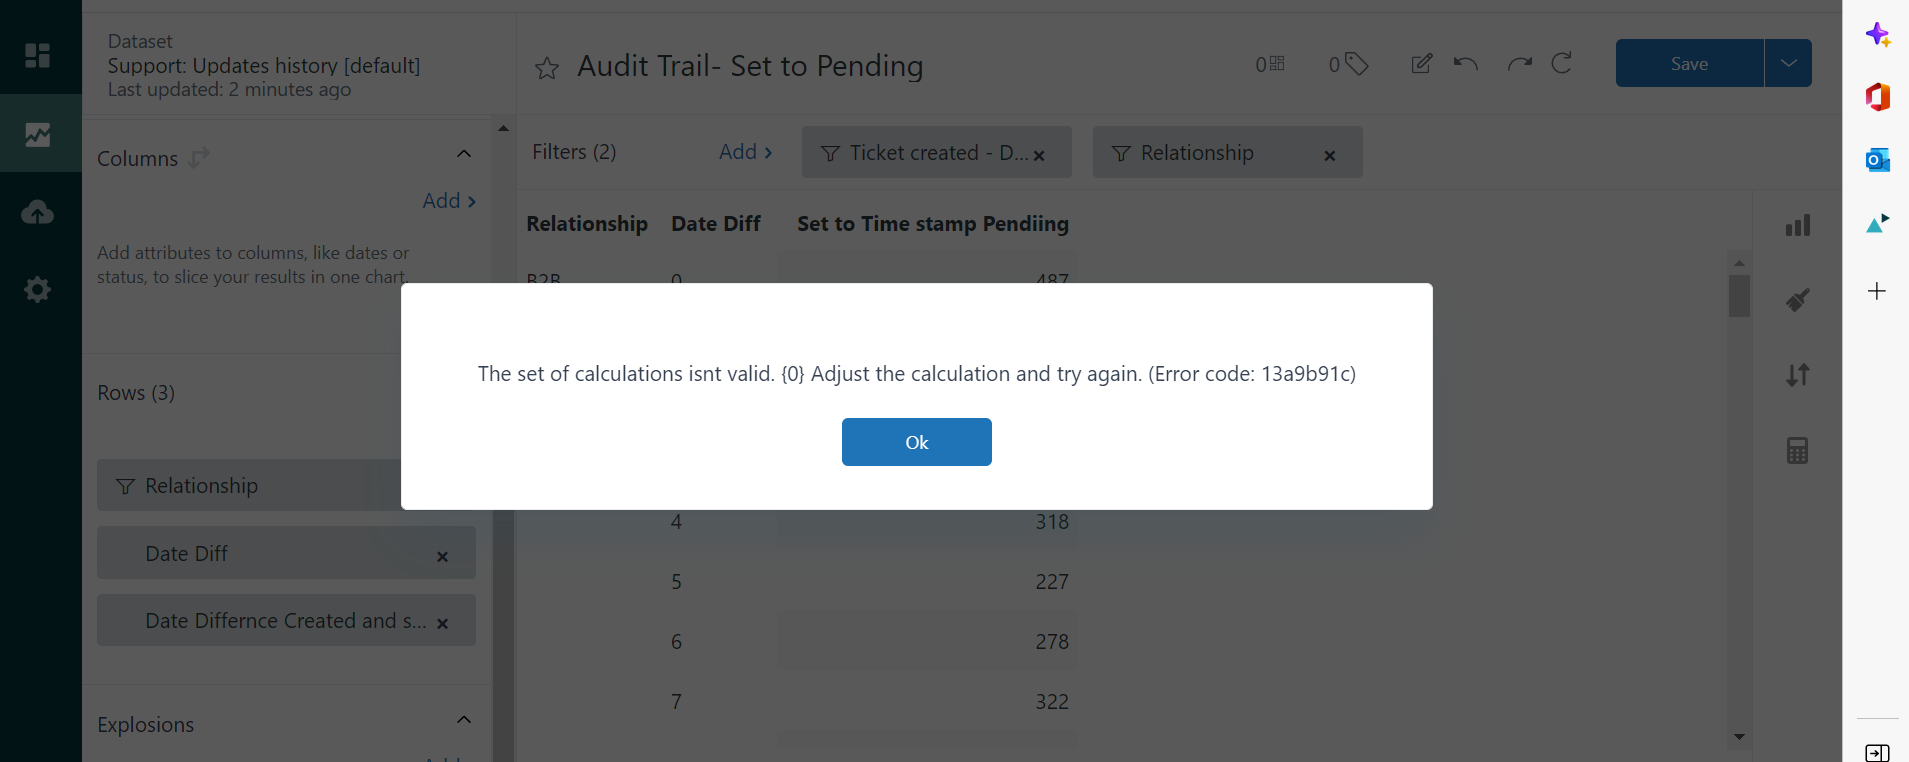
0
Alex Zheng
I can open up a ticket with you to investigate further.
2
shilpi dutta
yes pls
0
Valerie Perez
Hi ZD Team,
I have a similar use case in which I'm attempting to build a report that reflects % of tickets solved within 5 days of ticket creation date.
I tried the steps outlined by Graeme, however, when attempting the second step outlined below, I received an error message. I'm wondering if there are been some change to Explore that have made this formula outdated.
Then use this to create your brackets of tickets in a another new custom attribute.
IF [Days Between Created and Solved]<=30
THEN "30 Days and Under"
ELIF [Days Between Created and Solved]<=90
THEN "90 Days and Under"
ELSE "91 Days and Over"
ENDIF
0
Noly Maron Unson
Hi Valerie,
Try the formula below:
IF NUMBER([Days between Created and Solved])<=30
THEN "30 Days and Under"
ELIF NUMBER([Days between Created and Solved])<=90
THEN "90 Days and Under"
ELSE "91 Days and Over"
ENDIF
Hope this helps.
0
Damien Messé
Hello,
I'm also working with % of tickets solved within a period of time.
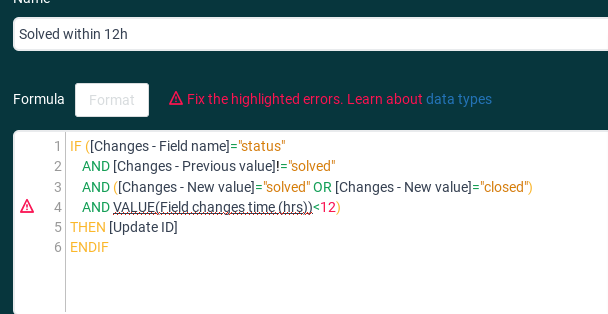
In my case 24h and 12h but since a few months I have this error : the VALUE aggregator can't be used with calculated metrics.
Do you know what other aggregator I can use ?
0
Alex Zheng
The database level metric is Field changes time (mins) so you should be able to use VALUE(Field changes time(mins))<12*60)) instead.
Let me know if that doesn't work.
0
Vanessa Wood
Hey All!
Thanks for these instructions. Is there any help out there on how to make this into a KPI?
Specially I only want to see the % of tickets solved within 30 days.
Thank you!
0
Brandon Tidd
Hey Vanessa,
In this case, you would create a calculated metric that divides the number of tickets solved within 30 days by the total number of tickets, then multiplies this by 100 to get a percentage, displaying this metric as a KPI. Hope this helps!
Brandon
0
Clarice Francis
Hello
Is there a way to do this but measuring hours rather than days? For example
4 hours and under
8 hours and under
9 hours and over
Thank you
0
Brandon Tidd
Hey Clarice Francis
Yes, this should be doable using a combination of the original code and the calculated metrics
Then use this to create your brackets of tickets in a another new custom attribute.
IF [Hours Between Created and Solved]<=4
THEN "4 Hours and Under"
ELIF [Hours Between Created and Solved]<=8
THEN "8 Days and Under"
ELSE "9 Days and Over"
ENDIF
Hope this helps!
Brandon
0
Clarice Francis
Hi Brandon, thank you not sure if I've done something wrong, but I get the error "formula_checker_invalid_addition_types"
In the original "DATE_DIFF([Ticket solved - Date],[Ticket created - Date],"nb_of_days")" I changed it to nb_of_hours but it shows 0, 24, 48, 72 etc. should I change [Ticket solved - Date]? Unfortunately, [Ticket solved - Hour] did not work
0
Brandon Tidd
Hey there Clarice,
Ahh good call! In this case, I think you'd need to use the difference between the timestamps as your benchmark. This should produce a result in nb_of_hours. Let me know if that works for you!
Brandon
0
Clarice Francis
Hi Brandon,
Thank you for your help, unfortunately when I use the time stamp difference it gives me the error "formula_checker_invalid_addition_types" - please let me know if I am doing it wrong, I've pasted screen shots below too.
Thank you,
Clarice
0
Brandon Tidd
Hey Clarice Francis -
Try wrapping VALUE() around your attributes
0
Clarice Francis
Thank you for your help with this Brandon, and apologies for the back and forth. Unfortunately it did not recognise it, please see below
0
Brandon Tidd
Hey Clarice Francis -
No trouble at all! I believe what needs to happen now is that you need to define [Time stamp hour difference] as a Metric in the dataset (opposed to an attribute). Then you would build the attribute using the custom metric. Give that a go and let me know if that solves for this issue.
Cheers,
Brandon
0
Laurie Schafer
Hi,
I'm trying to do what Brandon Tidd suggested above (on February 20th) but I'm not sure how to do it. Can I have more descriptive instructions on this step?
I believe what needs to happen now is that you need to define [Time stamp hour difference] as a Metric in the dataset (opposed to an attribute). Then you would build the attribute using the custom metric.
Even better would be if I could get a formula for these exact brackets:
1 day
2 to 5 days
6 to 30 days
31 to 60 days
61 to 90 days
91 to 120 days
121 to 150 days
151 to 180 days
> 180 days
Thank you,
0
Brandon Tidd
Hey Laurie Schafer
First, you'll need to create a standard calculated metric called “Timestamp day difference” with this formula:
Then here's the formula for the standard calculated attribute:
Hope this helps!
Brandon
0