
| Suite | Professional, Enterprise, or Enterprise Plus |
| Support with | Explore Professional or Enterprise |
Quando crei le manipolazioni dei risultati, potrebbero esserci parti del report che devono essere presenti per garantire che il calcolo sia corretto, ma che non è necessario visualizzare. Puoi nascondere colonne o righe vuote.
Ad esempio, se usi un calcolo del percorso dei risultati per visualizzare la differenza nei risultati nel tempo, il primo risultato di riferimento sarà vuoto (la colonna del primo trimestre 2015 nell'immagine seguente). Puoi nasconderlo, ottenendo un grafico più pulito.
![]()
Questo articolo include i seguenti argomenti:
Nascondere righe e colonne
- Nello creazione report, fai clic sull’icona Manipolazione dei risultati (
 ).
). - Seleziona Nascondi parte del risultato.
- Inserisci il numero del primo e dell’ultimo risultato da nascondere. In alternativa, puoi digitare righe o colonne specifiche.

- Fai clic su Applica. Nascondi risultati viene aggiunto automaticamente al pannello Filtri .

Nascondere le colonne senza un attributo nel pannello Colonne
Se non hai aggiunto un attributo nel pannello Colonne , nascondere un numero qualsiasi di colonne usando il menu Nascondi parte del menu dei risultati restituirà una schermata vuota. Ciò accade perché questo menu influisce solo sulle colonne generate dagli attributi aggiunti nel pannello Colonne dello creazione report.
Se invece non disponi di alcun attributo nel pannello Colonne e stai usando la visualizzazione Tabella, puoi usare Configurazione grafico > Colonne per rimuovere le colonne non desiderate. Per maggiori informazioni, consulta Utilizzo delle tabelle.
Nascondere le colonne nei report con più metriche
Quando usi la parte Nascondi del menu dei risultati per nascondere le colonne, il numero di colonne nascoste si riferisce alle colonne generate dai valori degli attributi, non alle metriche.
Ciò significa che, nell’immagine seguente, ciascuna delle caselle blu qui sotto è considerata una singola colonna, perché tutte le informazioni vengono generate da un singolo valore dell’attributo Stato ticket .

Nascondere le righe quando le metriche sono visualizzate sulle righe
Allo stesso modo, se hai selezionato l’impostazione Metriche su righe , è possibile che nascondere le righe usando la parte Nascondi del menu dei risultati nasconda più righe del previsto.
Nell’immagine seguente, ciascuna delle caselle blu è considerata una singola riga. Ciò accade perché l’impostazione Metriche su righe è selezionata. Senza questa impostazione selezionata, le due metriche nel report,Ticket e Ticket risolti, apparirebbero sulla stessa riga.

Avvertenza sulla traduzione: questo articolo è stato tradotto usando un software di traduzione automatizzata per fornire una comprensione di base del contenuto. È stato fatto tutto il possibile per fornire una traduzione accurata, tuttavia Zendesk non garantisce l'accuratezza della traduzione.
Per qualsiasi dubbio sull'accuratezza delle informazioni contenute nell'articolo tradotto, fai riferimento alla versione inglese dell'articolo come versione ufficiale.
14 commenti
Gabriel
I hope all is well!
Currently, you can only work with the option presented in this article to achieve that. For the moment, this functionality works with the "Hiding" concept, which, consequently, you can display the remaining rows and columns.
Thanks!!
0
Casey
Please disregard my previous post - was able to figure it out by removing "Metrics on Rows" from Configuration and using "Top/Bottom" on Result Manipulation.
0
Casey
Hi Zendesk - Is there any way to display only totals from a query without having to hide rows/columns?
I currently have totals displayed, but with hidden rows (=31) the total disappears for those months with 30 days (or less). It is a rolling "look-back" query to previous month(s), so the number of days/rows in the query will fluctuate.
Thank you!
0
Casey
Thank you Christophe Tiraboschi !
0
Christophe Tiraboschi
I will create a ticket on your behalf so we can investigate this.
Thank you for bringing this to our attention.
0
Casey
Hi Zendesk - When hiding a part of a result (row), changing this value sometimes hides all of my results. For example, I am using a basic ticket count query and displaying totals:
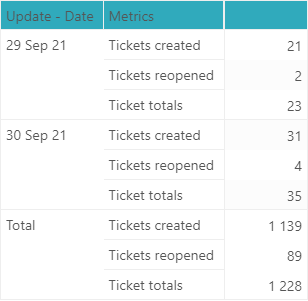
The image below has the first 14 rows hidden, but if I hide the first 15, then only the Total is displayed (deleting both of the 29 Sep 21 and 30 Sep 21 row sets). I would like the values for "30 Sep 21" displayed in addition to the Total (to show the current date that the data is for). Thanks in advance!
0
Erin O'Callaghan
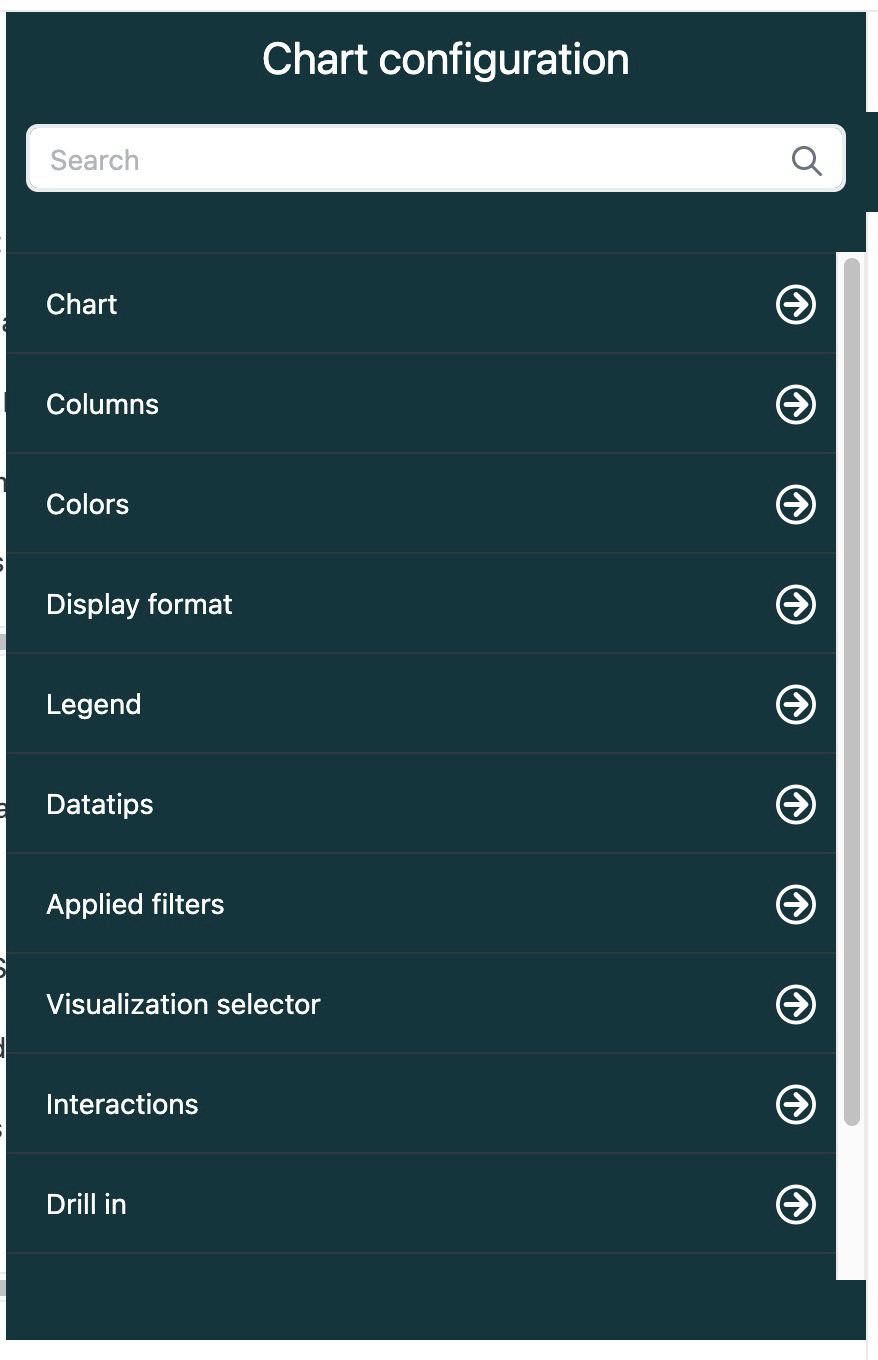
Hi sphen and Puneet Misra, thanks for pointing this out! The article has been updated to state that you can use Chart configuration > Columns, just like sphen said. :)
1
Rob Stack
Hi sphen, I'm opening a ticket to have the current Explore writer take a look at this. You should hear back soon. Thanks!
0
Stephen Belleau
Puneet Misra oh you're right! The article needs to be updated. cc: Rob Stack
It is Chart Configuration > Columns that you want.
0
Puneet Misra
sphen Can you elaborate on the steps? I am using the tables visualization type and I do not see tables under Chart Configuration and the steps in the Working with tables. do not have the information that is helping get the desired result.
0
Accedi per aggiungere un commento.