Excel exported is not in the same format in Explore
已完成

已于 2019年4月17日 发布
Hi all,
I am trying to export/schedule a dashboard to users and the report sent out is not displaying the right format as what I am seeing in Explore.
what I expect to be seeing in the excel exported should be similar to this: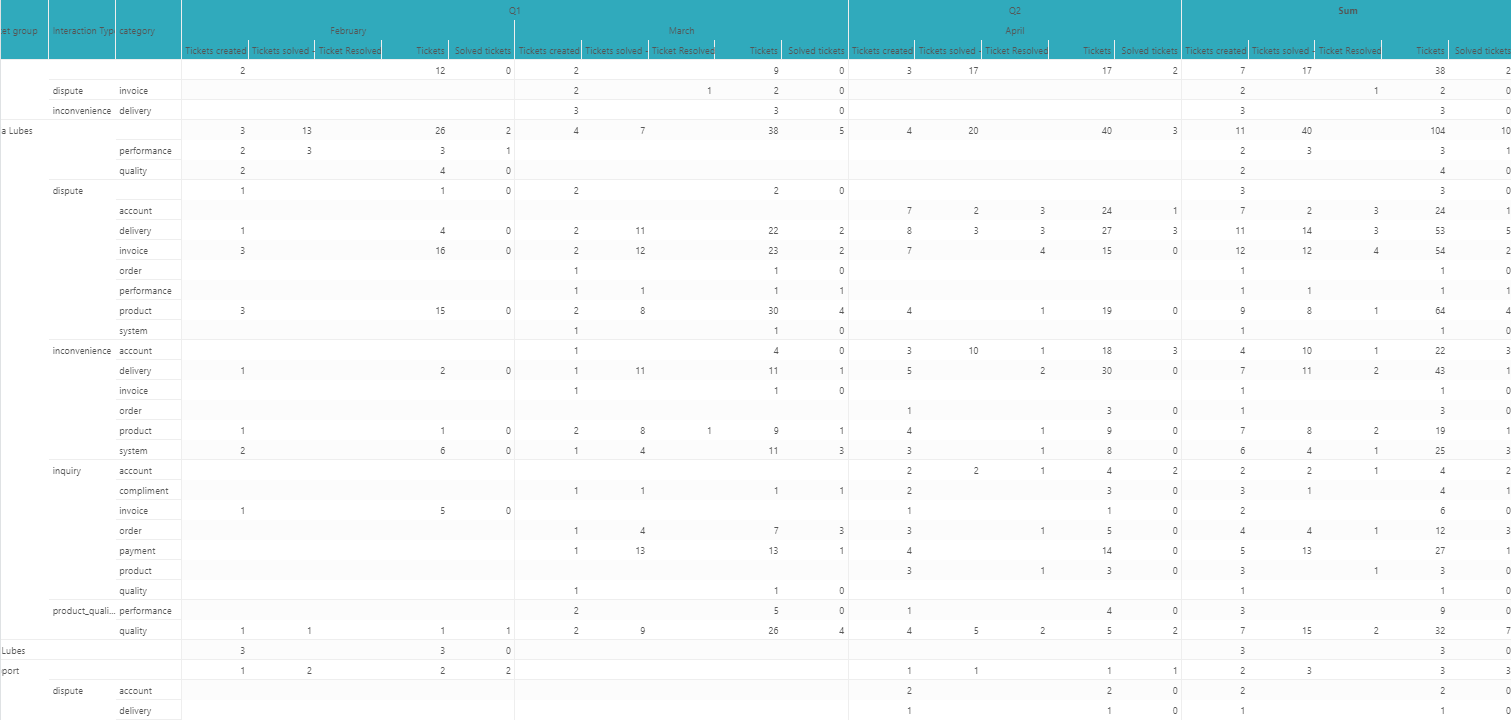
Yet the data exported looks like this: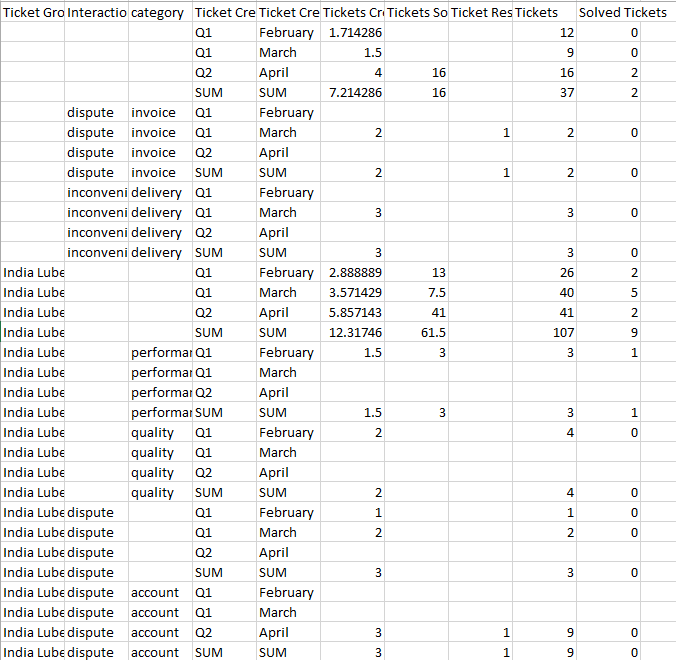
It re-arranges the format of the file (column to row).
Is there anyway that excel exported can be looked exactly the same as what I built in Explore?
Thank you.
22
42
42 条评论
Drey Tee
Absolutely agree with all people in this topic.
When export screws the data you see in report/dashboard - it's really unusable.
Please raise this issue priority.
1
PT Dadlani
Has this issue been resolved? It is extremely painful to build these reports and then not be able to export with the same format. Please advise when this is to be addressed or what the workaround is in Explore and/or Excel?
3
Yvonne Tornow
That's not possible! Are you introducing a product that does not export correctly? I think Zendesk wants to be a customer-focused company.
Change this circumstance quickly. In our case this concerns several reports. And an apology should be considered as well.
2
Thomas Hagins
This subject has been open for over a year now and has been 5 months since any update. With insights going away, this needs to work. How do I explain to upper management that we spend a lot of money on a product that can't even export a report properly? We need an update please.
3
Viacheslav Parshin
Hello!
I would like to add my voice to this post as well. I've recently encountered this shortcoming when trying to export a table report for our finance department and would very much like to see the table export behavior changed.
3
Денис Шпак
HI everyone!
+1 Like others, i'm patiently waiting for correct exporting tables into excel. Please, give us a message when it will be released.
3
Elise Pullias
Any updates on the timeline of when this issue will be resolved?
3
Rob Stack
Hi Bart. From Eugene's answer above, I do know the engineering team will be doing work during the year and this feedback will be invaluable to them. I can't speak to specific timeframes, but we'll be sure to provide an update when this happens.
0
Bart
Rob Stack
Thanks for looking into this. I think the issue is in explore you set all of your "columns" as rows - and then it exports everything into a row. But if I need to see tags per week and set the ticket solved per week as a row, because that's how it splits it into columns on the dashboards, then it should also export them into columns. -- Or make it so the columns part of explore actually is a column and splits the by week section per column.
One other metric I noticed missing from insights is week solve / year. I know you have time filters - but my boss would like to see every week since 2017 by tag. A large query for sure, but as part of investor meetings - they don't showcase explore dashboards - they do so through other software products to build these based on the numbers. Insights simply had week 15 / year 2018 etc.
Thanks again for looking into this.
0
Richard Heintze
This is an issue for our reporting as well. In our case, other internal teams request the exports to integrate with other internal data sources. It seems like a reasonable requirement to match the export view to the report view, or to make this configurable upon export.
The current behavior discourages adoption of Explore and encourages users to export unformatted data to start the report workflow and formatting in Excel or Google sheets.
1
请先登录再写评论。