You can add interactive widgets to a dashboard, so your viewers can interact with, and customize their results. Only editors can add interactive widgets, but any viewer permitted to view a dashboard can use them.
For help using interactive widgets, see Interacting with dashboards.
Related articles:
Filtering results
Viewers can use filter interactive widgets to restrict results to specific attribute values, date and number ranges, or the highest and lowest results. You can configure filters to work across multiple tabs, and you can prevent filters from applying to individual reports.
This section contains the following topics:
Filtering dashboards by time, attributes, metrics, or top/bottom
Adding a time filter
A time filter enables users to edit the displayed time period.
- In the Dashboard menu, click Add > Add time filter.
- In the Time filter widget panel, select a date attribute to use in the filter.
- Edit how the time filter is rendered (calender by default) and the level of detail. These options are available underneath your metrics.
- When you are finished, click Apply.
Your time filter widget will resemble the image below.
Adding a data (attribute) filter
A data filter enables viewers to filter results by an attribute's values. Viewers can divide data by an additional attribute without the results appearing on each report.
To add a data filter
- In the Dashboard menu, click Add > Add data filter.
- On the Choose data filter dataset panel, choose the dataset you want to filter. You'll see this panel only if you've added multiple reports that use different datasets to your dashboard.
- In the Choose data filter columns panel, select the attribute you want to
use.
You can either browse the available attributes in the list, or refer to Understanding Explore datasets for a full list of available values for the dataset you're using.
Tip: If you choose a date attribute, think about how you want your viewers to be able to filter the dashboard. For example, a common filter might be the date the ticket was created, so you'd choose the Ticket created - Date attribute. The attribute you select must be part of the dataset that was used to create the report you’ve added to the dashboard. - Enter a Display name and Width to set a custom name and width for the attribute.
- Select a position from the Display drop-down list to set how options appear.
- Select from the following additional options:
- Multiselection: Allows viewers to select more than one value.
- Cascade prompts: Applies the data filter to other filters. For example, if you're using two separate data filters for Ticket Tags and Ticket ID, selecting this option means that when a viewer selects a tag, only the ticket IDs for that tag will be available.
- Select values: Allows viewers to select values to be included in the filtered report.
- Exclude values: Allows viewers to select values to be excluded from the filtered report.
- Promote URL as parameter: Embeds your filter in the dashboard URL. You can type a new value directly in the URL to update your filter. For more information about this option, see Customizing dashboards with URL parameters.
- Show selected/excluded values: Shows the values that are currently included or excluded from the filtered report in the data filter widget.
- In the Sort drop-down list, select the order of values. Values can be sorted alphabetically from A-Z or Z-A.
- If your dashboard uses multiple datasets, you can enter a common attribute in the Link with box to apply the filter across all of your dashboard's datasets.
- Select Do not share across tab to apply the filter only to the selected tab.
- When you're finished, click Apply.
Your data filter interaction will resemble the image below.
Adding a metric filter
The metric filter interactive widget is similar to the metric filter manipulation in the report builder (see Selecting the metric result range). Viewers can use the metric filter to set a floor or ceiling to results.
- In the Dashboard menu, click Add > Add metric filter.
- On the Choose metric filter dataset panel, choose the dataset you want to filter. You'll only see this panel if you've added multiple reports that use different datasets to your dashboard.
- In the Choose metric filter dataset panel, choose a dataset.
- Select the metric you want to use as a filter.
- You can then edit the display name, width, and if blank values are filtered.
- When you are finished, click Apply.
Your metric filter will resemble the image below.
Adding a top/bottom filter
Similar to the top/bottom filter manipulation option in the report builder, with the top/bottom interactive widget your viewers can limit results to the highest or lowest values. For more information on the top/bottom filter in the report builder, see Creating a top/bottom filter.
- In the Dashboard menu, click Add > Add top/bottom.
- In the Top/Bottom panel, enter your top and bottom values and set their visibility.
- Select a strategy. The strategy will determine what attribute is used to calculate results.
- Add metrics in the Metrics textbox.
- Select a Display type. You can display measures in either a drop-down or button list.
- When you are finished, click Apply.
Your top/bottom filter will resemble the image below.
Filtering results across multiple tabs
You can make dashboard filters work across multiple tabs. To do so, add the same filter to each tab you want it to affect.
To use the same filter across multiple tabs
- Add the filter you want to the first dashboard tab.
- Select the filter you just added and press Ctrl+C on your keyboard to copy the filter.
- Go to the next tab you want the filter to work on and press Ctrl+V to paste the filter.
- Repeat steps 2 and 3 for additional tabs as necessary.
When a user views the dashboard and applies a filter, the reports on the tab they’re viewing are filtered by the value they chose. When the user moves to another tab where you’ve added the same filter, that tab is already filtered by the same value they chose on the first tab.
If you don’t want that behavior, you can prevent filters from affecting multiple dashboard tabs, even if the same filter appears on multiple tabs.
To prevent filters from working across tabs
- In each filter you want to change, click the down arrow in the top right, then click Edit filters.
- In the settings panel, select Do not share across tab.
- Click Close.
Now, changing the filter, or clicking a bookmark that changes the filter, affects only the current dashboard tab.
Excluding reports from dashboard filters
If necessary, you can prevent dashboard filters from applying to individual reports within the dashboard. This is helpful if you don't want dashboard-level filters to overwrite the filters configured in the report itself.
To turn off dashboard filters for a report
- Select a report in the dashboard.
- In the right-top corner of the report, click the down arrow and select Exclude filters.
- Select the filter type, then select the attributes that should not be applied to the report.
Selecting new metrics and attributes
When you select these interactive widgets, your viewers can edit the initial metrics or attributes to view other possible outcomes.
The following interactive widgets that enable your viewers to edit existing metrics or attributes:
Selecting a different metric
The change metric widget enables viewers to change the initial metrics, so they can view different outcomes of the same report.
- In the Dashboard menu, click Add > Add change metric.
- In Choose change measure dataset panel, select a dataset used on the dashboard.
- Select the metric that you want to give users the option to change.
- After you select a metric, you can edit the option display name, width, and display format. You can also permit users to change measure aggregators and restrict the list of available measures.
- When you are finished, click Apply.
Your change metric widget will resemble the image below.
Selecting a different attribute
Similar to a change metric, the change attribute interactive widget enables viewers to select a new attribute.
- In the Dashboard menu, click Add > Add change attribute.
- In the Choose change attribute dataset panel, select the dataset containing the attribute you want to become a change attribute.
- Select the attribute to become a change attribute.
- After you select an attribute, you can edit the display name, width, and display format. You can also restrict the list of available attributes.
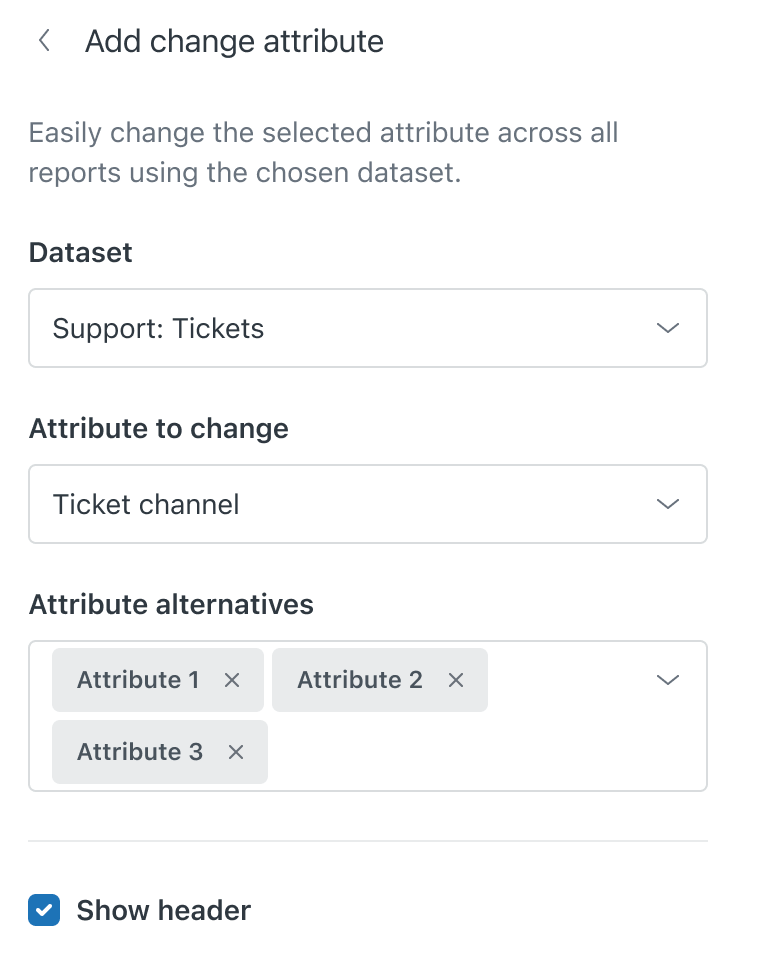
- When you are finished, click Apply.
Your change attribute widget will resemble the image below.
Using bookmarks to save filtered dashboard states
When you add a bookmark widget, it freezes the current state of filters. Viewers can switch to different bookmarks to see different filter states. To learn about how to use bookmarks, see Working with dashboard bookmarks.
13 comments
Joshua Bentley
@... - did you ever get an answer to your question? That's exactly what I'm trying to do right now.
0
Matt
Hi Joshua!
Limiting attributes to preselected values should be doable by utilizing sets. When creating a dashboard data filter using a set as the data filter column, only those attributes in that particular set will show up in the dashboard to be selected.
Follow along this documentation below to create sets.
https://support.zendesk.com/hc/en-us/articles/360022184334#topic_fsd_gw1_fv
Matt - Customer Advocate
Zendesk offers free, on-demand training for all of our products. Set up your account and start learning today at training.zendesk.com
0
Joshua Bentley
It doesn't look like the time filters include any of the Initial Rating metrics from the Ticket Updates dataset. Example: Bad Initial Rating.
I added a new time filter to the dashboard and don't have that as one of the options. Am I missing something?
1
Ronald
Can anybody explain the "Cascade prompts" option? I don't understand this:
I've noticed that when I choose this option in the data filter options the "Permanently Deleted" option disappears from the list of dropdown options. I also don't fully understand "Permanently Deleted" -- I think this means the value no longer exists as an option in the dropdown (it was deleted) but historical tickets remain with that now deleted option selected.
Can anybody explain the "Cascade prompts" option and if/how this is related to the "Permanently Deleted" dropdown option. TYSM
0
Dainne Kiara Lucena-Laxamana
Hi Ronald
You are correct that the "Permanently Deleted" is for the deleted value.
So the main reason why it shows "Permanently Deleted" when you choose the "Cascade" filter, is that your tickets that populate in the report may have deleted values. From there you would have the option to exclude it from the report & only active values would be loaded.
To further explain the cascade option, for example you have a data filter for it to only show tickets with the tags a,b,c,d,e & the ticket Ids from 1-100. If you click on the cascade option for ticket tag D, it would then only load the ticket ids that have the ticket tag D.
1
Rebeca
I would like to add a report to a dashboard and make it so that on Mondays, the dashboard shows the stats from the previous week. Is it possible to automate this?
I tried adding a time filter on the dashboard to manually select the date range, but when I select them, looks like it's not applied.
Any input is appreciated, thanks in advance.
0
Melissa Norton
Rebeca you'll need to change your time filter to last week and then add a bookmark and pin the bookmark for last week to "stick" for your deliveries. Pinning the bookmark makes it the default state of the dashboard. You can also hide the bookmark and/or time filter if you want.
0
mfg
When selecting the attributes for the change attribute widget, the attribute options appear to be limited (maybe by the attributes currently in use by the reports on the dashboard?). How do you add additional attributes to the widget?
Is there a way to limit the reports that are affected by the change attribute widget, in the same fashion as the [exclude filters] config on reports?
0
Gab Guinto
Yes, the selection is limited to the current filters applied at the report level. An attribute will only show up in the list if it's applied as filter to at least one of the reports added to the dashboard. A change attribute will allow you to switch the original filters added to the report to another attribute filter.
And, yes, you can configure a report widget to exclude certain change attributes also via the Exclude filters menu.
0
Efrat Barak Zadok
Is it possible to have the same time filter across multiple tabs and also have a default time filter set across all the tabs?
So for example - if a view opens any of the tabs he will get last 30 days data filtered but if he changes that filter in any of the tabs - it will affect all other tabs as well?
0
James G
Yes, you can easily filter across multiple tabs by copying the same dashboard filter from one tab and pasting it to other tabs within the same dashboard. For more information on this feature, please refer to this helpful guide - Filtering results across multiple tabs.
Additionally, you have the option to set a default time filter for all your dashboard tabs by adding a bookmark widget to each tab within the same dashboard. By doing this, whenever you open the dashboard, all of the tabs will be filtered based on the bookmark that you have set in each of the tabs you have. You can find detailed instructions on how to do this here - Working with dashboard bookmarks.
0
Anthony Pignatari
I'm attempting to create a data filter based on Requester Email address, however the filter appears the show every requester email, which isn't what I'm looking for. Is there a way I can limit what emails populate in that filter? Perhaps by email domain, requester organization etc? Thanks!
0
Elina
Hi, thank you for the article! Will the Copy Paste of the Time filter also be available in Explore Beta? Is there a way we can have one Time Filter across multiple tabs? Thank you in advance
0