Summary: ◀▼
The forecast vs actual page helps you compare predicted and actual inbound volume, staffing, average handle time, and service levels. It shows variances and recent trends to improve planning and staffing decisions. You can view data by workstream and time intervals, analyze staffing needs versus attendance, and track SLA performance to better manage support operations and adjust resources based on real outcomes.
While the forecast page serves as a forward-looking planning tool, the Forecast vs. actual page provides a retrospective view, focusing on what was predicted compared to what actually happened and the causes of any variance.
The forecast vs. actual page includes actual results, historical context, and reconciliation adjustments when workstream definitions change. It displays a comparison of your forecasted data and the actual outcomes for inbound volume, staffing, and average handle time at a given date and time. It also shows your actual service levels and indicates whether these have been met or missed.
For example, you usually receive about 50 tickets around 3 PM each day. However, today you’ve already seen a sudden increase to 70 tickets at that time. The short-term forecast takes this recent information into account and adjusts the expected number of tickets for the next hour to help you plan more effectively.
The forecast vs actual page displays your forecasted data compared to the actual outcomes for inbound volume, staffing, and average handle time. It also shows your actual service levels and indicates whether these have been met or missed.
This article contains the following topics:
- Accessing and using the Forecast vs actual page
- Understanding the Forecast vs actual page
- Exporting Forecast vs actual data
Related articles:
Accessing and using the Forecast vs actual page
You must be a WFM admin or have permission to access the Forecast vs actual page.
-
In Workforce management, click the agent folder (
 ) in the navigation bar, then select Forecast vs
actual.
) in the navigation bar, then select Forecast vs
actual.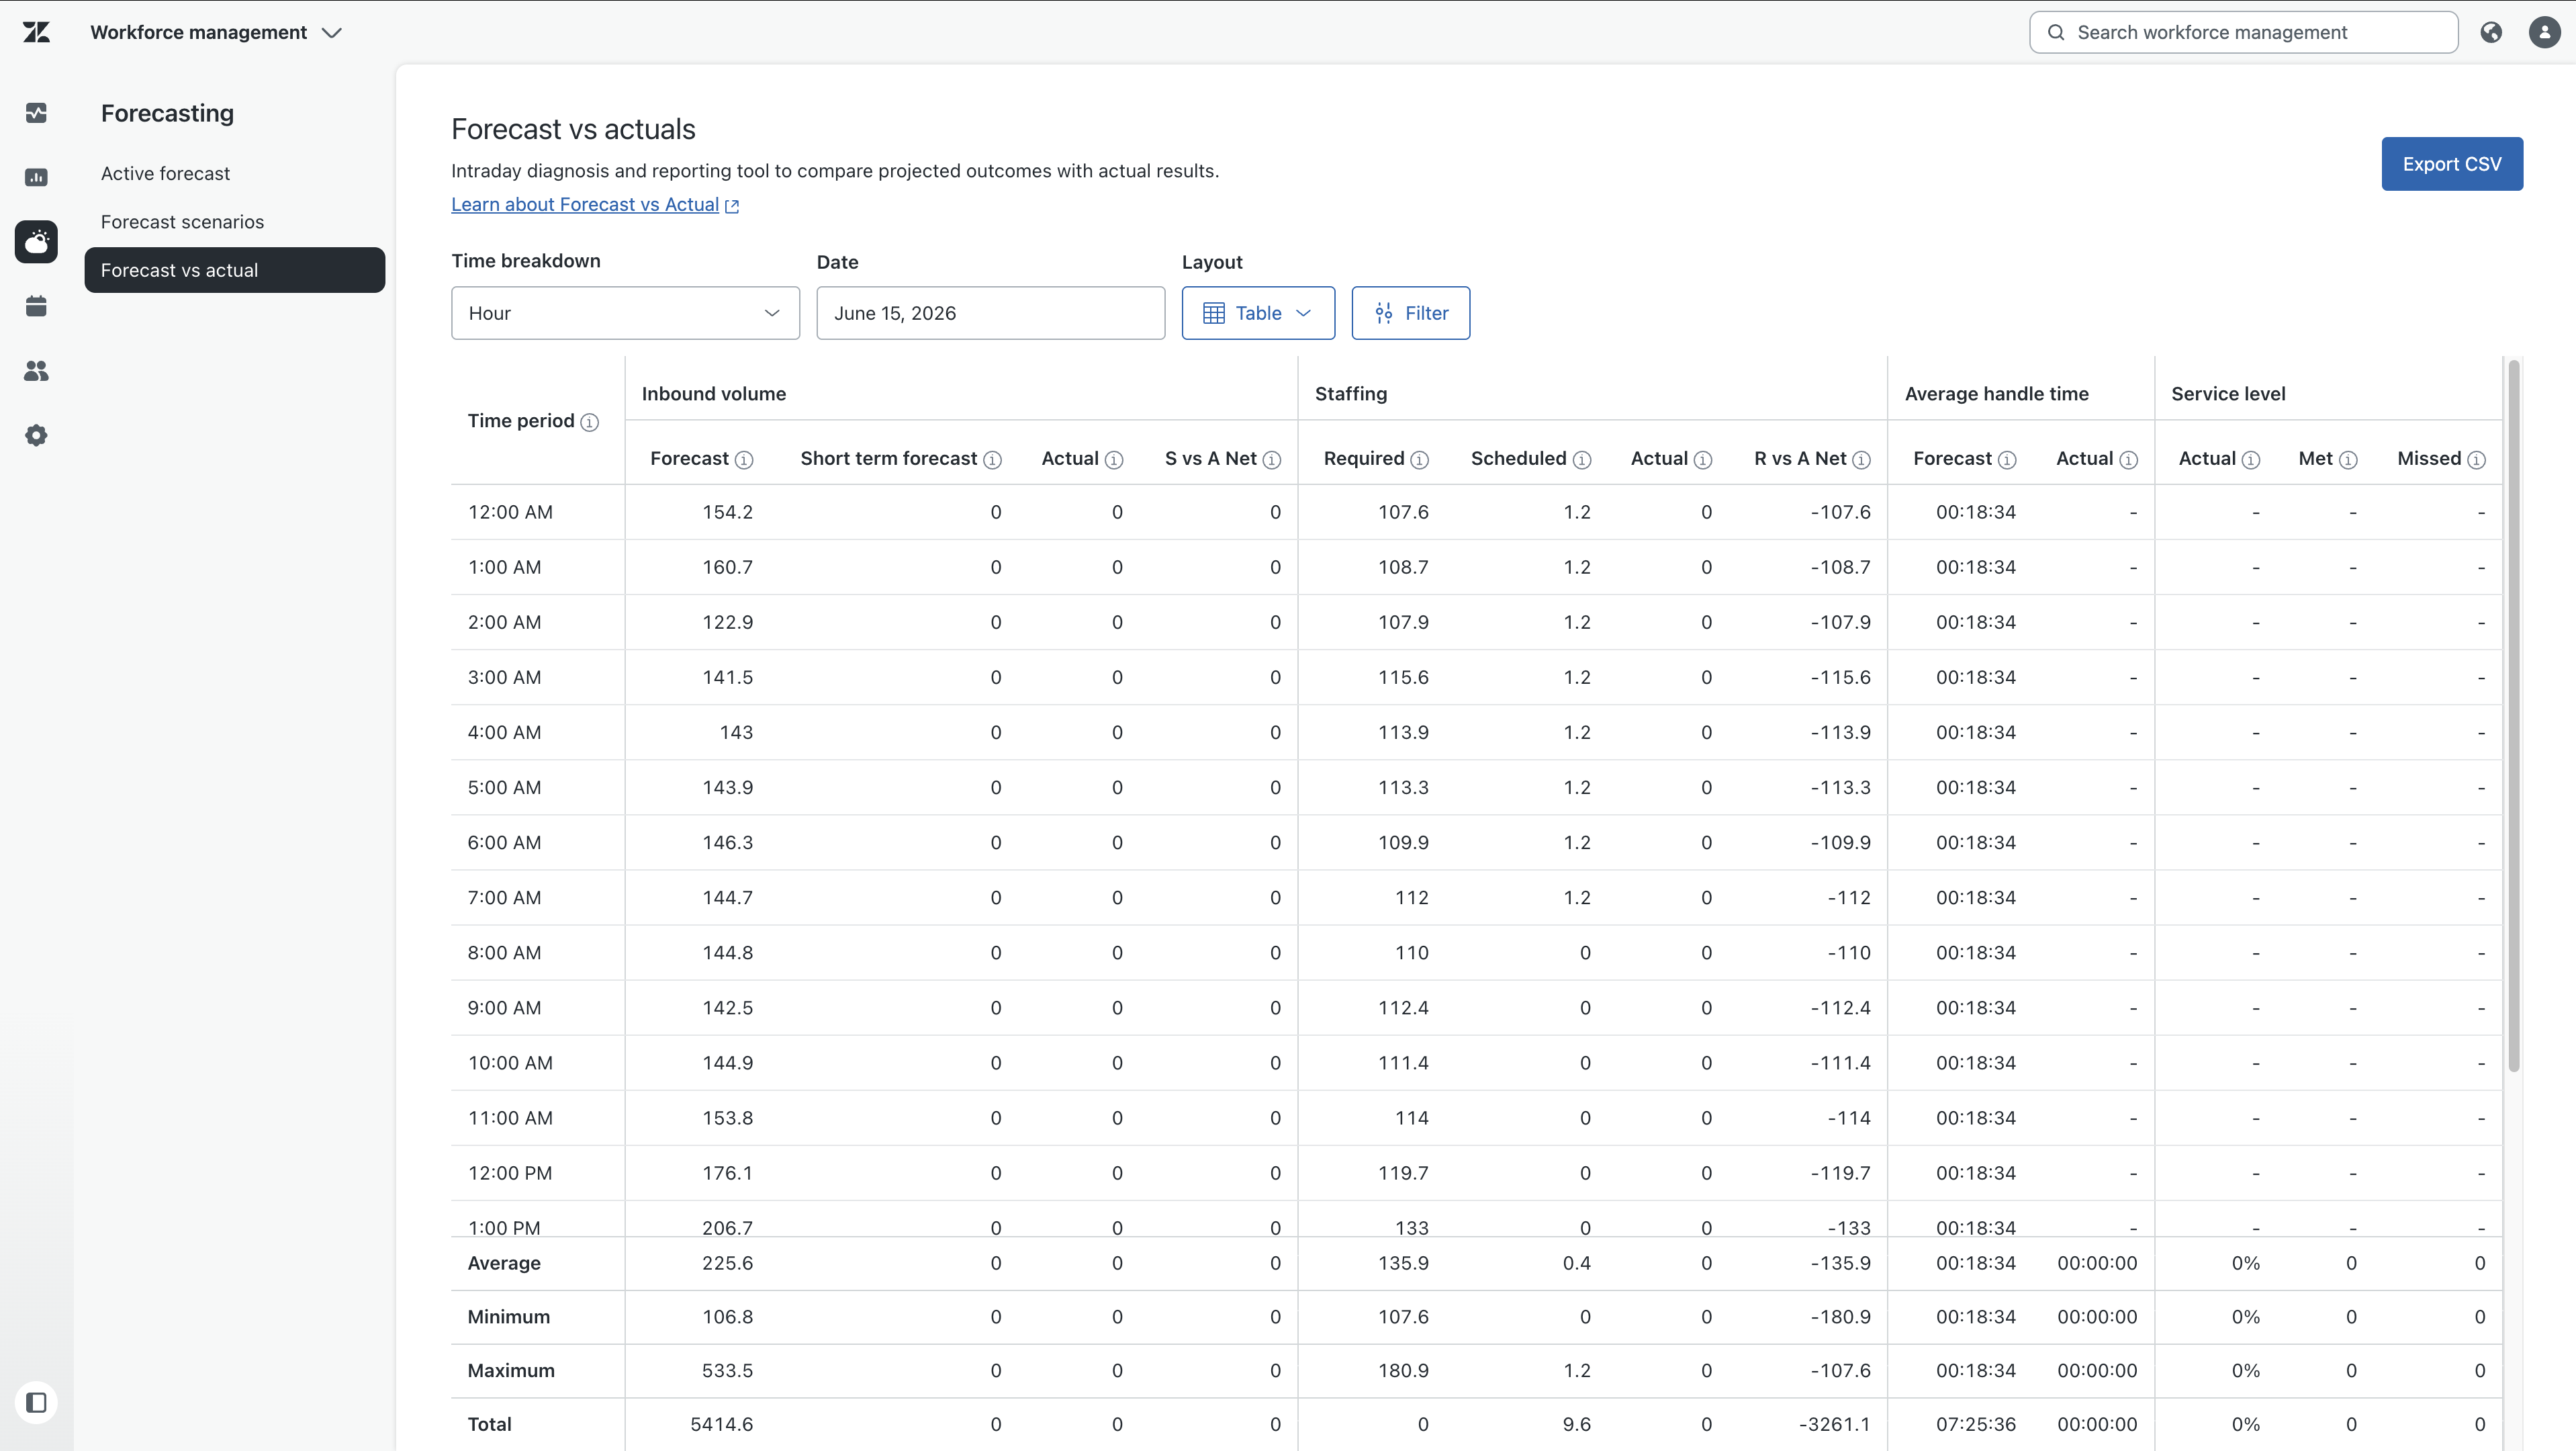
You can take any of the following actions:
-
Filter workstreams: Click the filter icon (
 ) to display comparison data for all
workstreams (default) or only the ones you select.
) to display comparison data for all
workstreams (default) or only the ones you select. - Choose a date: Click the date picker or use the arrow icons to select the date you want to display comparison data for.
- Choose a time breakdown: Use the drop-down arrow to view the data by hour, 30 minutes, or 15 minutes.
-
Choose a layout: Click the graph icon (
 ) to switch between displaying a table
(default) or a graph of your inbound
volumes.
) to switch between displaying a table
(default) or a graph of your inbound
volumes. -
Show or hide each inbound volume graph: Click the eye icon (
 ) next to each inbound volume indicator to show
or hide it:
) next to each inbound volume indicator to show
or hide it:- Forecast
- Short term forecast
- Actual
- Export CSV: Create an export of the report for the selected date.
-
Filter workstreams: Click the filter icon (
Understanding the Forecast vs actual page
On the forecast vs actual page, you can navigate to past and future dates.
Future dates can’t display actual results, average handle time, and service level data.
Sources for each data column vary but primarily come from forecasts, real-time Zendesk data, and internal WFM storage APIs.
The forecast vs actual report contains four sections:
Inbound volume
On the Forecast vs actual page, the inbound volume section includes the following data for the selected workstreams:
- Forecast: Your predicted inbound ticket volume. The inbound volume is calculated based on all available historical data, which can range from a minimum of 30 days to a maximum of 2 years, depending on the amount of data in your account.
-
Short term forecast: The inbound volume calculations based on the
actual results from the last 24 hours of data. The formula combines two averages: 24
hours and the selected upcoming time interval (hour, 30 minutes, or 15 minutes) to
adjust the forecast, reflecting the most recent trends. It uses the following values:
- Forecasted ticket count: This is the predicted number of inbound tickets for the selected upcoming time interval.
- Recent historical data: To enhance accuracy and adaptability, the calculation considers recent actual results alongside forecasted ticket numbers.
It averages the inbound volume over the last 24 hours for the exact time interval you're interested in. It also averages the inbound volume over the last hour to provide more current context. The formula combines these two averages (24 hours and 1 hour) to adjust the forecast, reflecting the most recent trends.
Finally, it divides the original forecasted ticket count by the average of these recent volumes to normalize it.
-
Actual: The actual numbers of inbound tickets received for each
workstream. Each time a ticket matches a workstream, it’s counted, meaning the same
ticket may be counted more than once if it’s updated and meets the conditions for
another workstream.Note: Workstream condition changes can affect the forecast vs. actual results because actual results keep the original condition "as it was" at the event time, while the forecast recalculates history using current workstream definitions "as they are."
- S vs A Net (Short term vs Actual net volume): The difference between the actual volume and the short term forecasted volume. If you don't change the workstream after its creation, the historical volume in Forecast matches the Actual results on S vs A Net. However, if you change one of the workstream conditions, Actual results display the inbound volume associated with the original workstream condition up to the point of change, while the Forecast page shows the volume using the new workstream conditions. This results in different values.
-
Forecast variance: Calculated as
Forecast - Actual. This metric gives operations teams a straightforward measure of forecasting variance against actual inbound performance.Tip: In the CSV export, this column appears directly after S vs A Net.
Staffing
The staffing section of the Forecast vs actual page includes the following data for the selected workstreams:
- Required: The number of full-time equivalents (FTEs) required to meet the forecasted volume. It's generated based on the set staffing parameters.
- Scheduled: The number of FTEs scheduled according to your Schedule page.
- Actual: The number of scheduled FTEs actually in attendance based on your Agent activity.
- R vs A Net (Required vs Actual net volume): The difference between the required and actual staffing.
Average handle time
On the Forecast vs actual page, the average handle time section includes the following data for the selected workstreams:
- Forecast: The forecasted average handle time (AHT) for the specified interval.
- Actual: The actual AHT for that interval.
Service level
- Actual: The actual service level percentage for each interval.
- Met: The number of tickets that met the SLA.
- Missed: The number of tickets that didn't meet the SLA.
Exporting Forecast vs actual data
You can export your Forecast vs actual reporting data to a CSV file for advanced analysis, troubleshooting, or integration with external business intelligence (BI) tools. The CSV export closely mirrors the layout and behavior of your UI filters.
Supported granularities and export limits
- 15m: Generates 96 rows per day, per workstream (one row for each 15-minute interval). The maximum date range is 1 day.
- 30m: Generates 48 rows per day, per workstream (one row for each 30-minute interval). The maximum date range is 1 day.
- 1h: Generates 24 rows per day, per workstream. The maximum date range is 1 day.
To export Forecast vs actual data
- From the Forecast vs actual page, use the date picker to select a date.
- Under Time breakdown, select a granularity.
- Under Filter, adjust your filters as needed for a single workstream, a subset, or all workstreams.
- Click Export CSV.
The download starts.