Verified AI summary ◀▼
Use the self-service dashboard to analyze help center activity, including user sessions and page views. Track metrics like session duration, ticket deflections, and visitor numbers. Customize reports to focus on specific scenarios, such as filtering by brand or content type. This tool helps you understand content performance and user engagement, aiding in optimizing your support resources.
Zendesk features a prebuilt self-service dashboard that helps you understand how often your help center articles and community posts are being viewed and who is viewing them.
The dashboard can help you:
- See user session outcomes for specific users.
- Look at trends across the different roles.
- Understand content performance, including which articles are most helpful and which are responsible for the most tickets submitted.
You can edit and customize the self-service dashboard by cloning it (see Cloning dashboards).
The information in Explore dashboards is updated on a schedule. The schedule depends on which Explore plan you are using. For details, see Data refresh intervals for Explore plans.
This article contains the following topics:
- Accessing the self-service dashboard
- Understanding the self-service dashboard reports
- Filtering the reports for specific scenarios
Related articles:
Accessing the self-service dashboard
Use the following procedure to access the self-service dashboard.
To access the self-service dashboard
- Click the Zendesk Products icon (
 ) in the top bar, then select Analytics.
 - From the list of dashboards, select the Zendesk Knowledge dashboard.
- Click the Self-service tab.
Understanding the self-service dashboard reports
The Self-service dashboard shows information about page views and user sessions. You can filter the reports on the dashboard by Time, Brand, Visitor role, Language, and Sessions with search.
- Page views (articles and community posts)
- Searches
- Quick answers
Depending on your usage of other channels, the inclusion of these additional events might impact session duration, page view duration, and number of sessions and visitors.
Data for end users and anonymous users were impacted less by this exception, so filtering for end-user and anonymous user traffic prior to the date above will give you more accurate data.
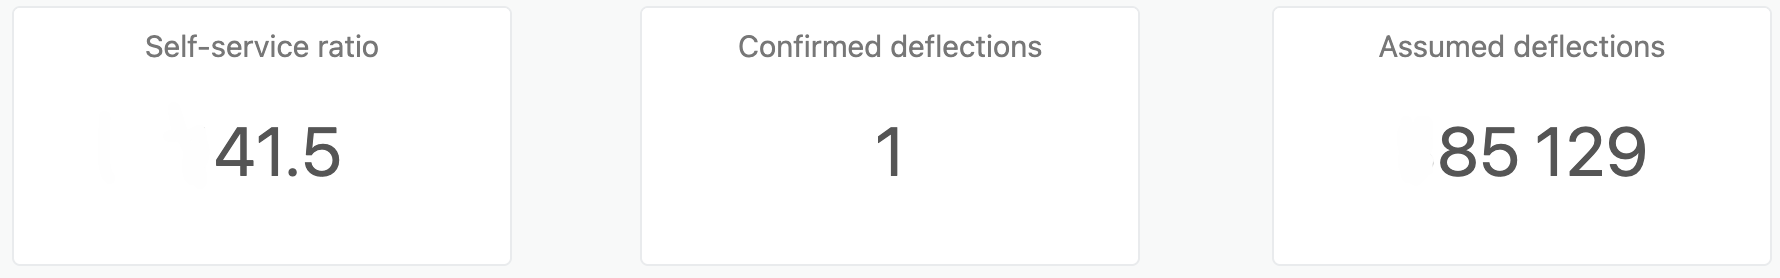
Self-service dashboard headline metrics
This tab displays the following headline metrics (KPIs) for the time range you specify:
- Self-service ratio: The number of sessions per ticket created in the help center.
- Confirmed deflections: The number of tickets that were deflected based on an article suggested on the help center request form.
- Assumed deflections: The number of times a visitor visits your help center and does not submit a ticket.
-
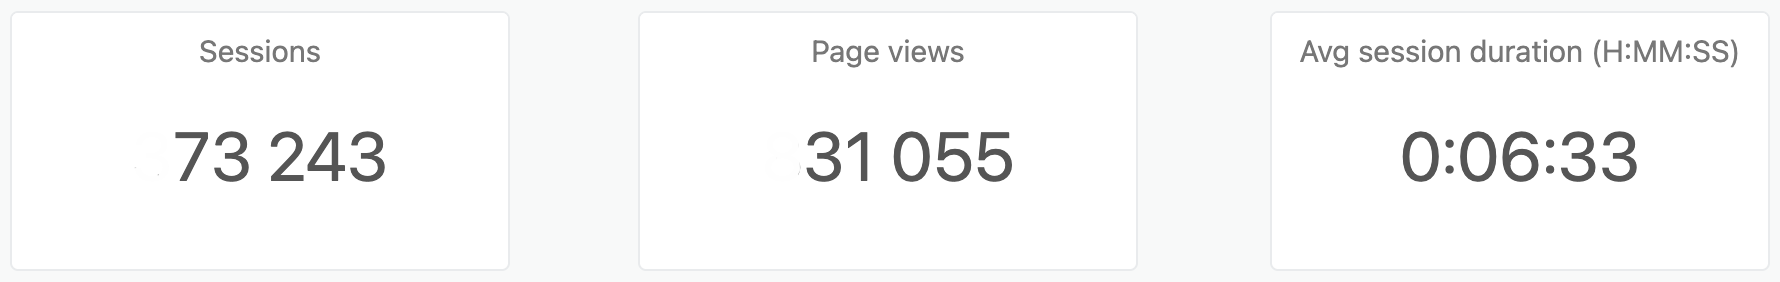
Sessions: The total number of visits during the date range you
specified. A session is defined as a period in which a user interacts with
your help center. This might include multiple page views, events, and other
interactions that occur in a single visit. Think of it as the time between
when they open your help center page until they close it. A session consists
of one or more of the following events:
- Page views:
- Article views
- Community post views
- Searches
- Suggested article clicked from the request form
- Tickets submitted by the user
- A quick answer search result shown
A user session is limited to 100 of these events or a 30 minute timeout, whichever happens first. For sessions that reach the event limit, a new session will only start after the user has gone inactive for 30 minutes.
Tip: The visitors metric is a count of unique visitors across the filtered parameters in a report. The session metrics are a count of the number of sessions attributed to those visitors. To get an idea of overall user traffic, the session metrics should be used. The visitors metric is intended to count the unique users who have visited your help center. - Page views:
- Page views: The total number of page views. A page view is defined as an instance of an article or community post being loaded or reloaded in the visitor's web browser. Each time the visitor revisits or reloads the page, it's counted as an additional page view.
- Avg session duration: The average length of each session.
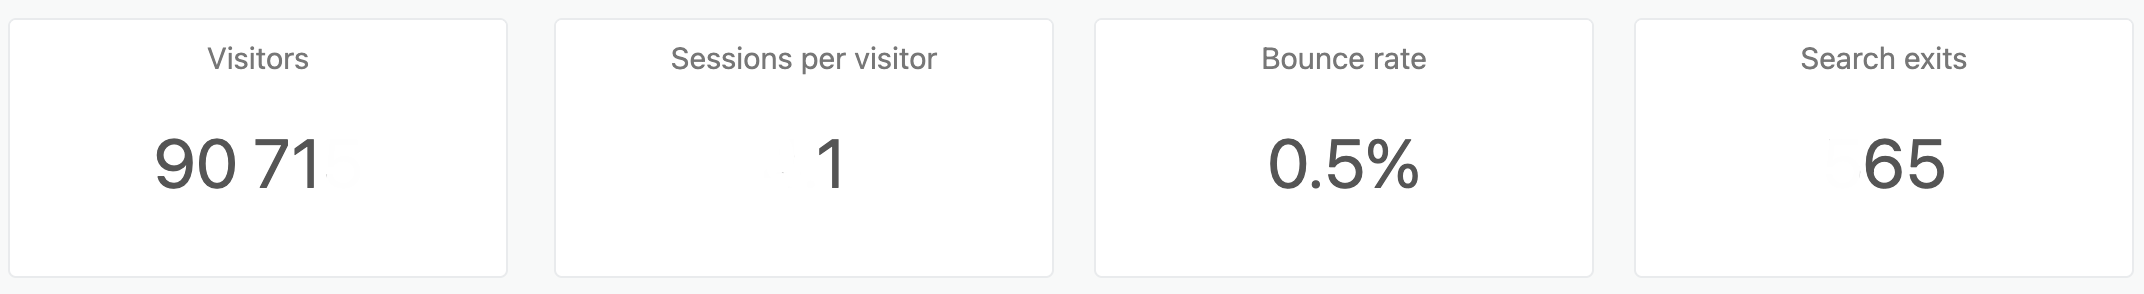
- Visitors: The number of unique visitors to your help center.
- Sessions per visitor: The average number of sessions per unique visitor.
- Bounce rate: The percentage of sessions where the user did not view any pages (articles or community posts).
- Search exits: The number of sessions that ended on the search results page.
The results from the self-service datasets and the other Knowledge datasets might differ due to the nature of how a session is defined as well as the ability for users to control if and how they’re tracked. This includes factors such as:
- Anonymous users will not be tracked if anonymous user tracking is not implemented or has been opted out of by the user.
- Session events are not registered after a session has reached the 100 event limit. That visitor will only register new events when their next session begins.
This dataset is meant to provide insights into users session outcomes and overall content performance while not being a complete audit of all user interactions.
Self-service dashboard reports
This tab displays the following reports for the time range and filters you specify:
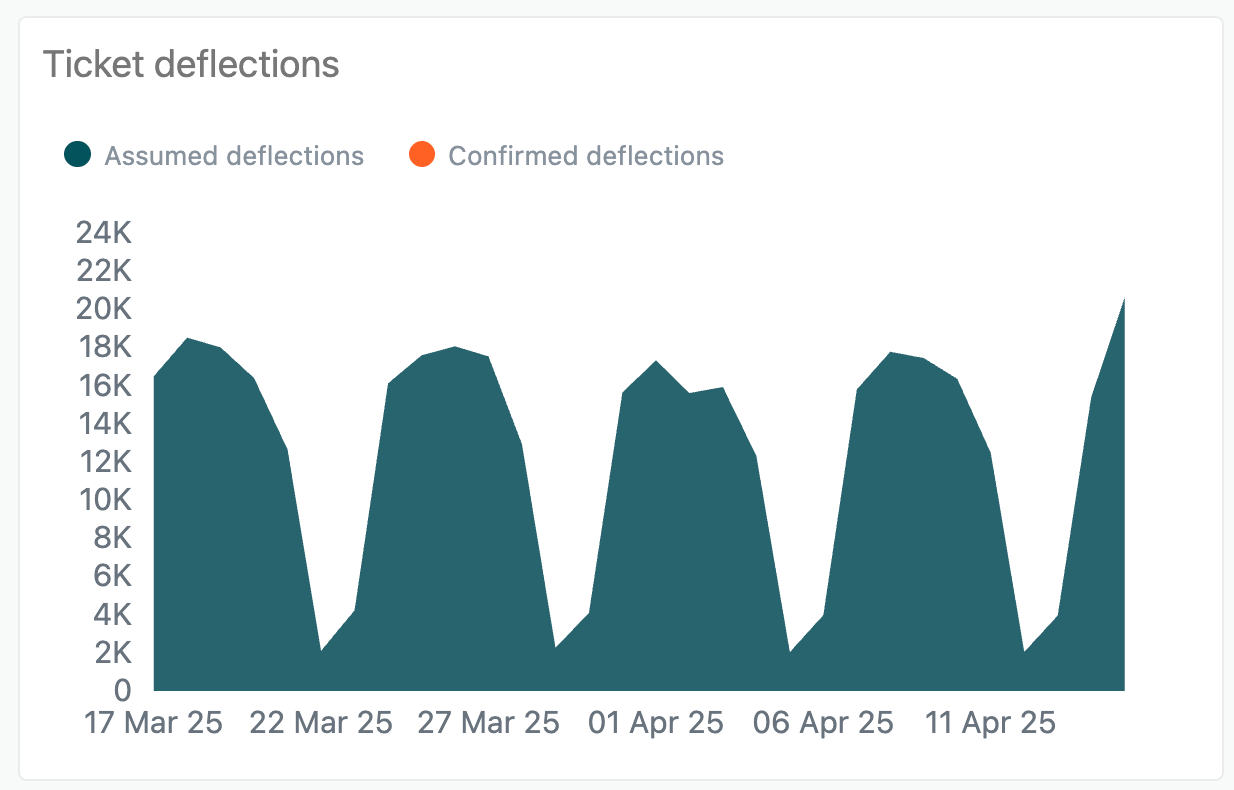
-
Ticket deflections: Displays the number of confirmed and assumed
ticket deflections over the date range you specify.
-
Self-service ratio over time: Displays the ratio of tickets to help
center sessions, allowing you to measure the efficacy of your available help
center content. This report displays your self-service ratio over the date
range you specify.

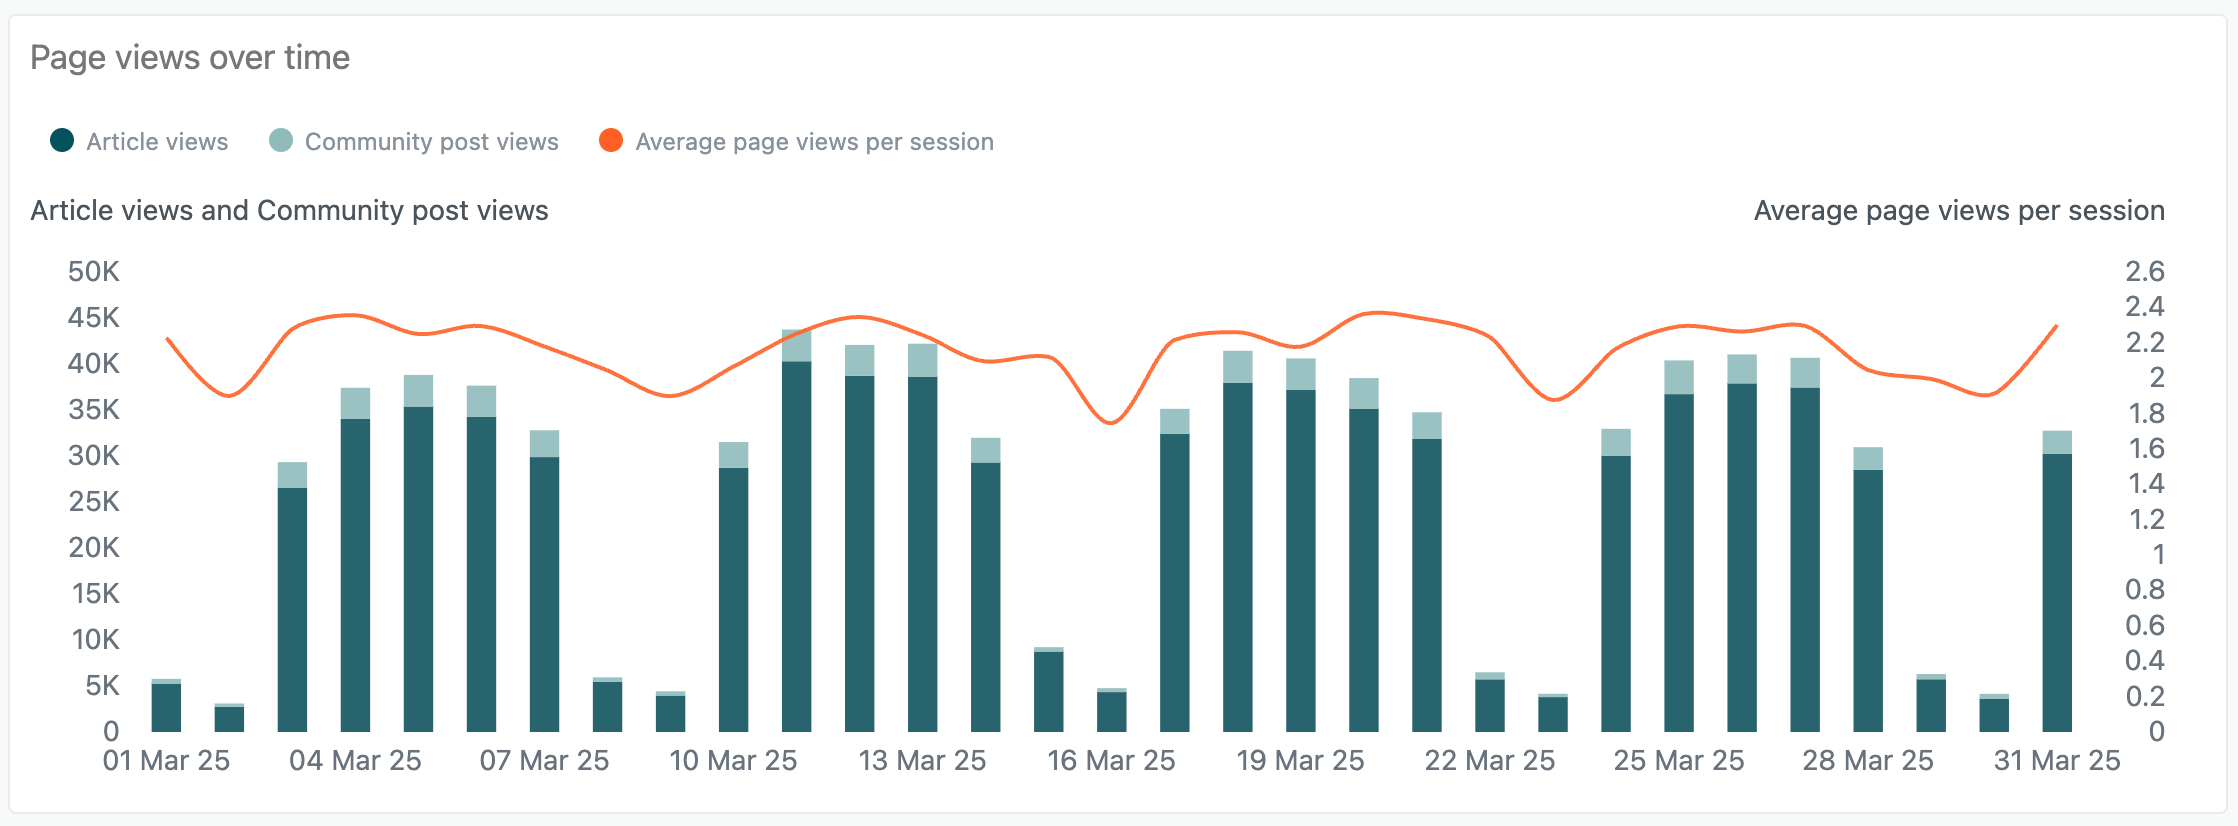
-
Page views over time: Displays page views and community post views
over the date range you specify. Additionally, a line graph shows the
average page views per session.
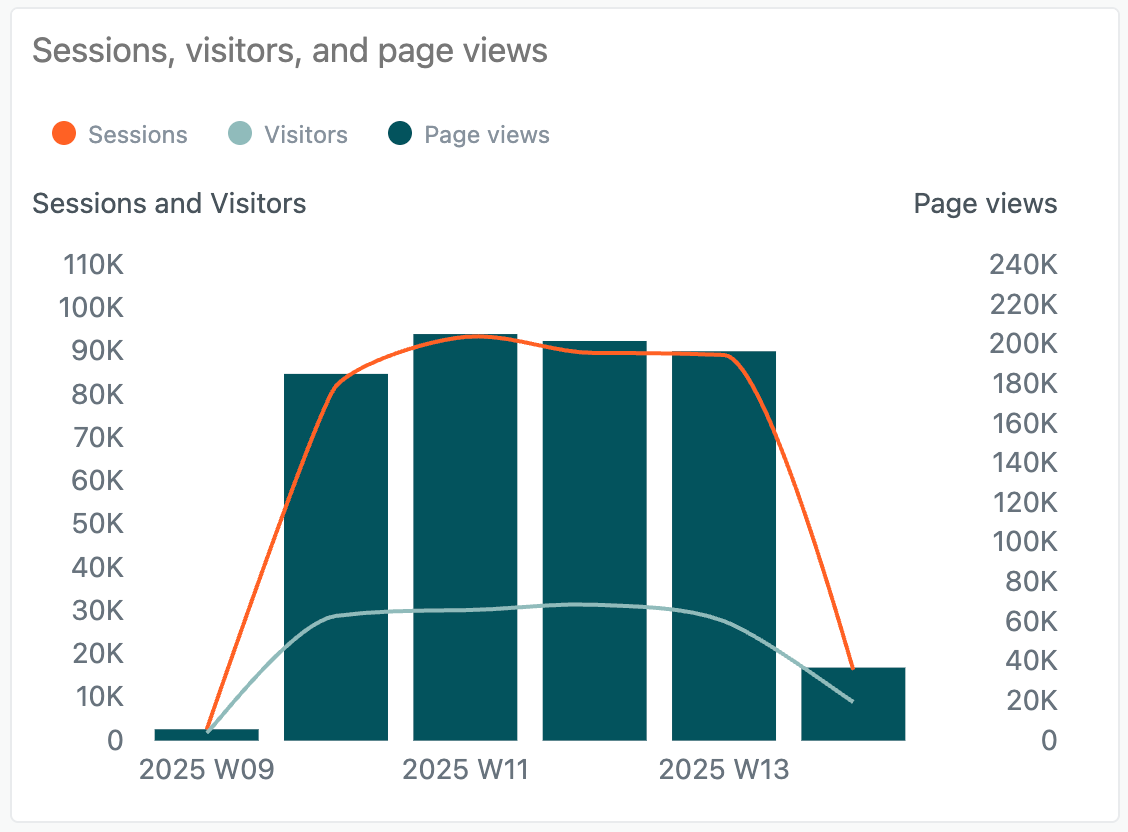
-
Sessions, visitors, and page views: A combined report showing the
number of sessions, visitors, and page views over the date range you
specify.
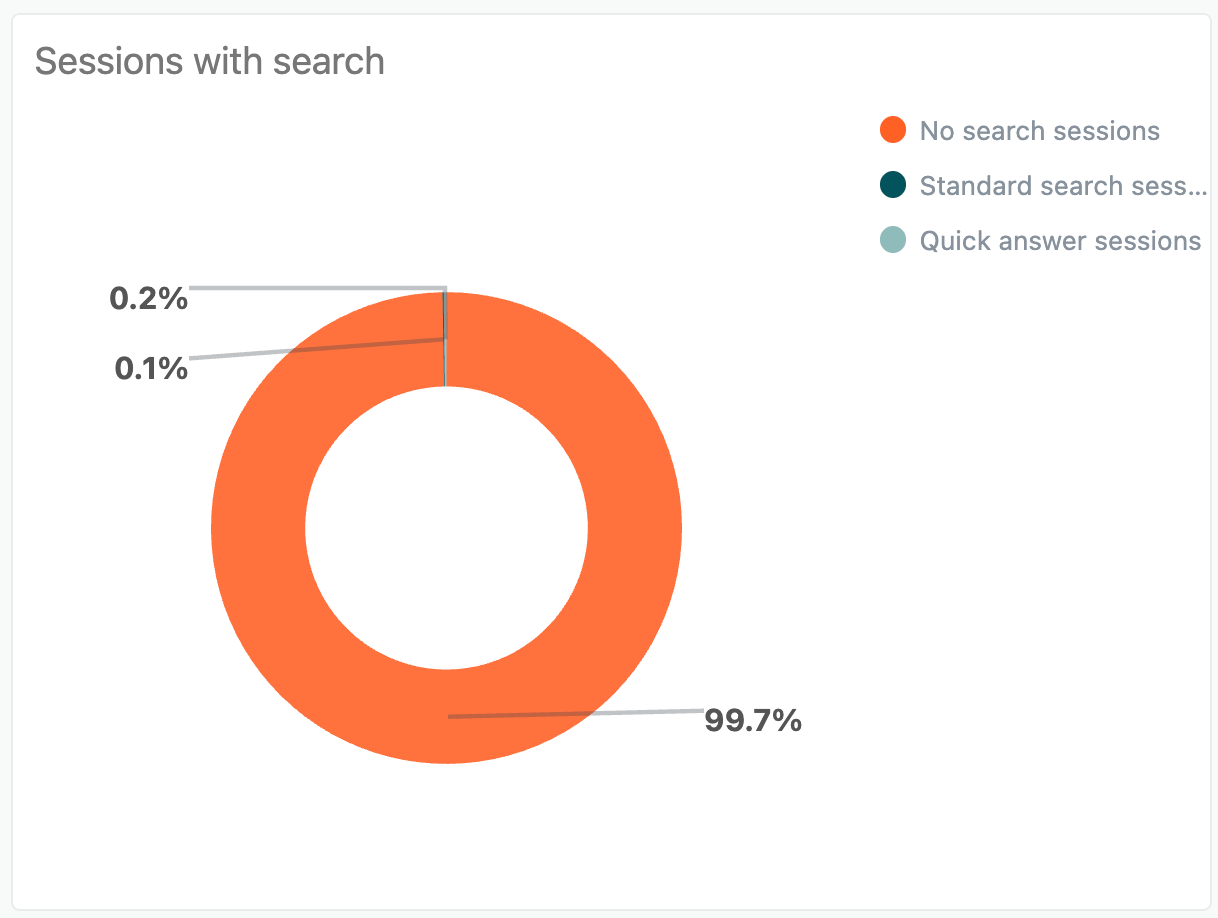
-
Sessions with search: Displays the percentage of sessions in which
the visitor performed no search, a standard search, or a quick answer
session.
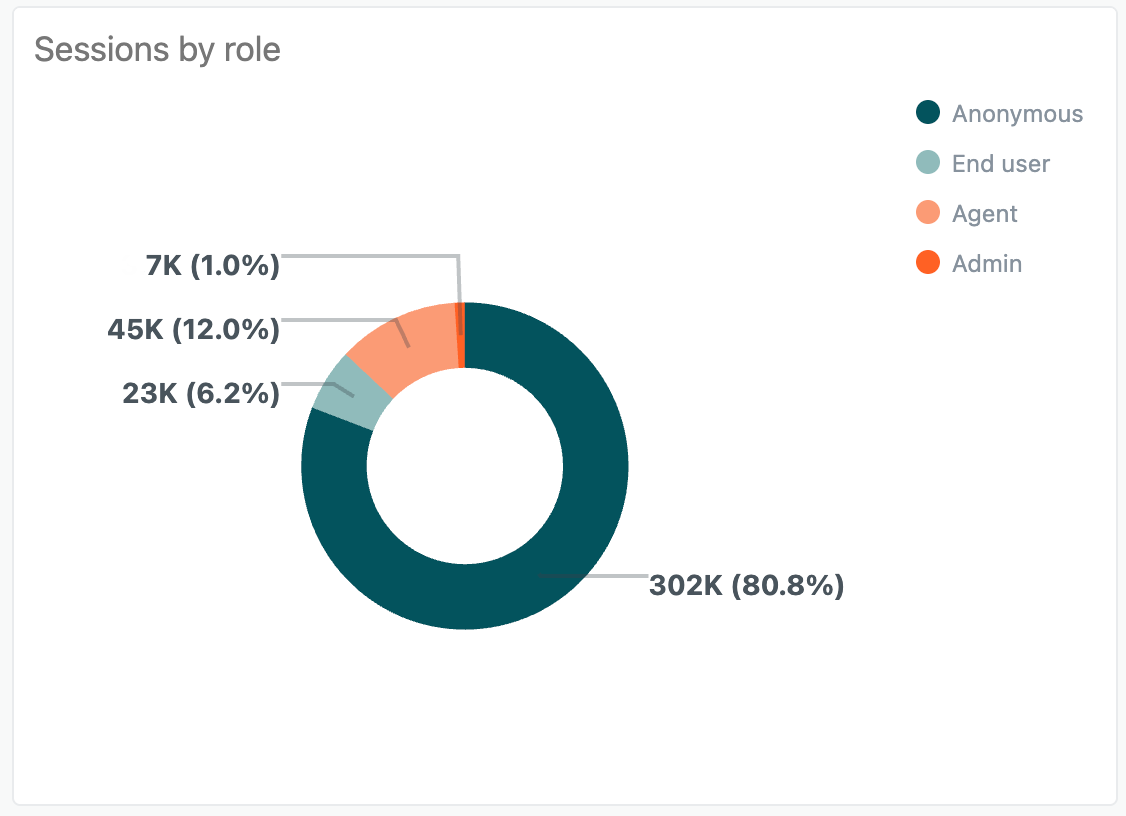
-
Sessions by role: Displays a pie chart showing the percentage of
sessions for each user role over the date range you specify.
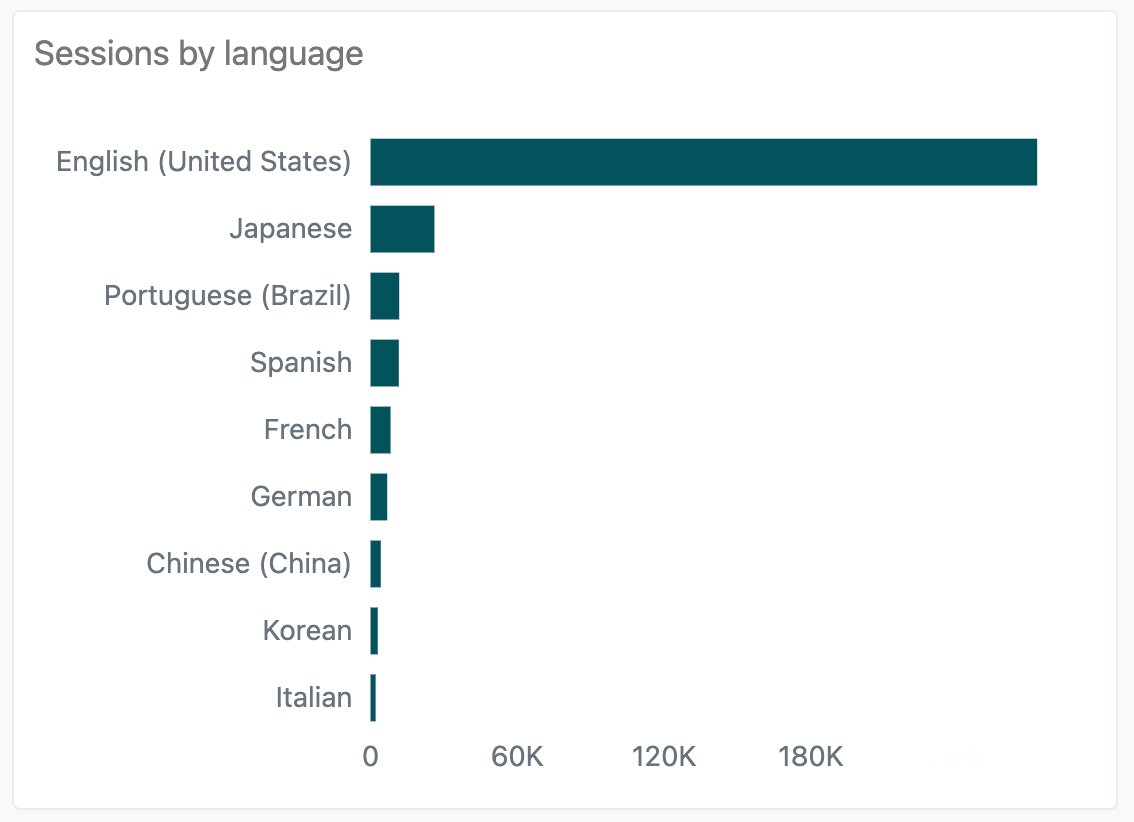
-
Sessions by language: Displays a bar chart showing the number of
sessions in each language over the date range you specify.
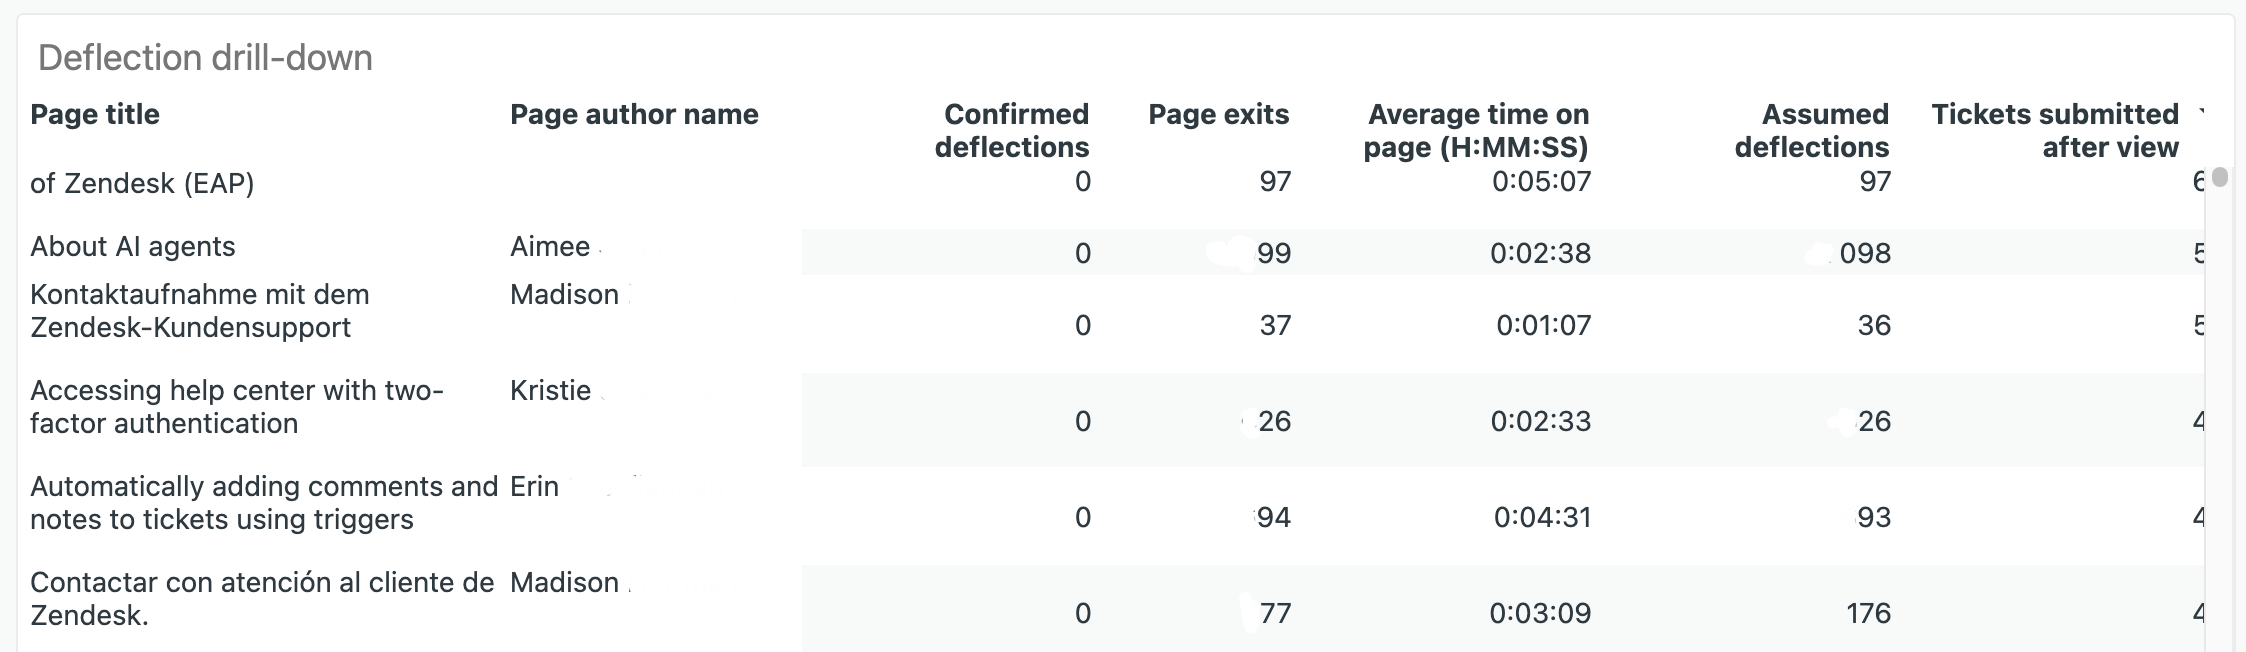
-
Deflection drill-down: Displays a detailed report showing each
article that was viewed together with the article author, the average time
that visitors spent on the page, and deflections.
You can filter this report by article section, article category, or community topic title. In addition, the brand, visitor role, and language filters at the top of the dashboard also apply to the deflection drill-down report.
Filtering the reports for specific scenarios
The following topics provide useful information about how you can filter the reports to get the information you need.
Filtering reports by brand
If a user visits multiple help centers under a given account, this will be tracked across separate sessions. This allows for the analysis of a specific help center’s performance, but you can filter for multiple, related brands on the dashboard if you want to get an overall picture of help centers which you are cross-referencing in your documentation.
Filtering by article and community posts
To optimize the display of combined article and community post results in Explore, the titles and ids of both community posts and articles have been combined to provide combined page attributes such as title. In reports where you are exposing a community post and article id in a combined report, the community post id will be NULL or blank if the item is an article, and the article id will be NULL or blank when the item is a community post. To filter for only community posts or articles, use the Page type attribute.