Summary: ◀▼
You can monitor agent interactions with AI features like auto assist, AI suggestions, and generative AI tools using a dedicated productivity dashboard. This dashboard helps track adoption, acceptance rates, and usage patterns, enabling you to optimize workflows and improve agent performance. It offers customizable reports and key metrics to analyze AI-driven support activities across different ticket attributes and timeframes.
Zendesk analytics features a prebuilt dashboard to help you monitor your Copilot activity. The Zendesk Copilot: Agent productivity dashboard provides a centralized view of how agents are interacting with Zendesk Copilot AI capabilities across three key areas: Auto assist, AI suggestions, and generative AI agent tools. This dashboard helps you understand adoption, track performance, and identify opportunities to optimize workflows using AI.
You can edit and customize the dashboard by cloning it (see Cloning dashboards).
The information in dashboards is updated on a schedule. The schedule depends on which Explore plan you're using. See Data refresh intervals for Explore plans.
This article contains the following topics:
Accessing the Zendesk Copilot: Agent productivity dashboard
Use the following procedure to access the Zendesk Copilot: Agent productivity dashboard.
To access the Zendesk Copilot: Agent productivity dashboard
- In analytics, click the Dashboard icon (
 ) in the left sidebar.
 - From the list of dashboards, click the Zendesk Copilot: Agent
productivity dashboard.
Understanding the Zendesk Copilot: Agent productivity dashboard reports
This dashboard contains the following tabs:
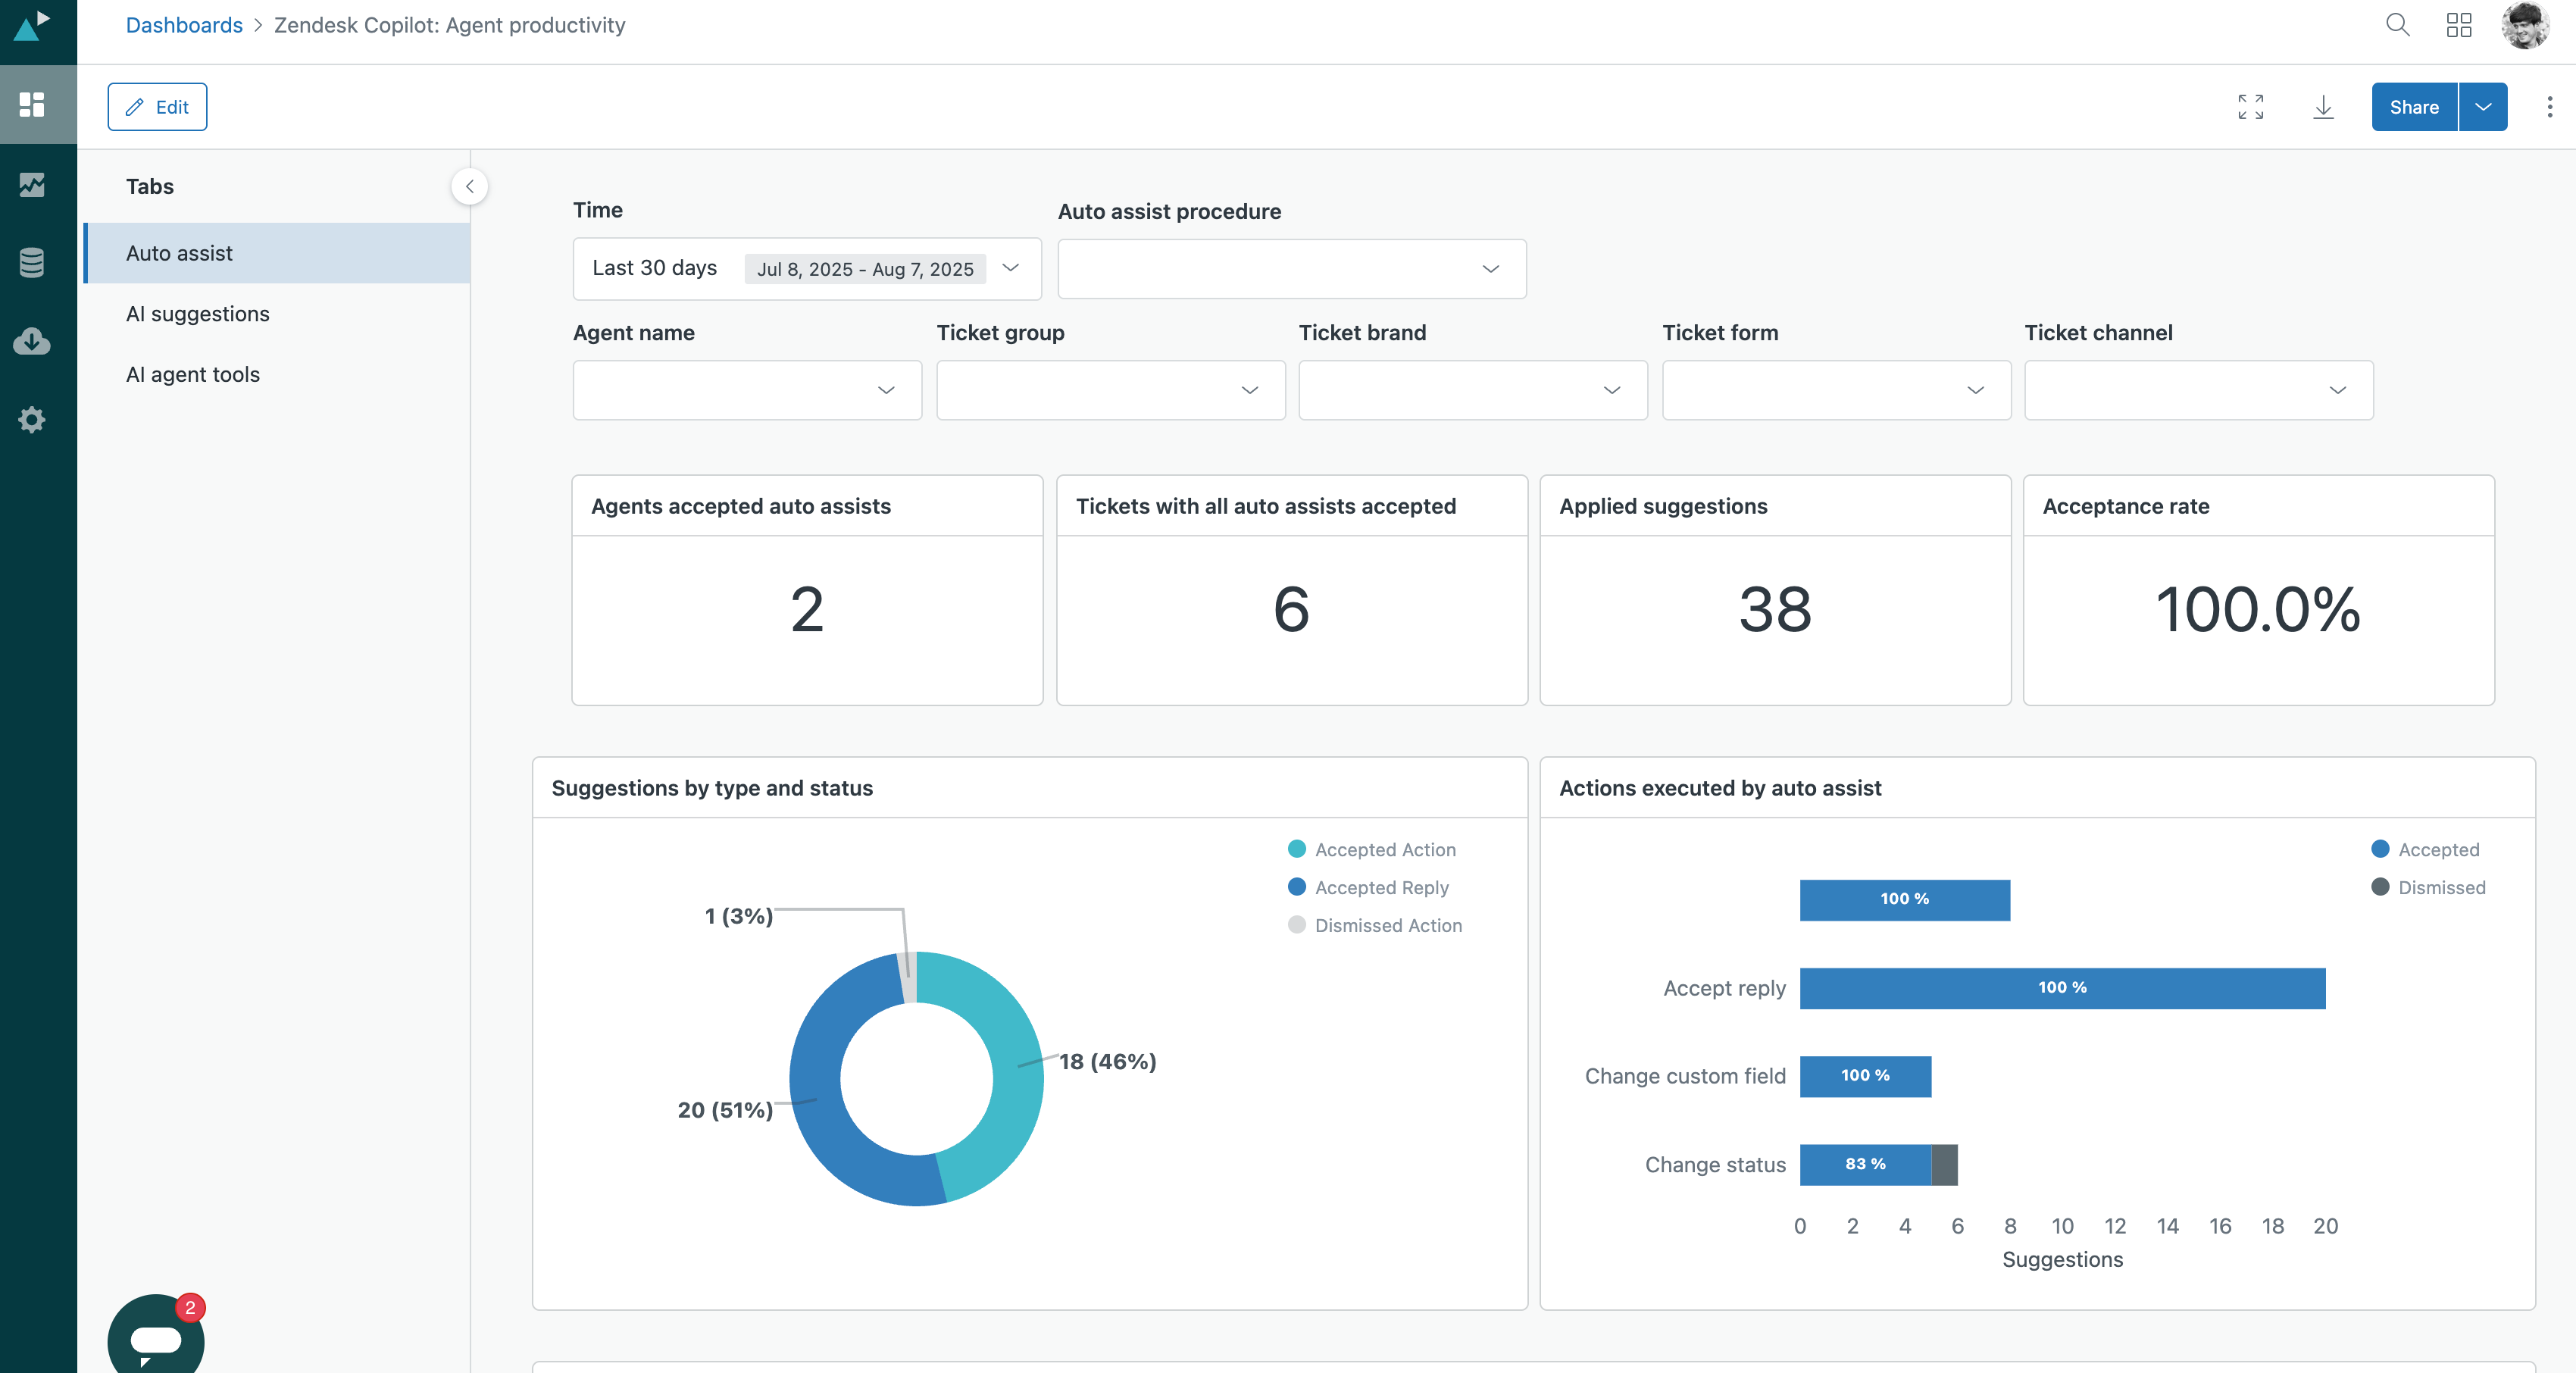
Auto assist tab
The Auto assist tab contains reports about agents' usage and acceptance of auto assist suggestions.
You can filter the reports by time, auto assist procedure, agent name, ticket group, ticket brand, ticket form, and ticket channel.
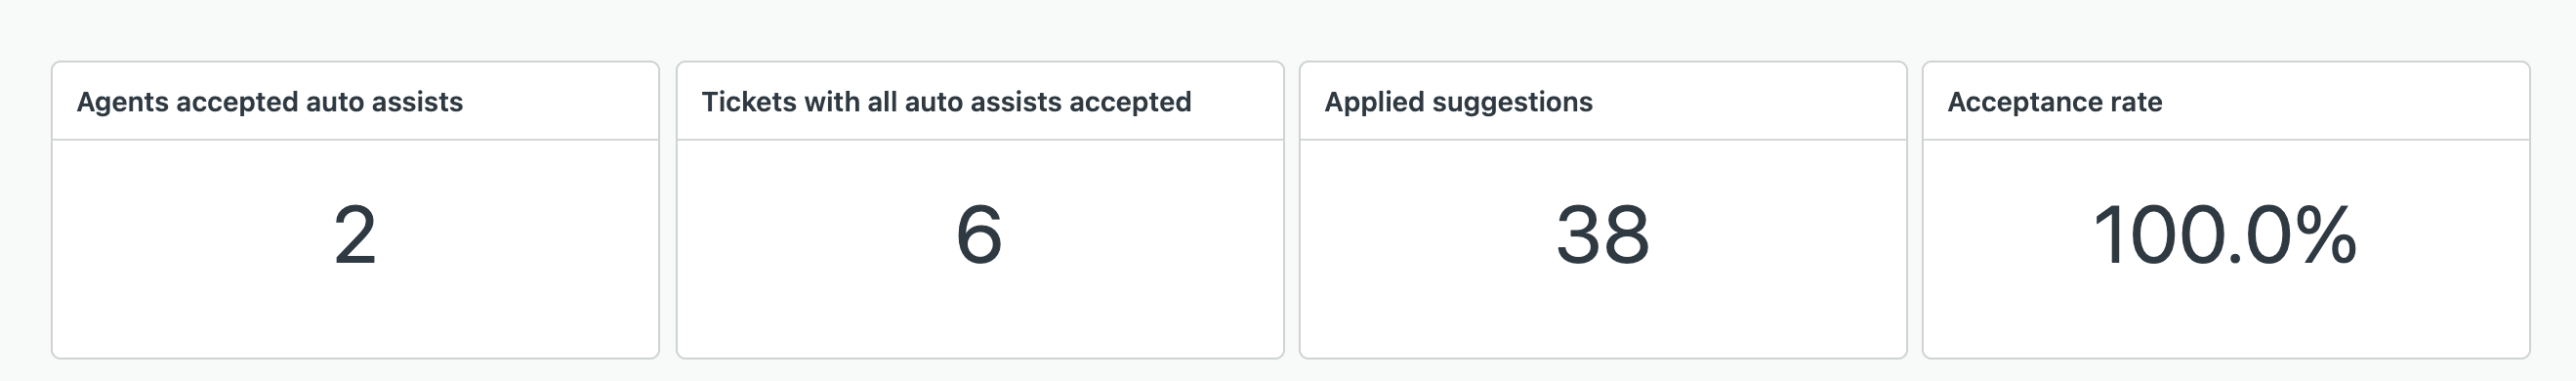
Auto assist tab headline metrics
- Agents accepted auto assists: The number of agents who accept an auto assist suggestion at least once.
- Tickets with all auto assists accepted: The number of tickets where an auto assist suggestion was accepted at least once.
- Applied suggestions: The number of suggestions applied by agents.
-
Acceptance rate: The number of auto assist suggestions that
were accepted, divided by the total number of auto assist
suggestions shown.
See the Auto assist metrics for more information.
Auto assist tab reports
-
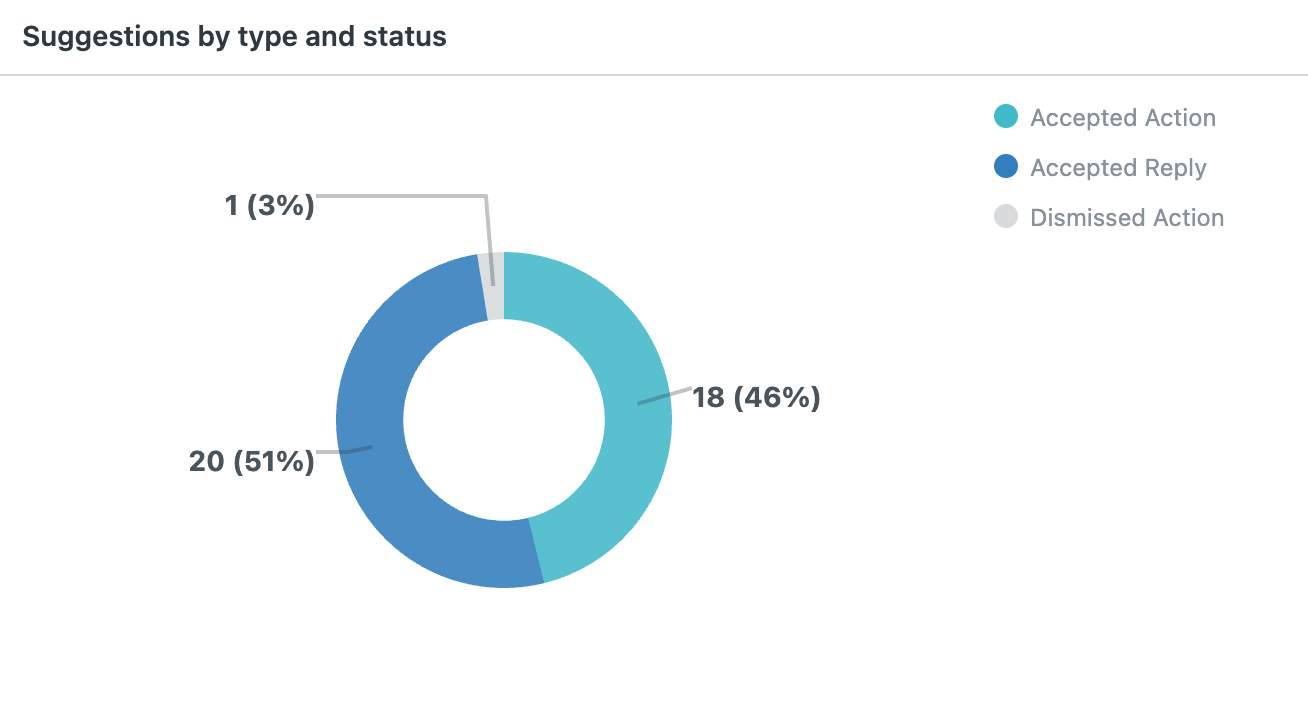
Suggestions by type and status: A pie chart showing the
number of auto assist suggestions by type (reply or action) and
whether they were accepted or not.
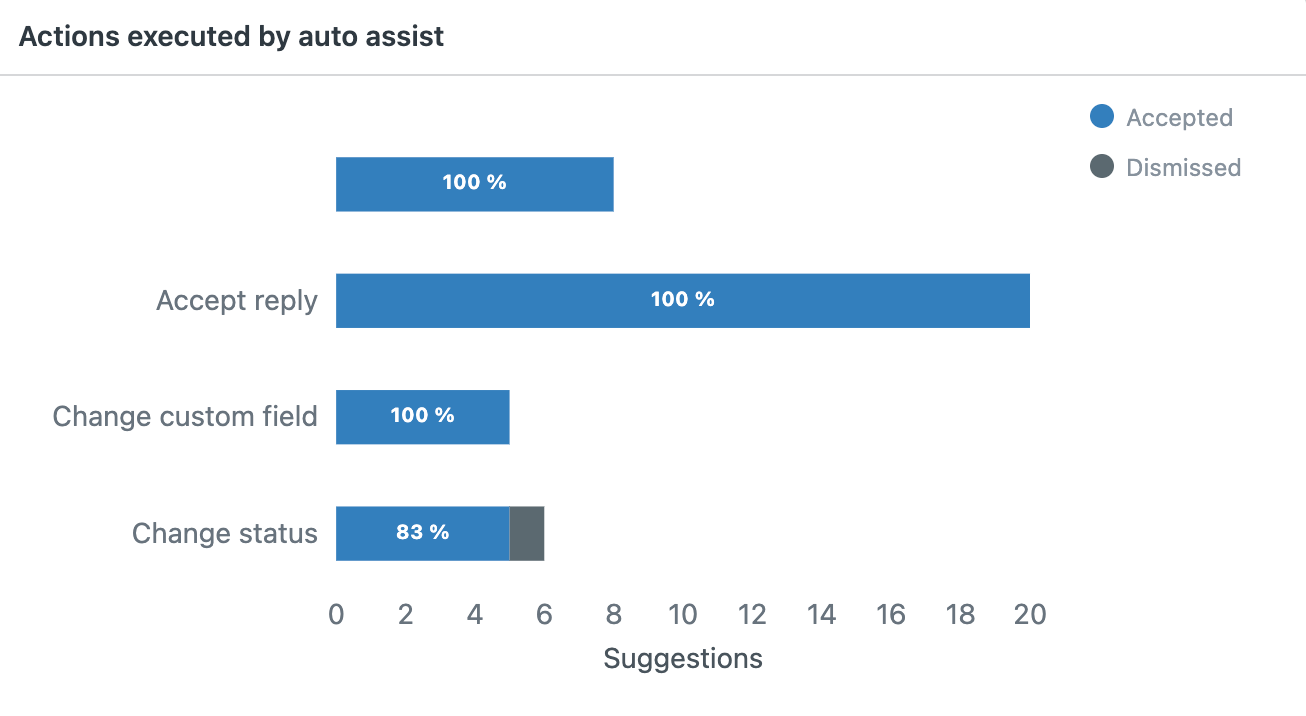
-
Actions executed by auto assist: A bar chart showing the
number of actions that were executed by auto assist.
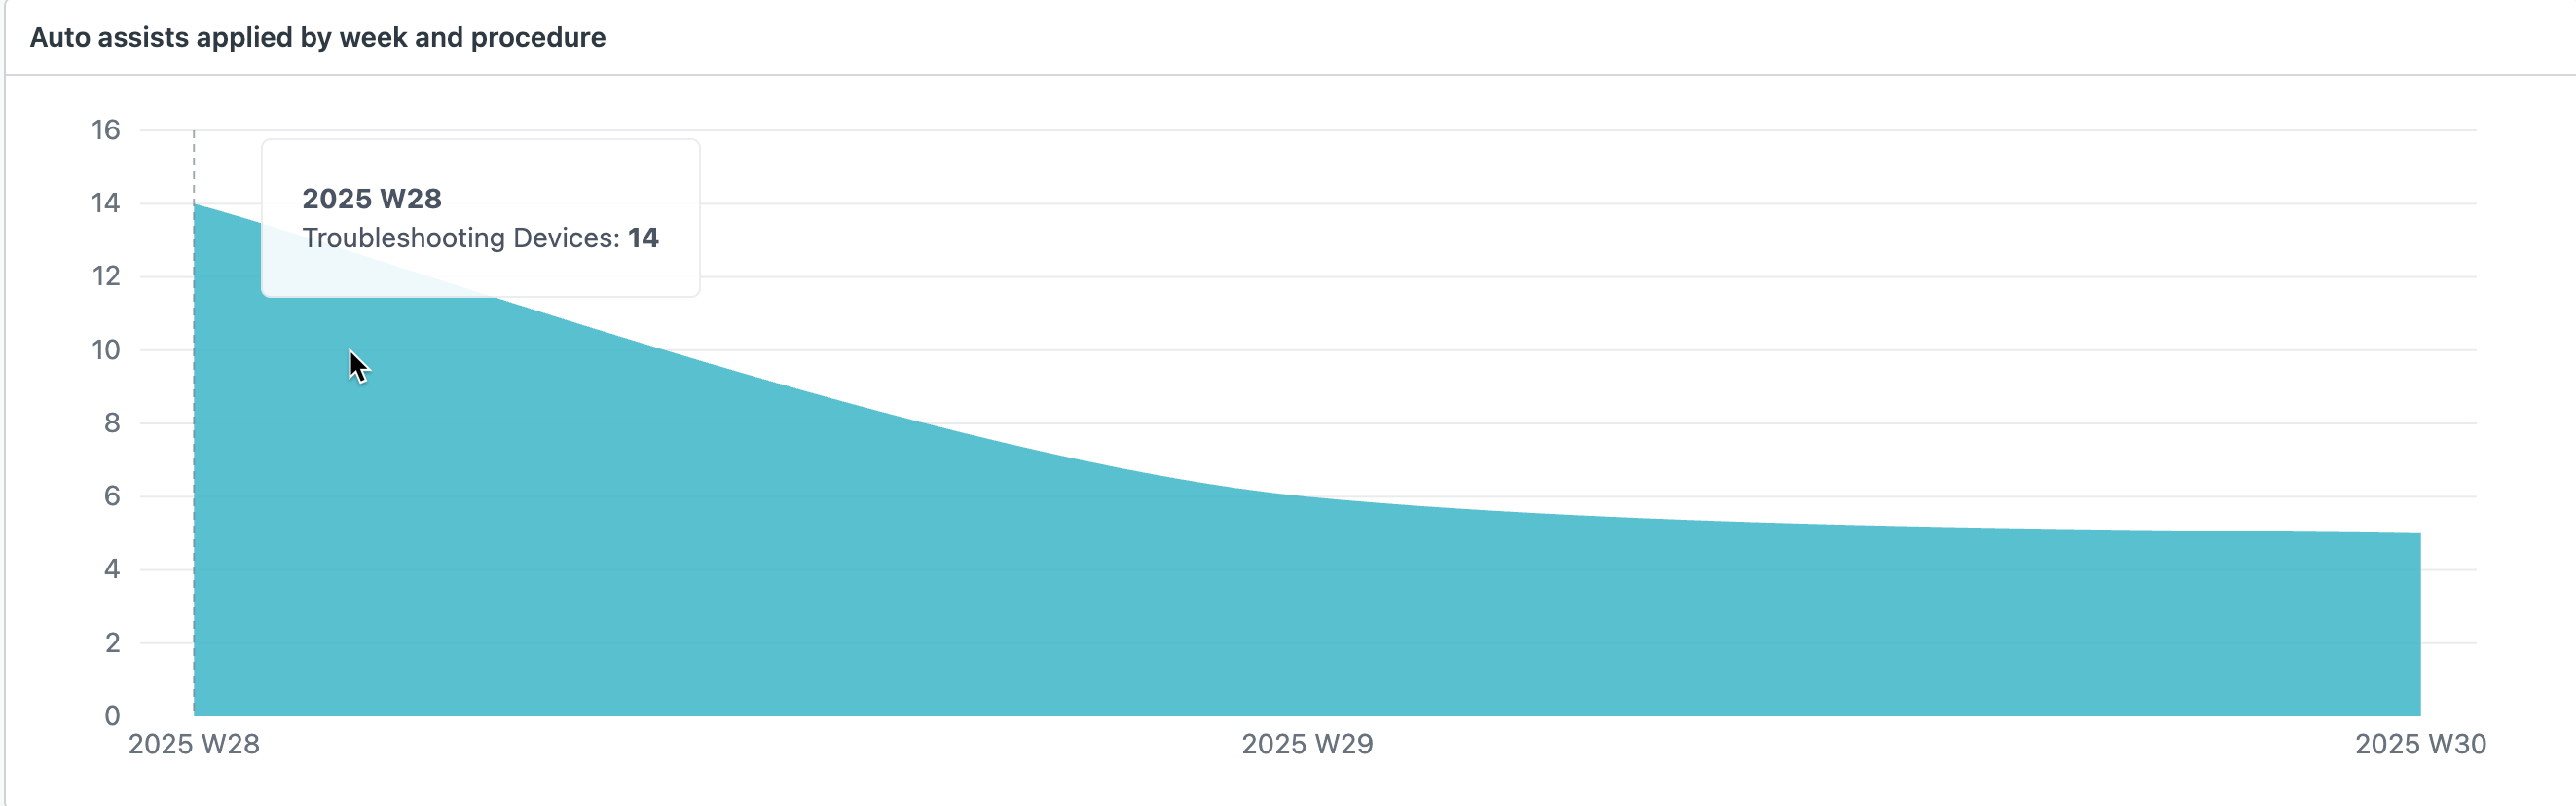
-
Auto assists applied by week and procedure: A graph showing
the number of auto assist procedures applied by auto assist by
week.
- Procedure adoption and performance: A list of procedures, with details about their performance.
- Auto assists usage by agent: A list of agents that shows their auto assist usage.
AI suggestions tab
The AI suggestions tab contains reports about agents' usage and acceptance of suggestions from AI features including merging suggestions, quick answers, similar tickets, suggested first replies, and suggested macros. You can filter the reports by time, AI suggestion type, ticket group, agent name, ticket brand, ticket form, and ticket channel.
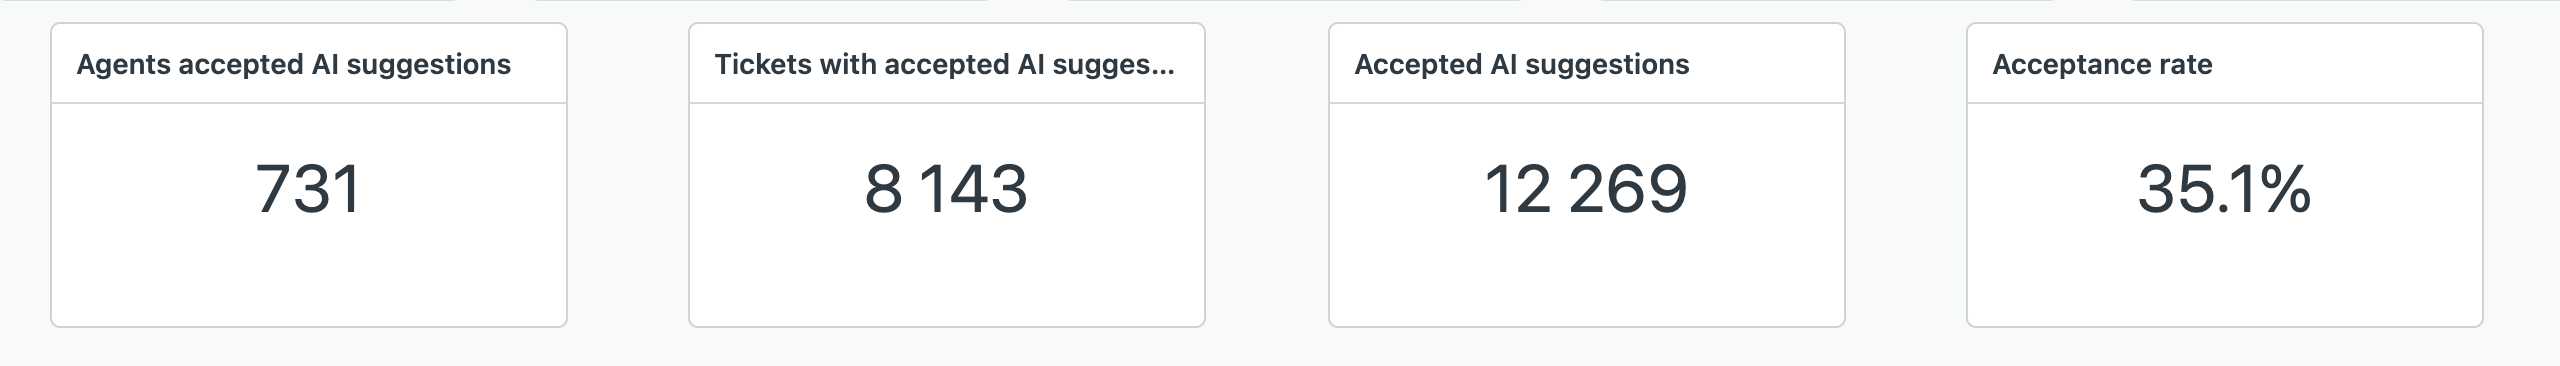
AI suggestions tab headline metrics
This tab displays the following headline metrics (KPIs):
- Agents accepted AI suggestions: The number of agents who accepted an AI suggestion at least once.
- Tickets with accepted AI suggestions: The number of tickets where an AI suggestion was accepted at least once.
- Accepted AI suggestions: The number of AI suggestions accepted by agents.
- Acceptance rate: The number of AI suggestions that were accepted, divided by the total number of AI suggestions shown.
To understand what's considered an accepted suggestion for each feature, see the AI - Copilot suggestion metrics.
AI suggestions tab reports
This tab displays the following reports:
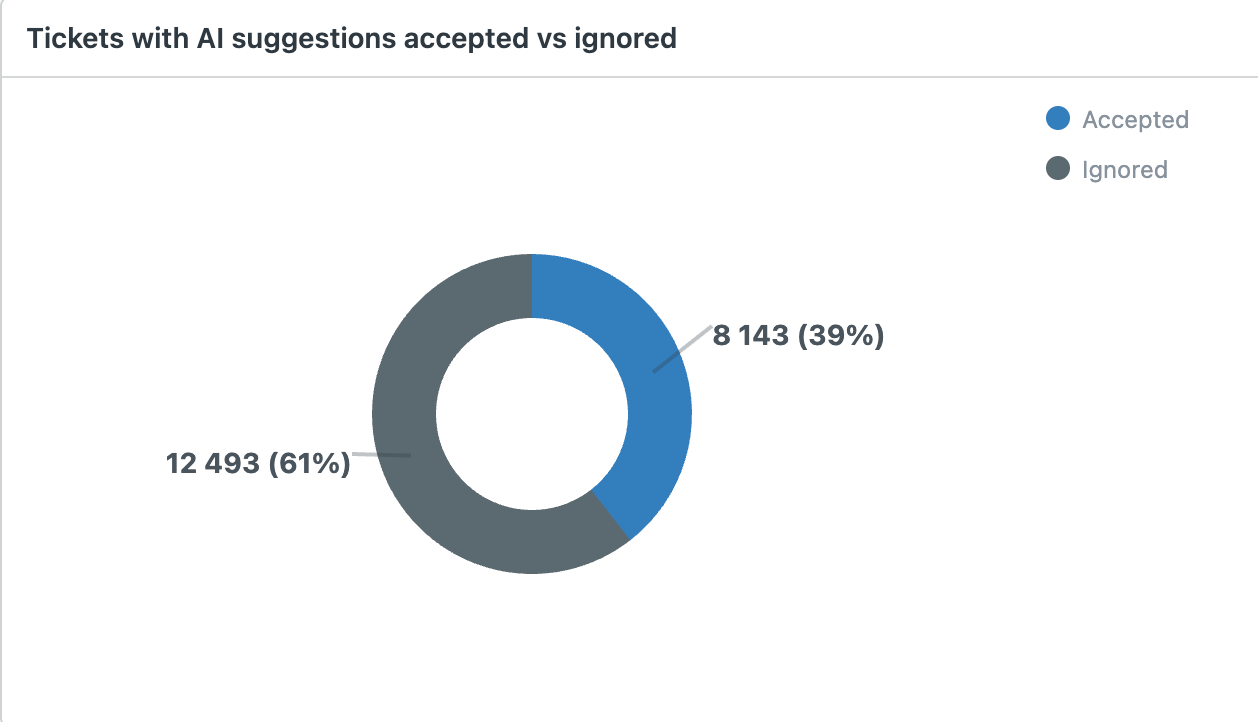
-
Tickets with AI suggestions accepted vs ignored: A pie chart
showing the number of AI suggestions accepted by agents and the number
of AI suggestions that were ignored by agents.
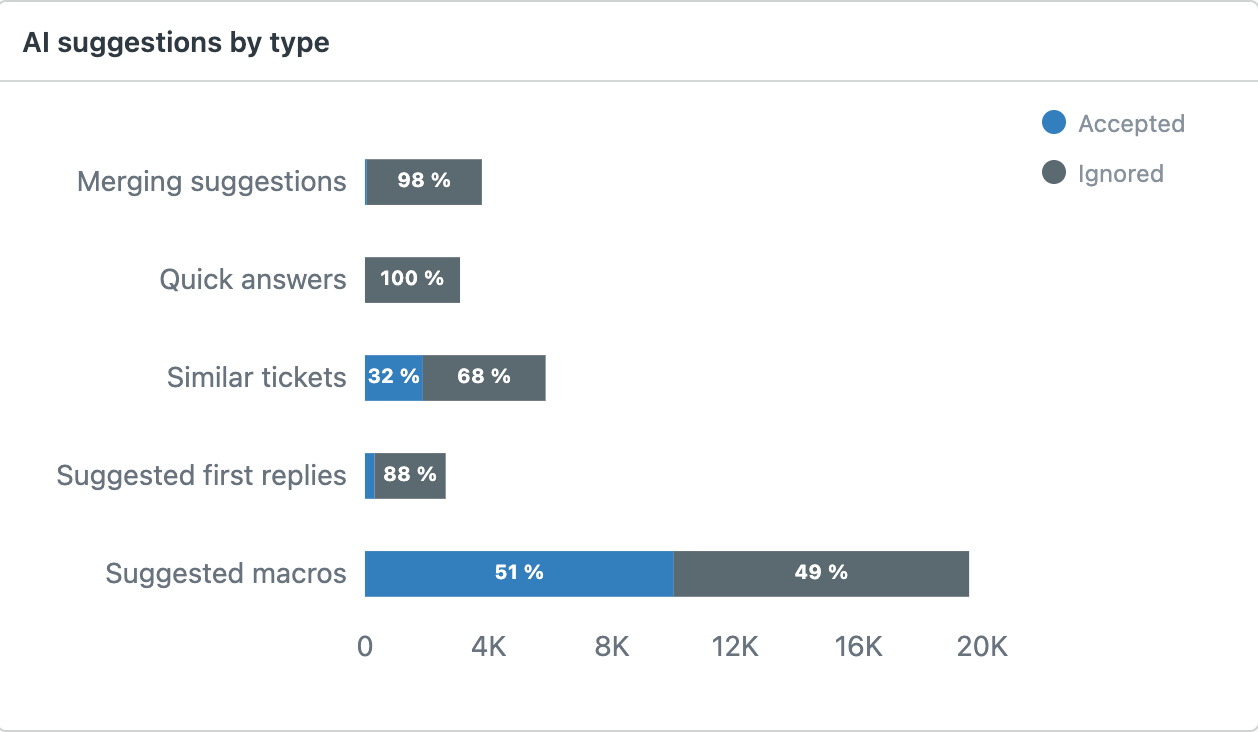
-
AI suggestions by type: A bar chart showing the number of
suggestions accepted or ignored by feature type.
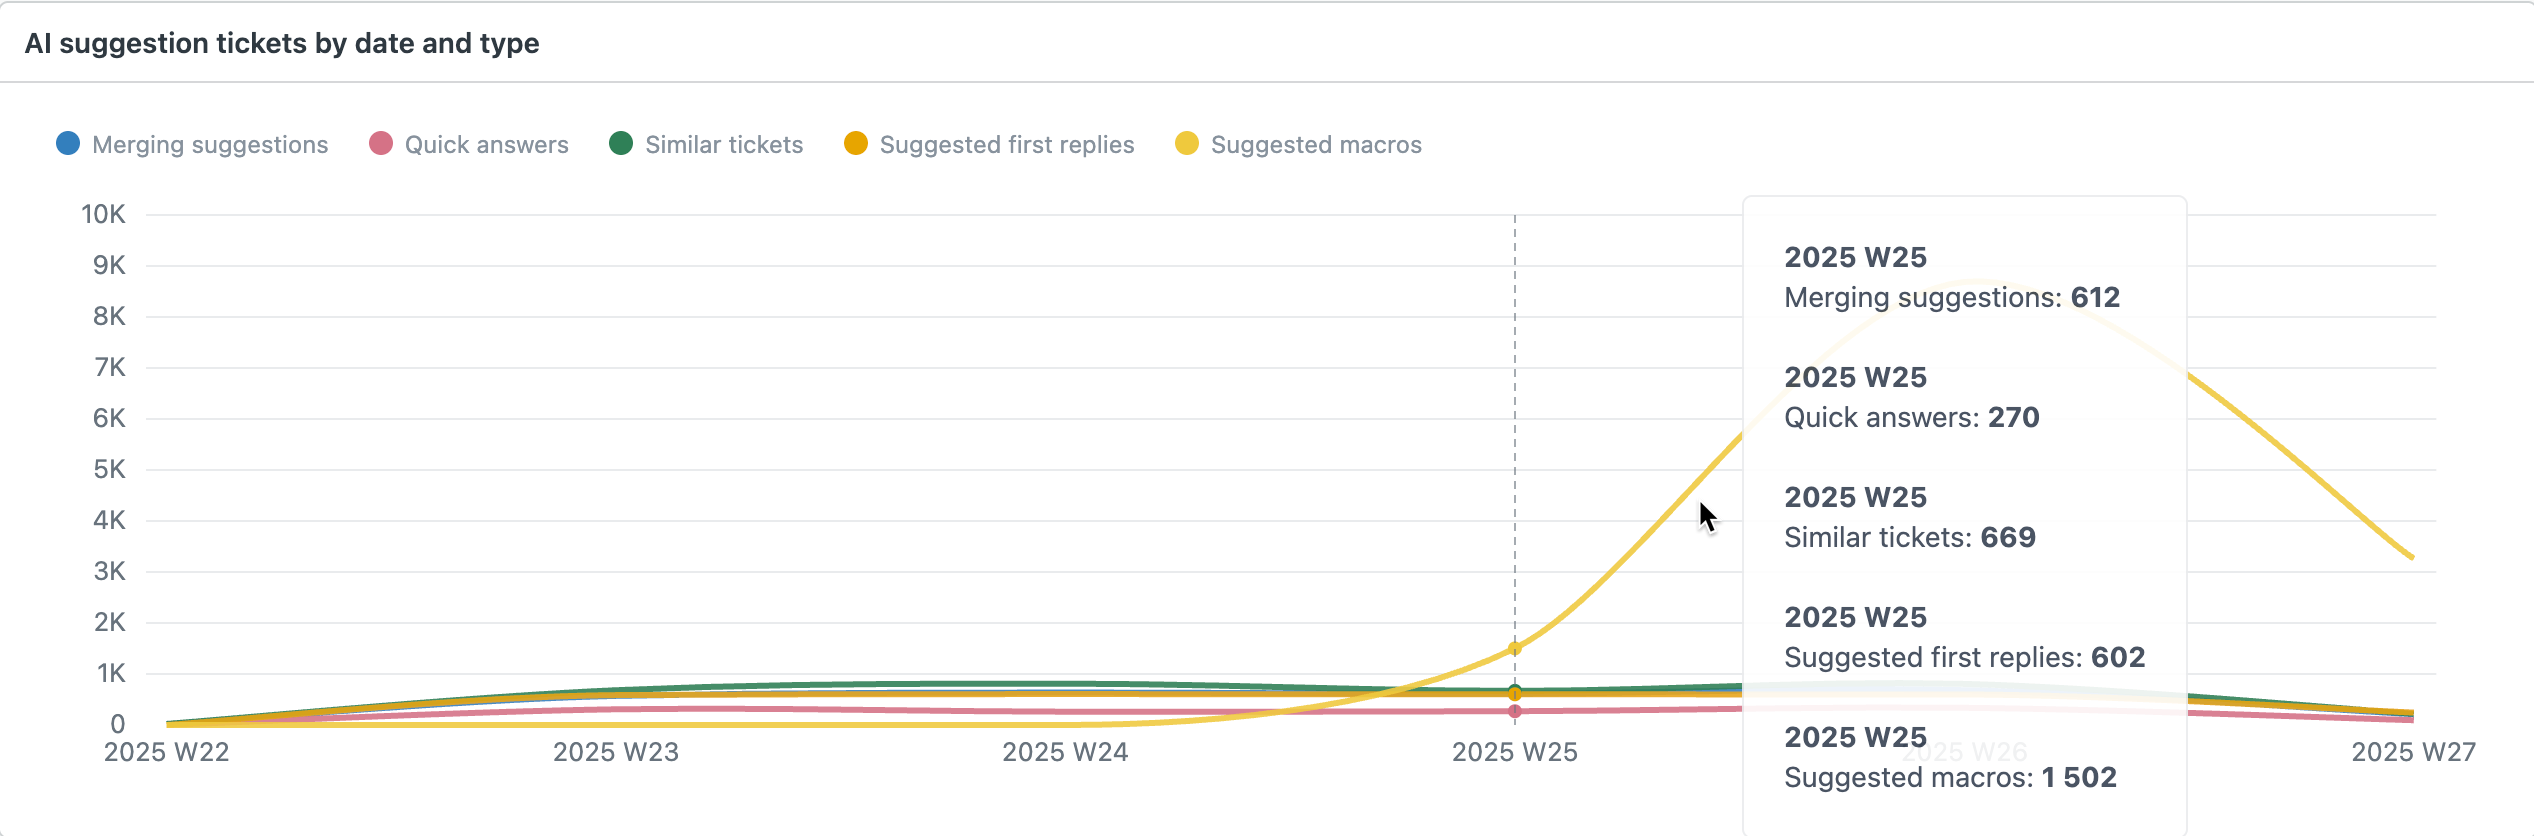
-
AI suggestions by date and type: A graph showing the number of
tickets with an AI suggestion shown at least once by date and feature
type.
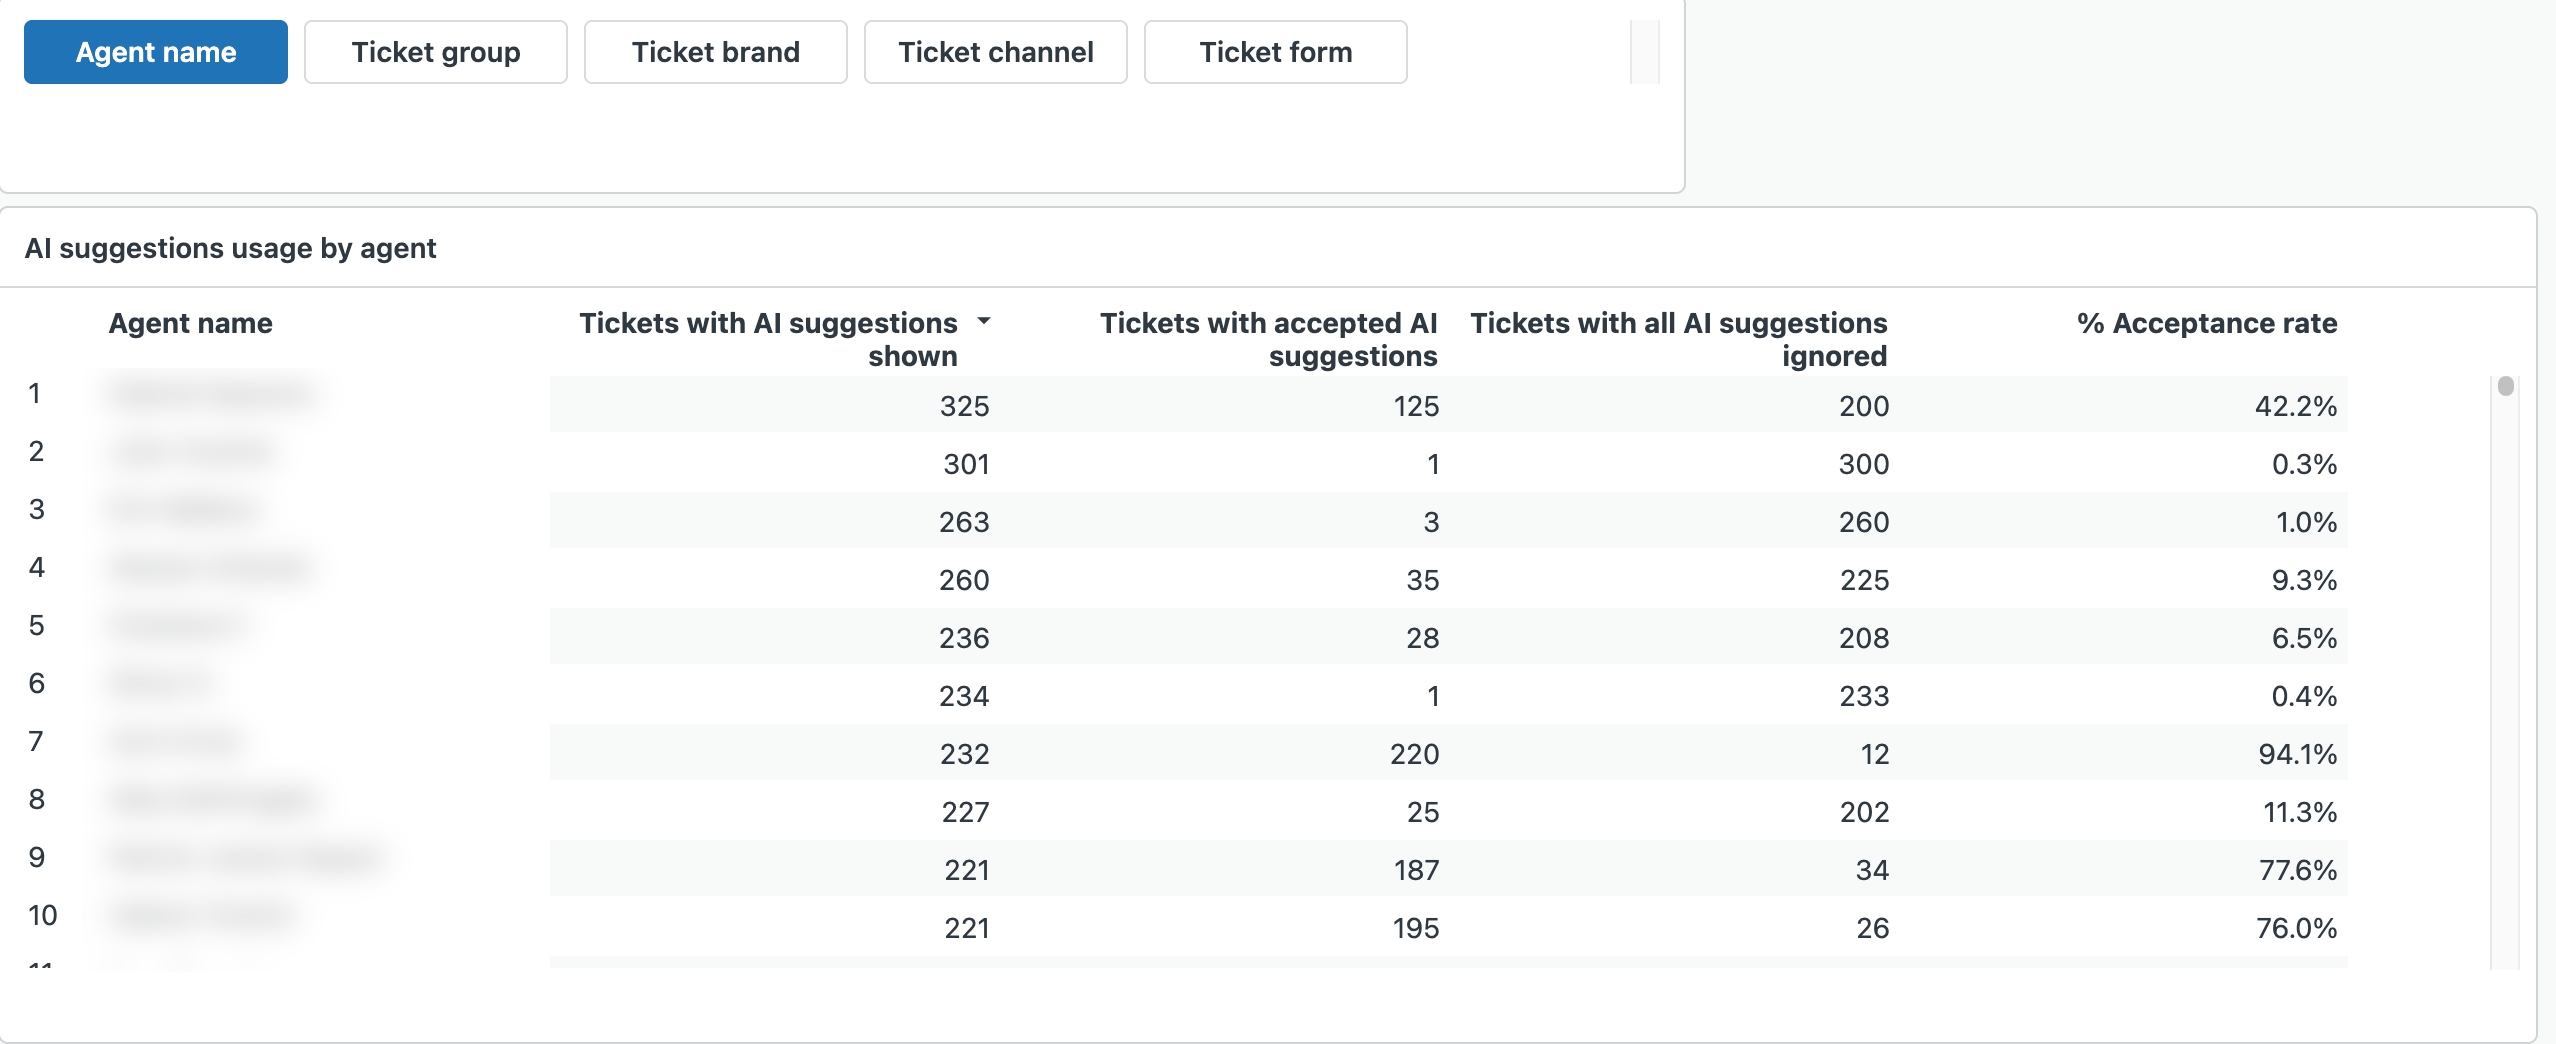
-
AI suggestions usage by agent: A list of agents that shows the
number of tickets an agent worked on with AI suggestions shown at least
once, with accepted AI suggestions, with AI suggestions not accepted,
and the agent's overall acceptance rate.
You can change the list to show suggestion usage by ticket group, brand, channel, or form.
AI agent tools tab
The AI agent tools tab contains reports about agents’ use of generative AI tools, including expand, summarize, custom prompt, make more friendly, make more formal, rewrite in your tone, and simplify. You can filter the reports by time, ticket group, agent name, AI usage type, ticket brand, ticket channel, and ticket assignee.
AI agent tools tab headline metrics
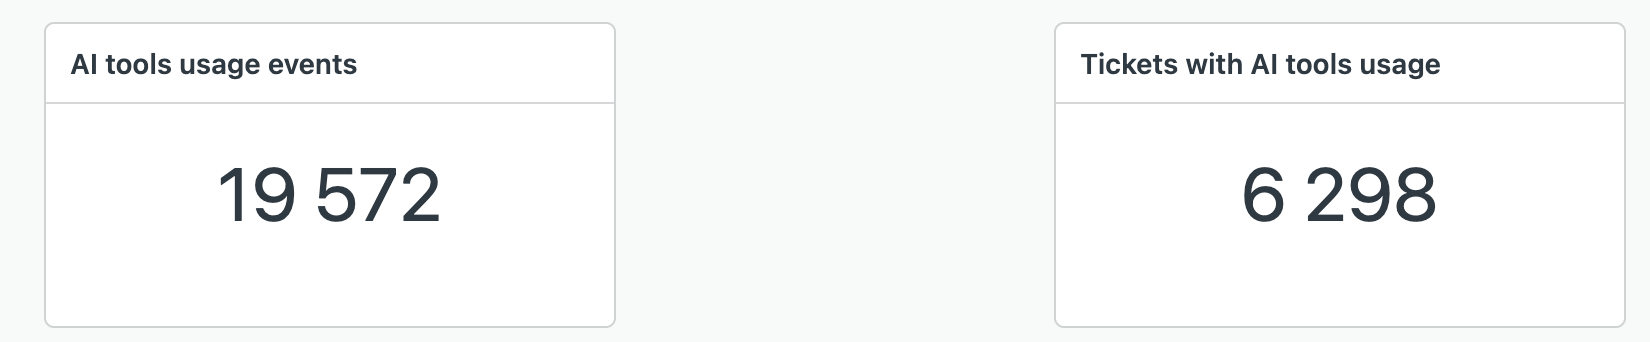
This tab displays the following headline metrics (KPIs):
- AI tools usage events: The number of times an AI tool was used by an agent.
- Tickets with AI tools usage: The number of tickets where an agent used AI tools.
AI agent tools tab reports
This tab displays the following reports:
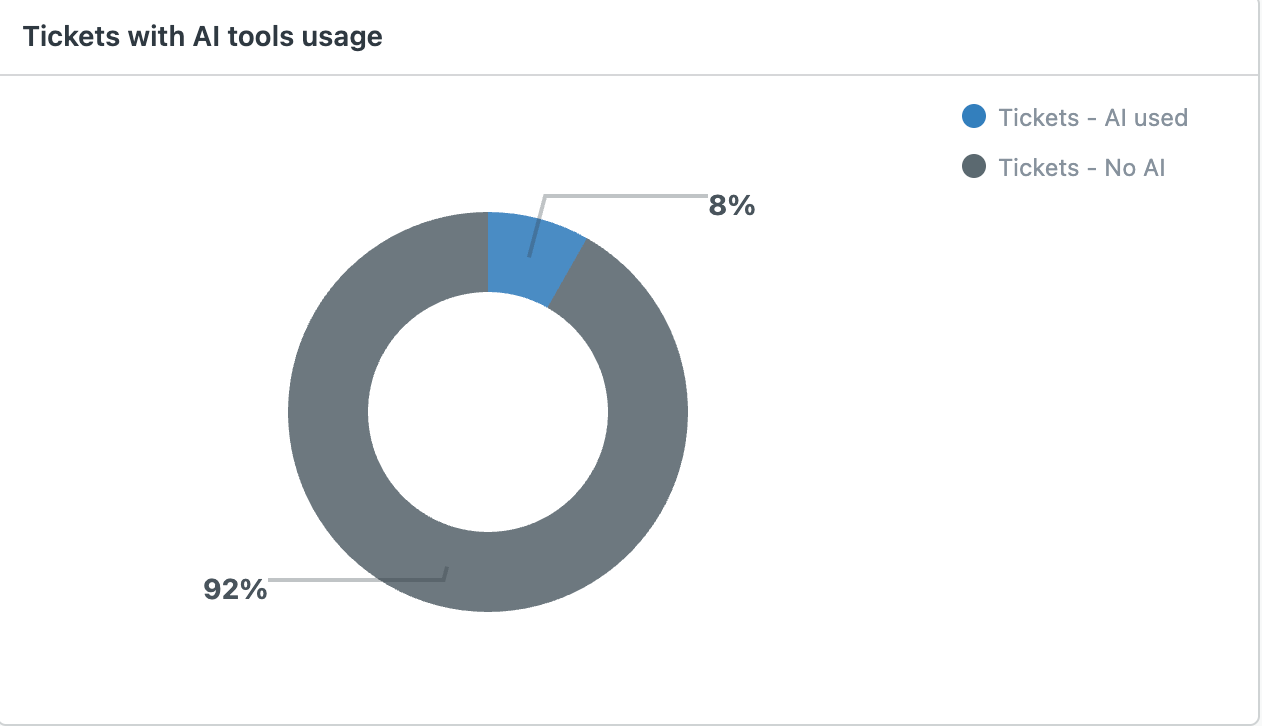
-
Tickets with AI tools usage: A pie chart showing the total number
of tickets split up by whether any of the AI tools were used. This
report is not filterable by agent name.
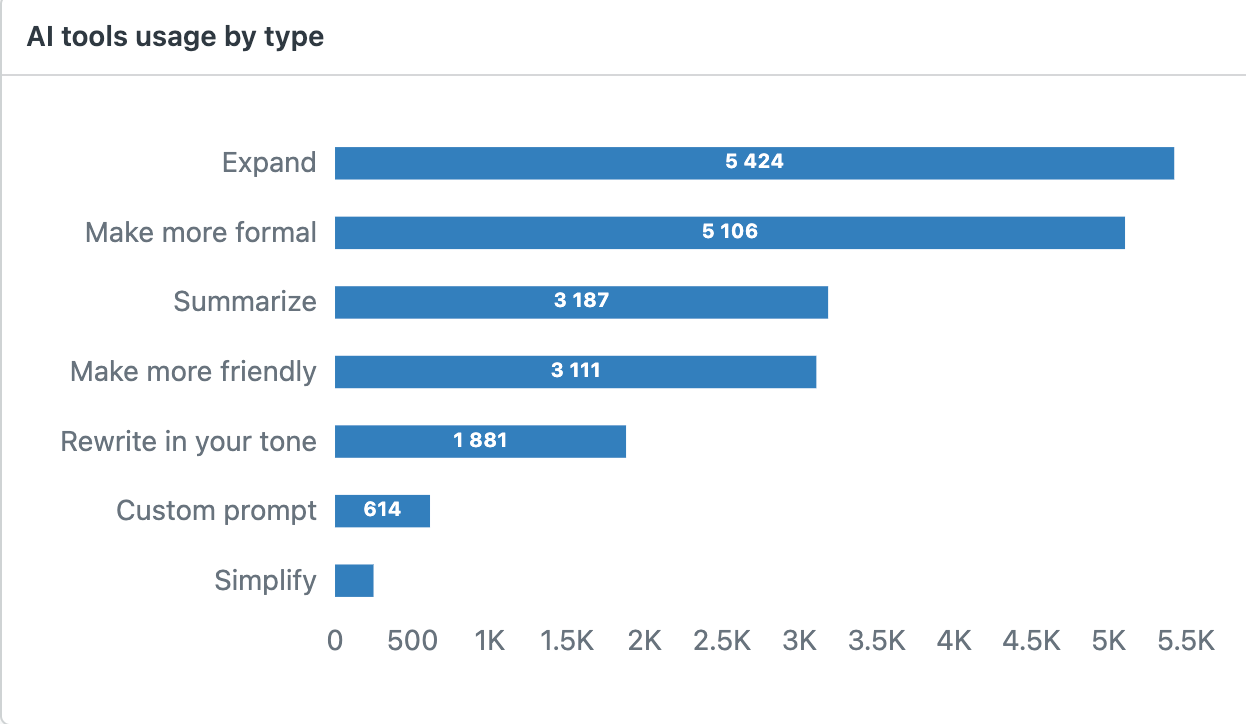
-
AI tools usage by type: A bar chart showing the number of times
an AI tool was used by feature type.
-
AI tools usage over time: A graph showing the number of times the
AI tools were used by feature type.

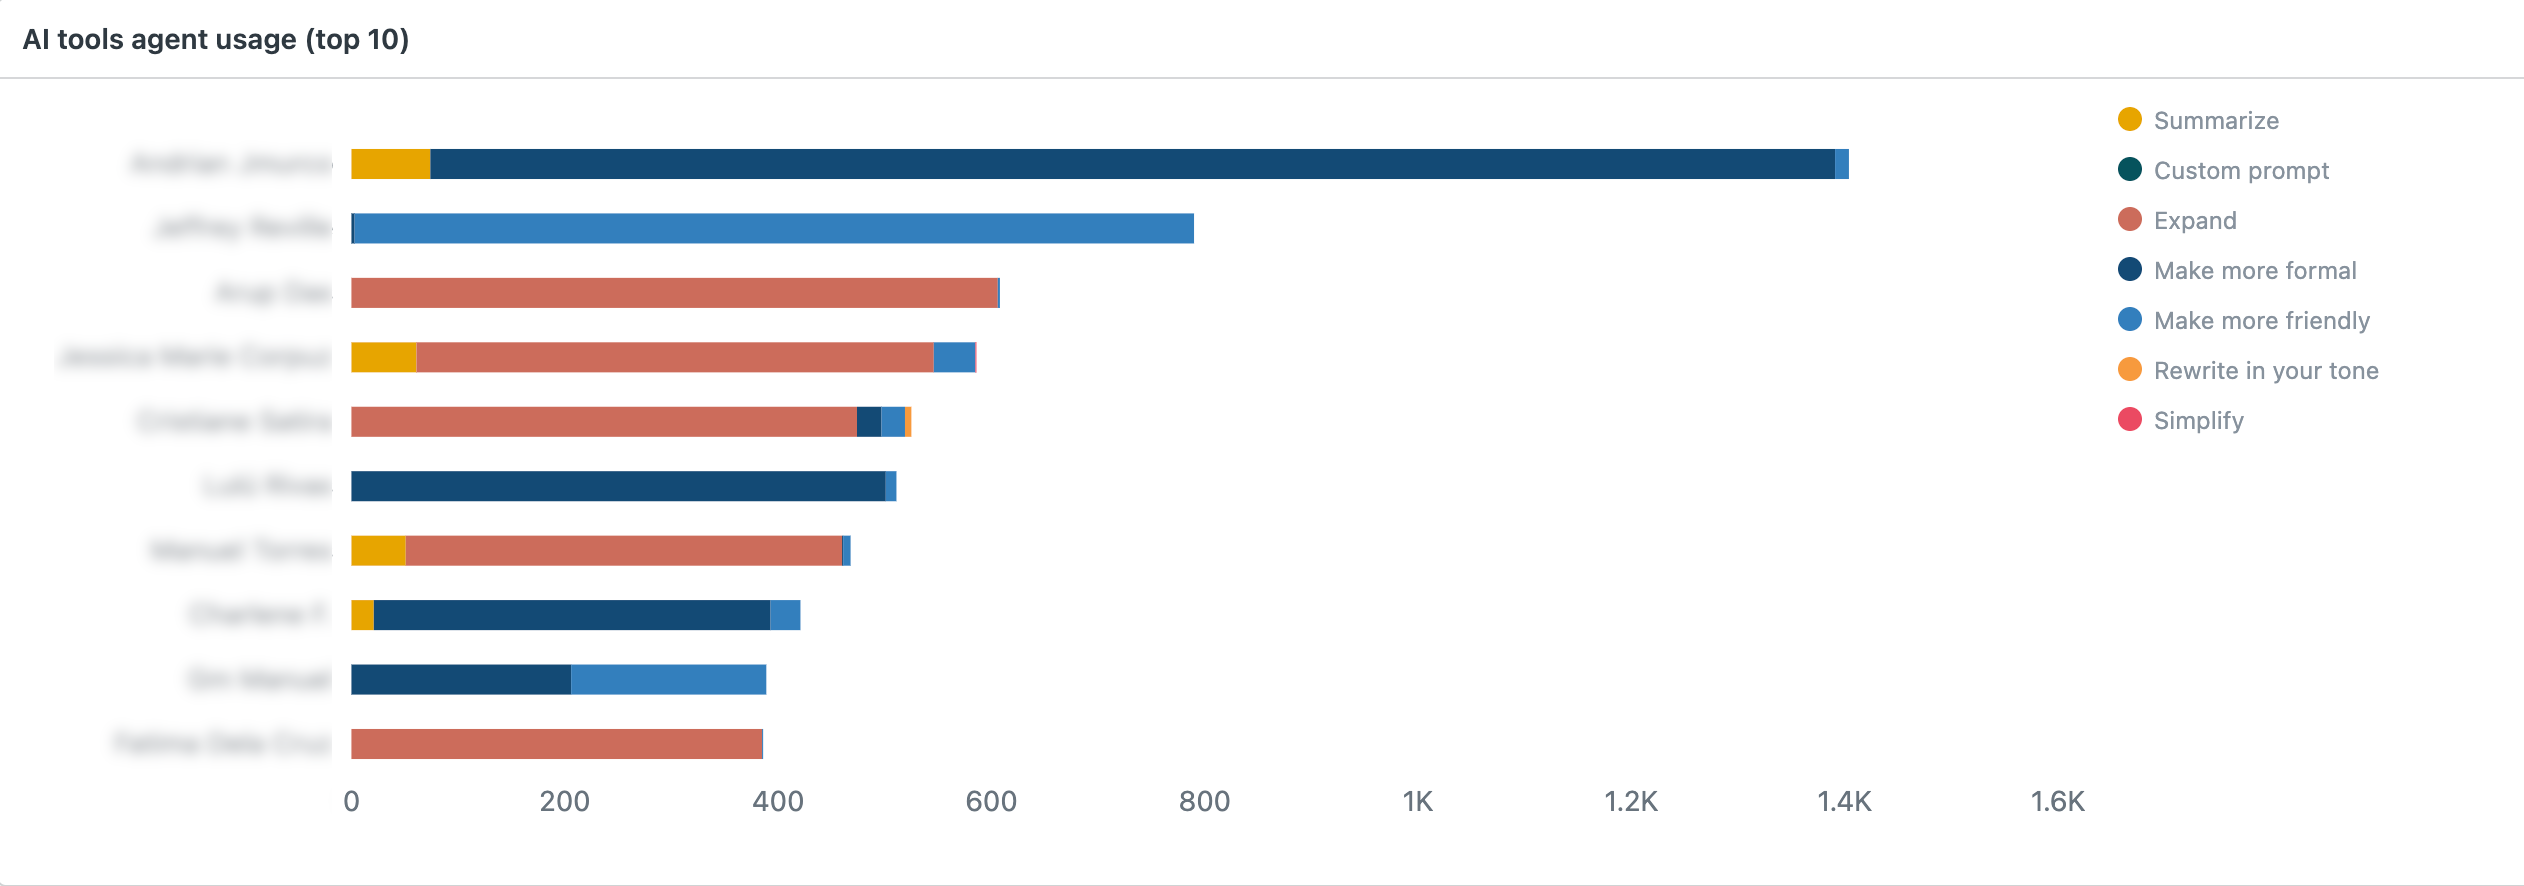
-
AI tools agent usage (top 10): A bar chart showing the top ten
agents who've used the AI tools.
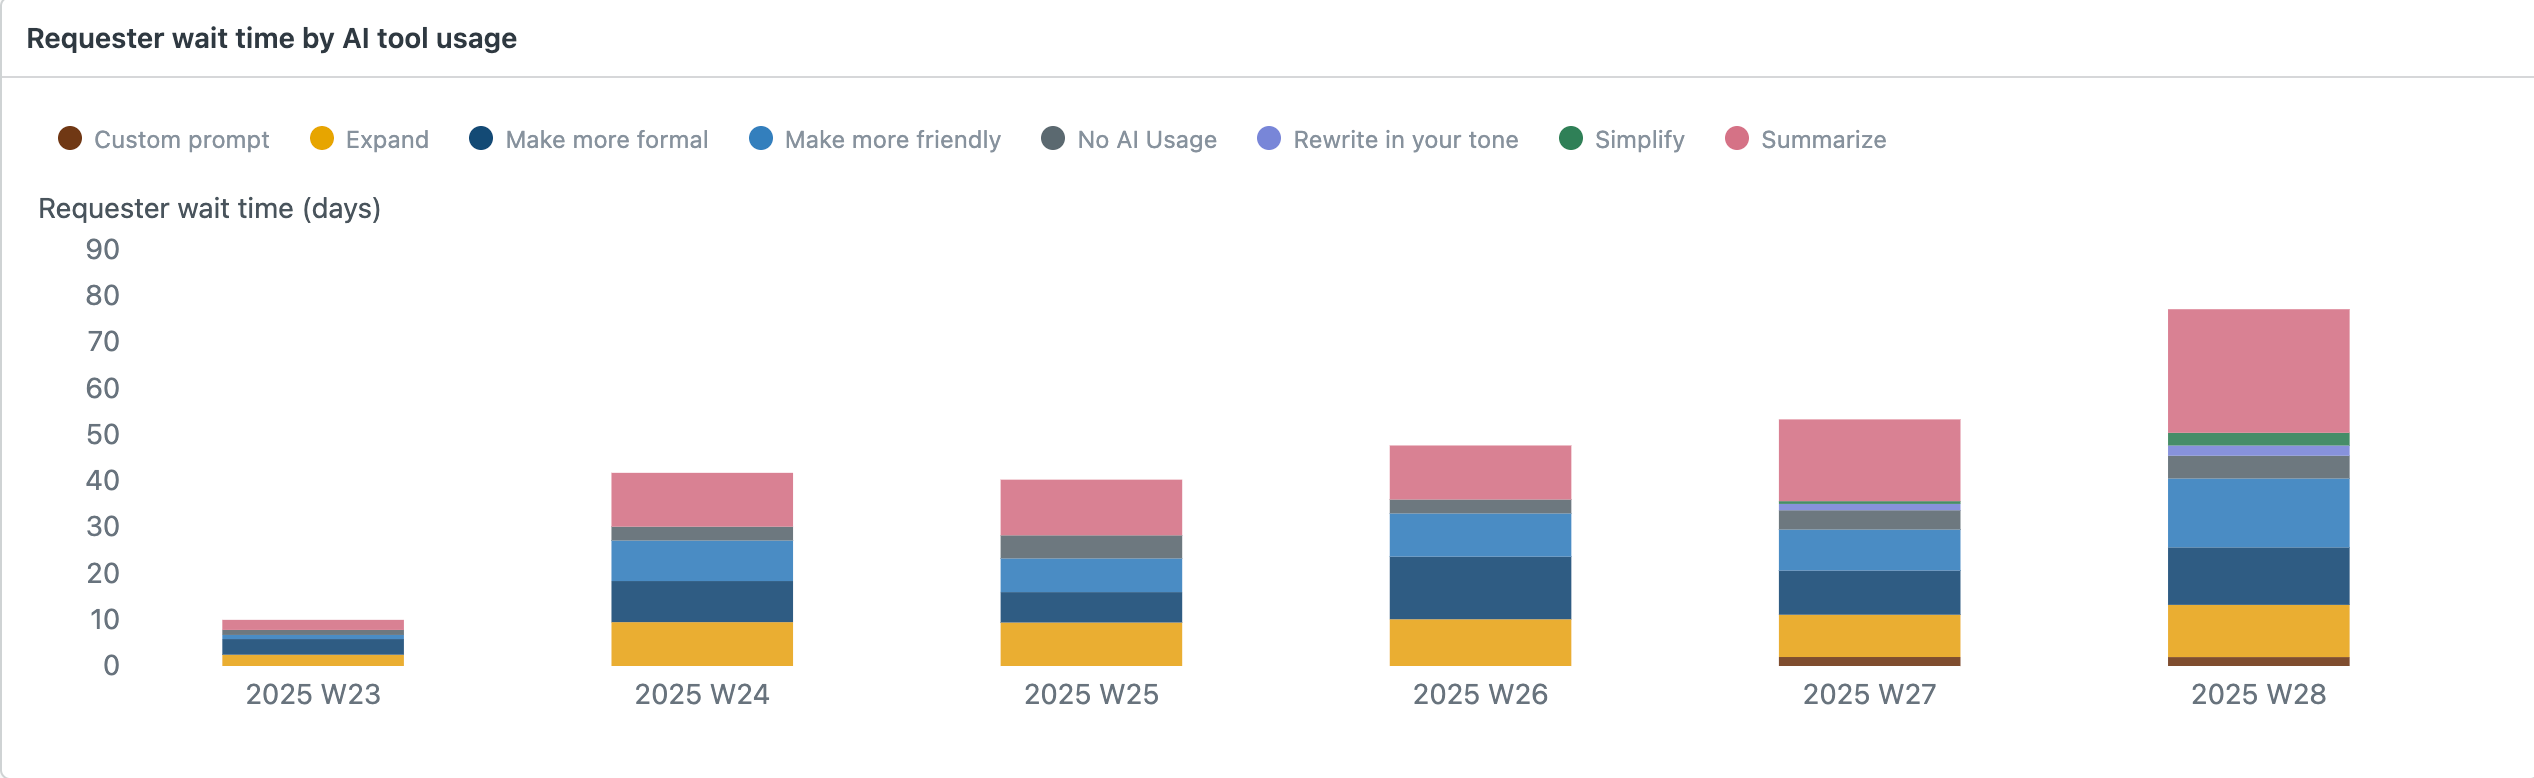
-
Requester wait time by AI tool usage: A bar graph showing the
average requester wait time by day for tickets where an AI tool was
used. This report is not filterable by agent name.
-
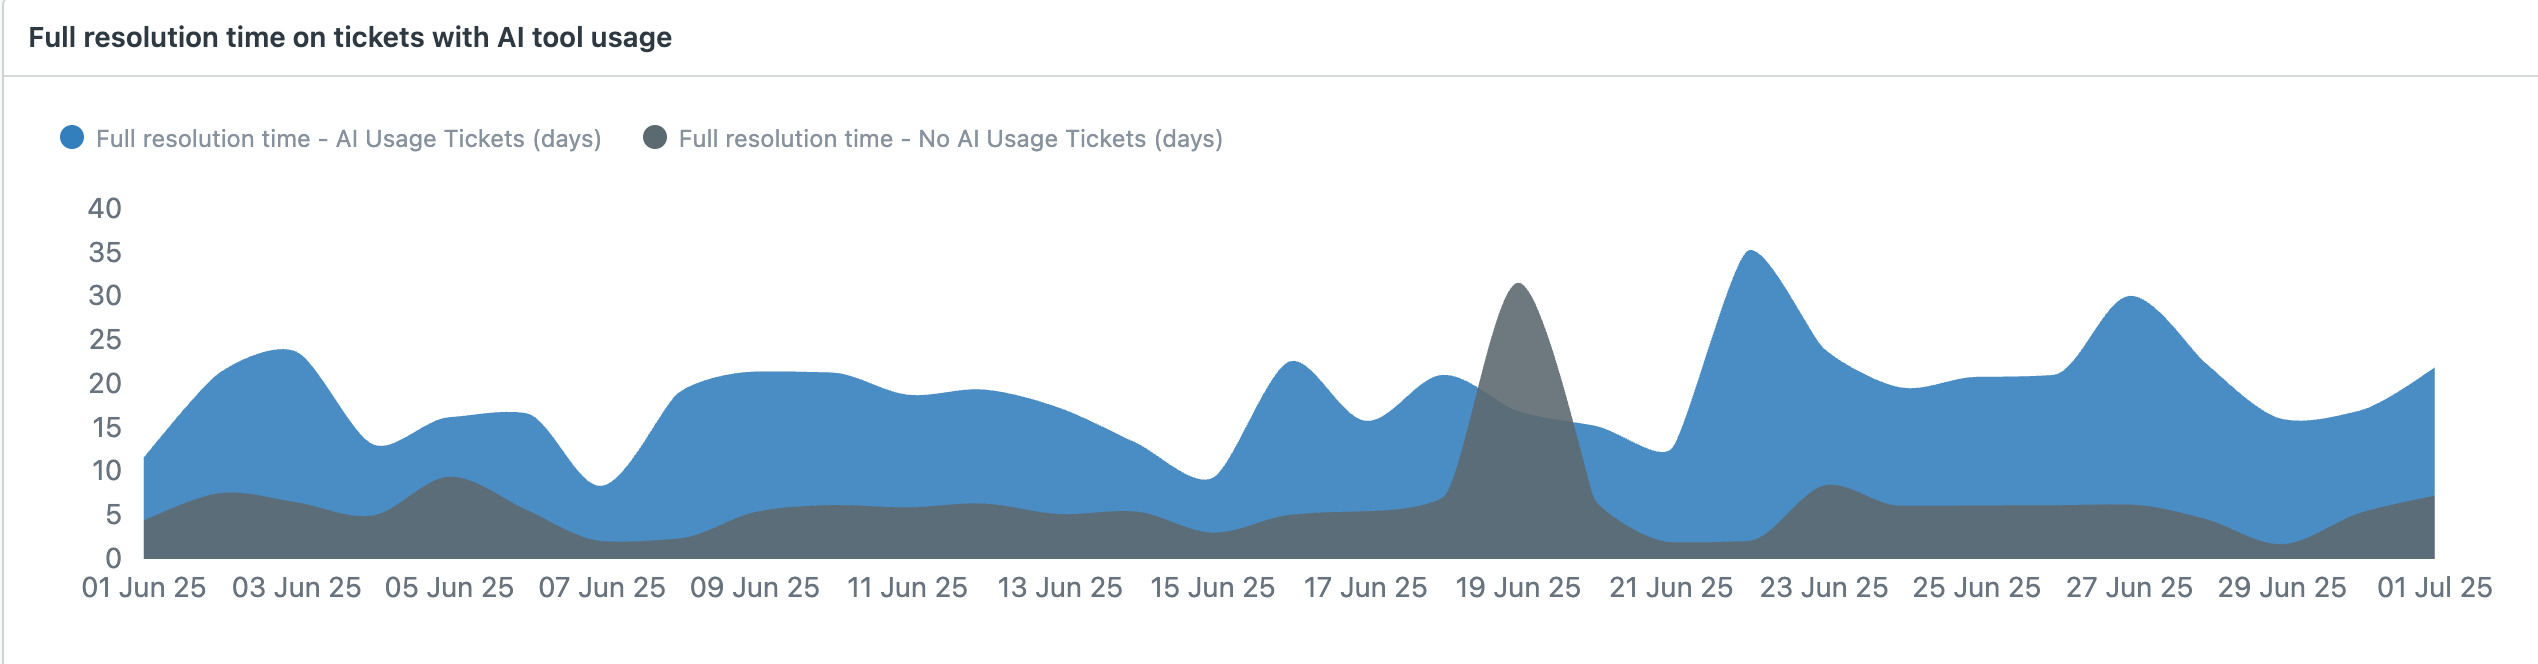
Full resolution time on tickets with AI tool usage: An area graph
showing the average full resolution time by day for all tickets, split
out by tickets where no AI tool was used (black) and tickets where an AI
tool was used (blue). This report is not filterable by agent
name.