In AI agents - Advanced, the Reporting dashboard provides a comprehensive, at-a-glance view of your organization’s overall advanced AI agent performance.
This article contains the following topics:
Accessing the dashboard
The dashboard is available under Reporting in the left sidebar.
To access the dashboard
-
In AI agents - Advanced, click
Reporting in the sidebar.
About the reports
The Reporting dashboard contains the following tabs:
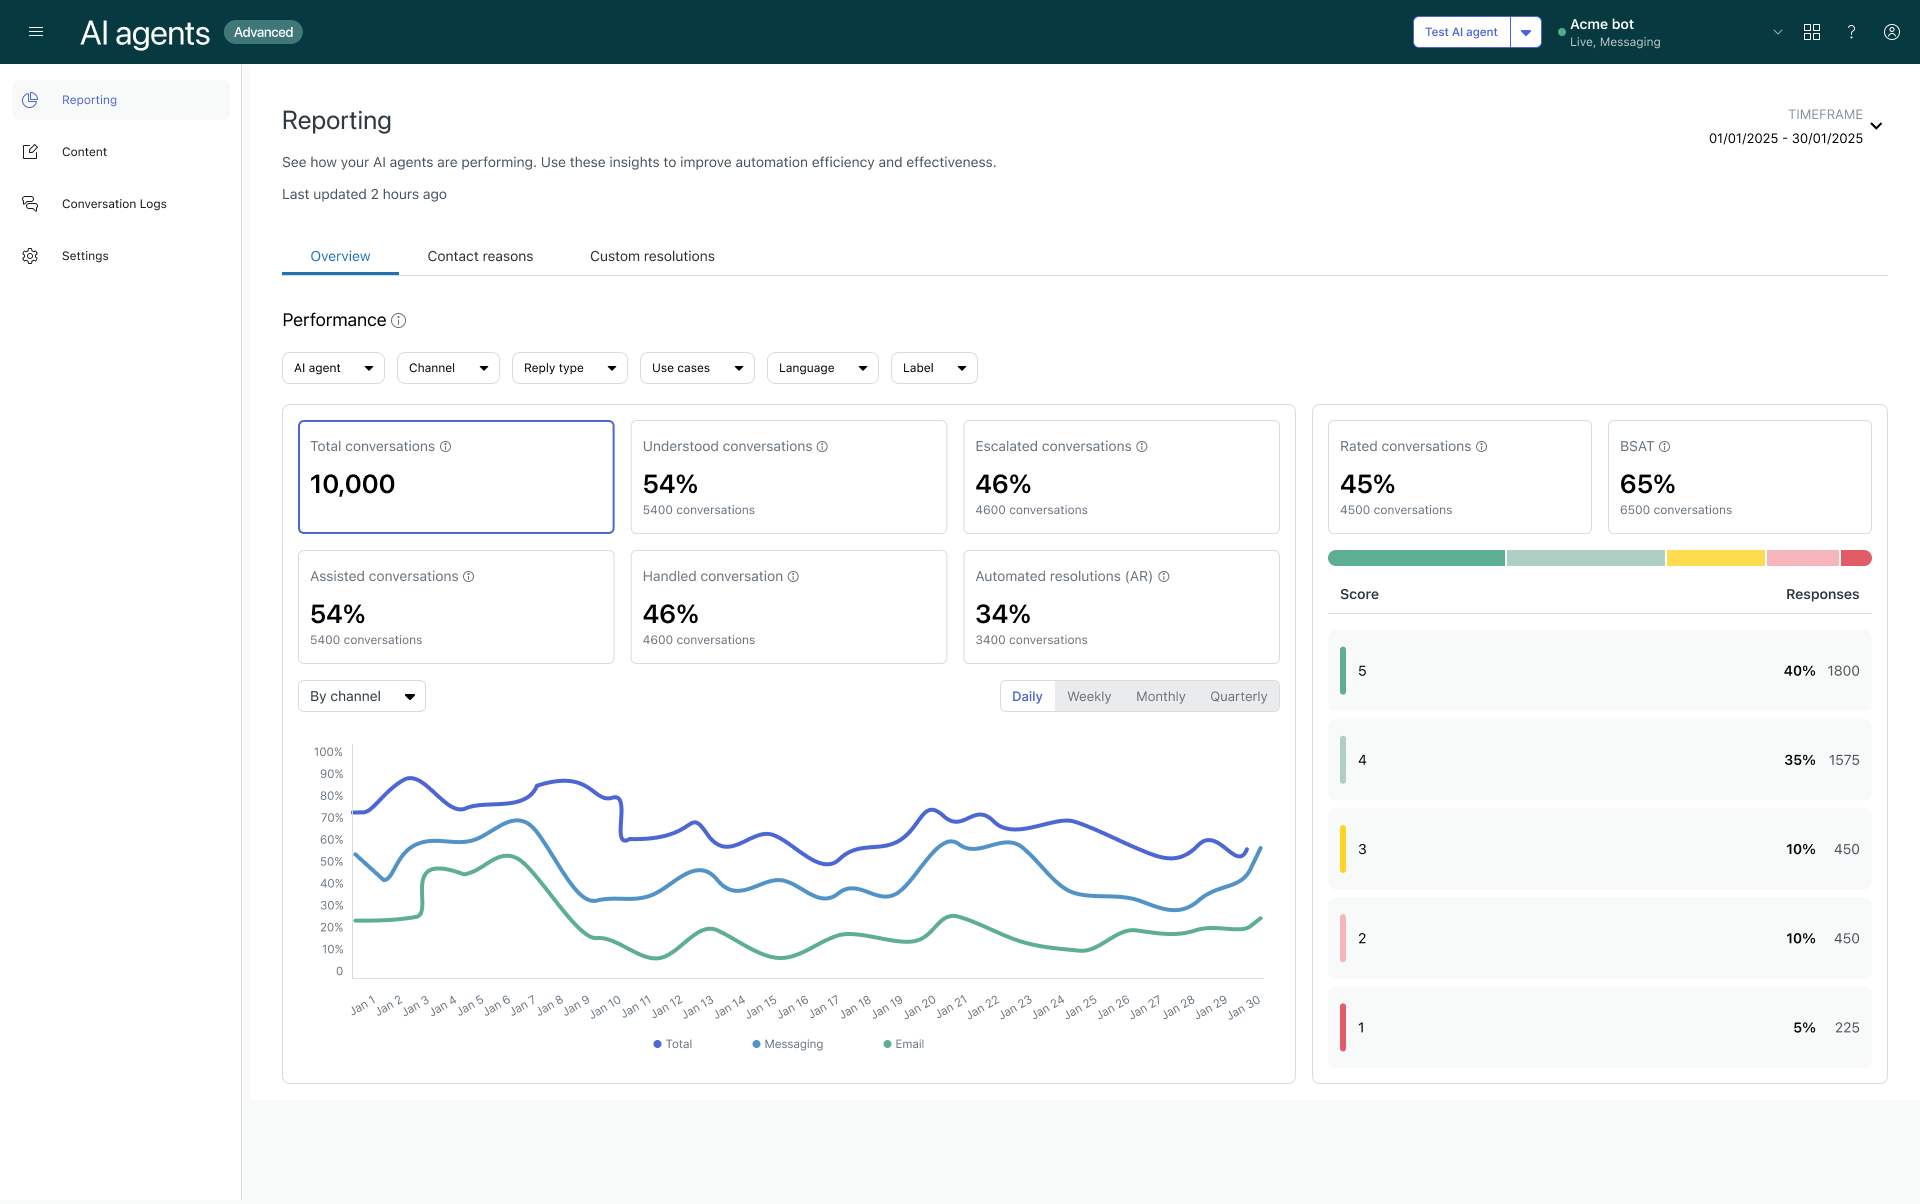
Overview tab
The Overview tab shows key metrics about volume, overall AI agent performance, and BSAT scores. For the volume and performance metrics, results are also graphed over time and you can change the report’s view to group the results by AI agent, channel, or language.
You can filter the reports on this tab by AI agent, Channel, Reply type, Use case, Language, and Label.
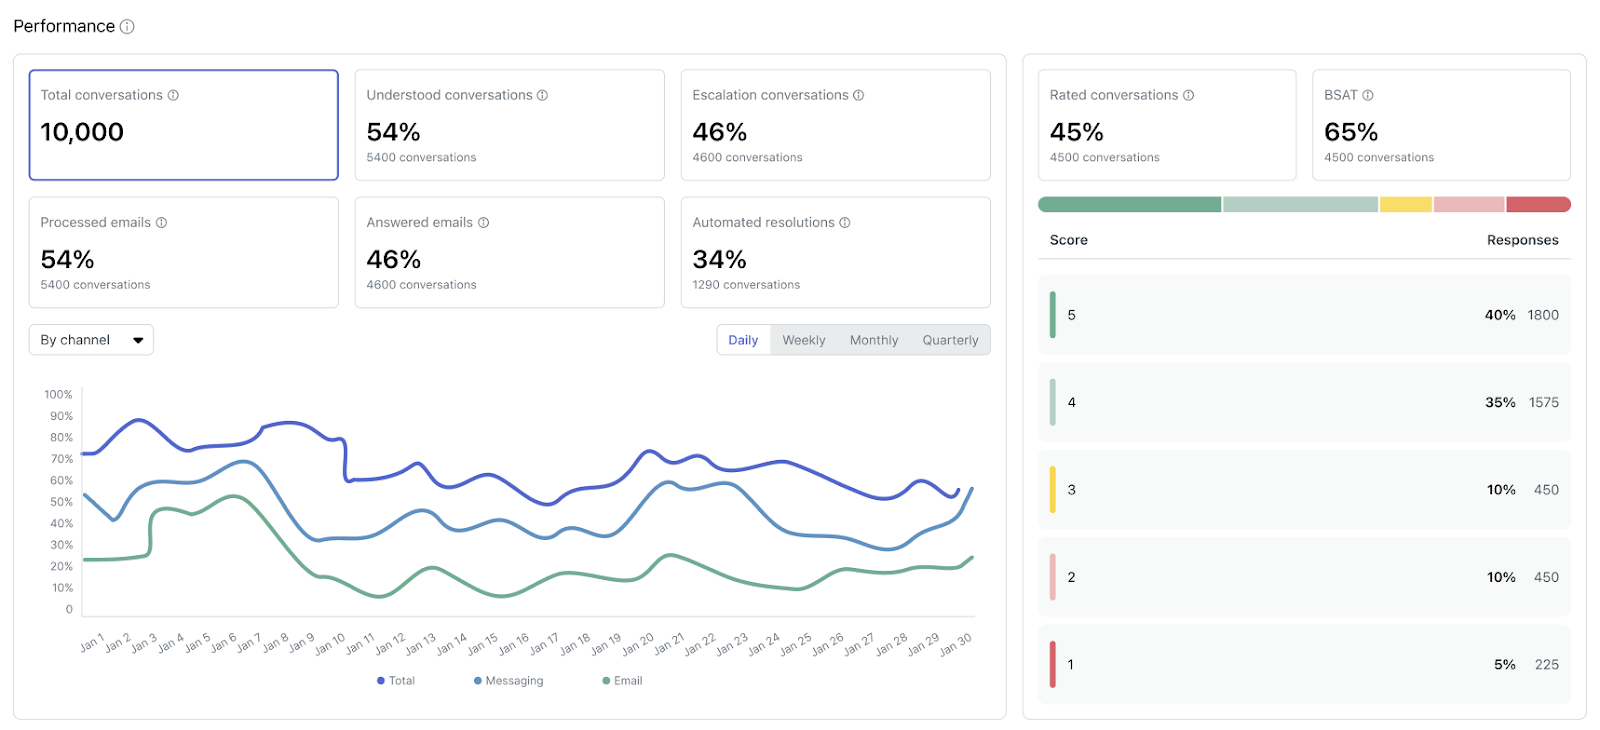
Performance
The left side of the Performance section shows the following metrics:
- Total conversations: The number of conversations handled by your AI agents.
-
Understood conversations: The percentage and number of
conversations where an answer was provided from a knowledge source or
conversations that were matched to a use case.Note: For AI agents with agentic AI, this metric excludes small talk and conversations escalated through the Escalation system reply. Because the Escalation system reply is excluded, this metric might be lower compared to other AI agents because manually created use cases for escalations are no longer triggered.
-
Escalated conversations: The percentage and number of
conversations that were escalated from an AI agent to a human
agent.Note: Escalation rate isn’t necessarily a direct inversion of Automated resolutions. One minus the escalation rate is the deflection rate, from which a subset of conversations are evaluated as potential automated resolutions.
-
Assisted conversations: Conversations where an AI agent took part
but didn’t necessarily resolve the request. This includes:
- Messaging conversations that weren’t escalated.
- Emails where a use case was recognized, actions were taken, but no reply was sent.
-
Handled conversations: Conversations fully handled by an AI
agent. This includes:
- Messaging conversations with a recognized use case and no escalation attempts.
- Emails where a reply was sent.
-
Automated resolutions: The percentage and number of automated
resolutions. For details on how these are calculated, see Automated resolutions in advanced AI
agents.Note: If you don’t have the Activate LLM setting enabled, this metric doesn’t appear.

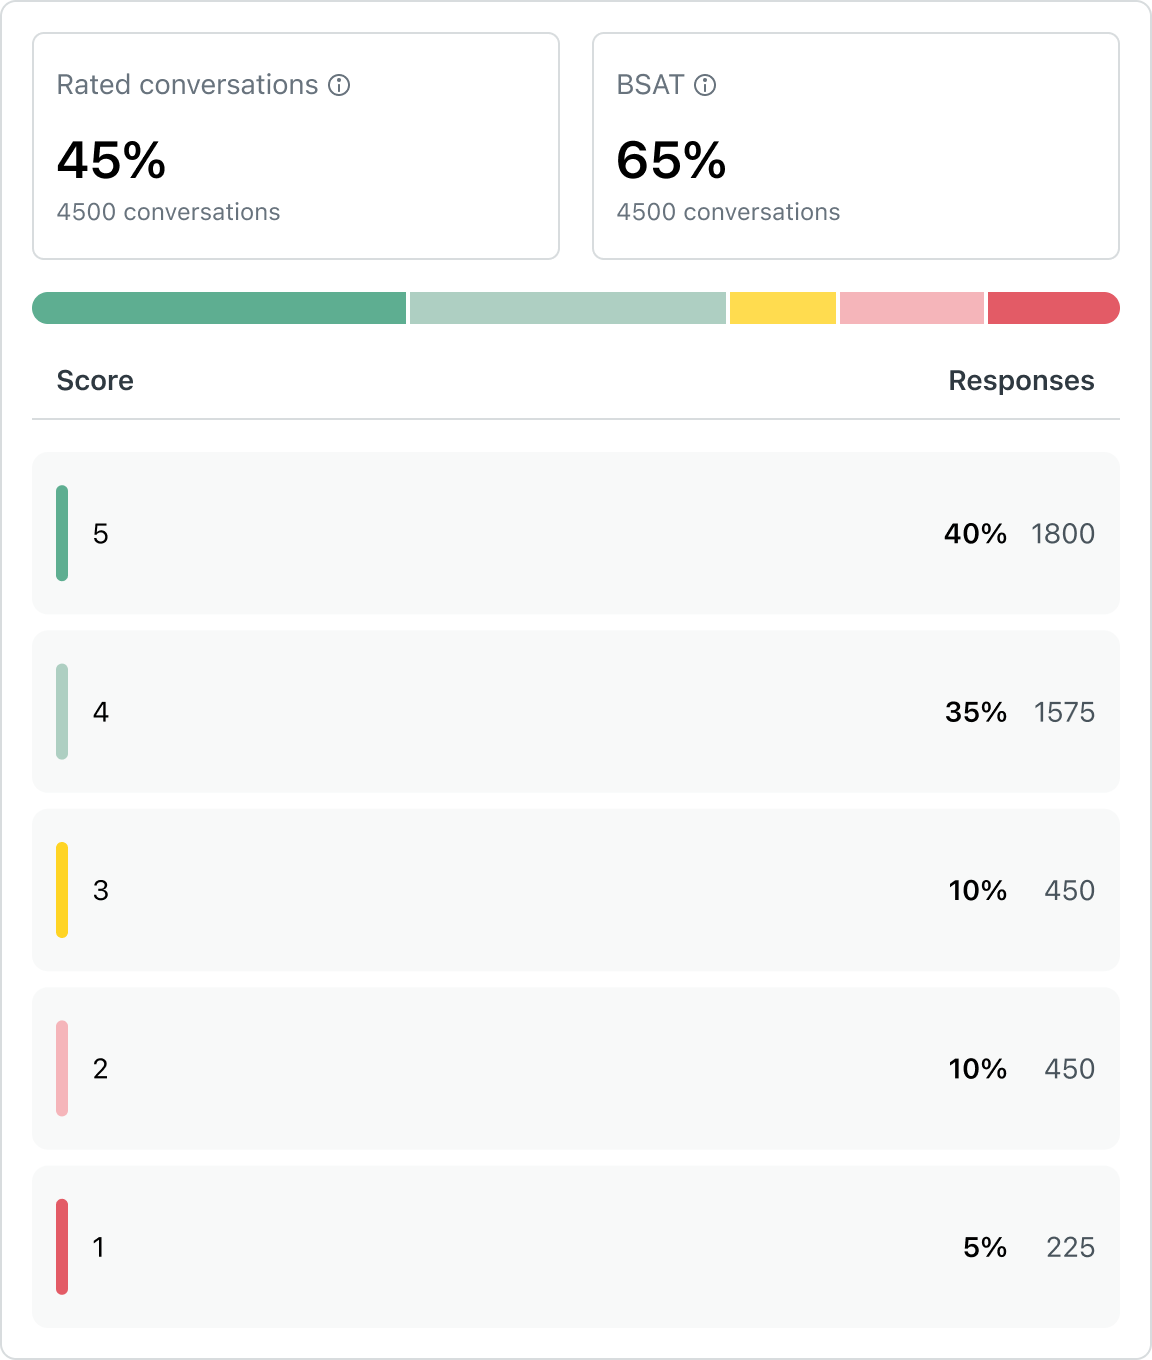
The right side of the AI agent workload section shows the following BSAT metrics:
- Ratings requested: The percentage and number of conversations where customers were requested to provide a satisfaction score.
- Ratings given: The percentage and number of conversations where customers provided a response for BSAT, divided by the number of conversations where feedback was requested.
- BSAT score: The sum of the number of responses with a 4-5 score provided, divided by the total number of responses.
- The colored bar indicates the proportion of each feedback response from 5 to 1, shown in shades of green, yellow, and red.
- Below the bar, each rating is broken out with its respective percentage
and number of responses relative to the total responses.
Contact reasons tab
The Contact reasons tab shows key metrics about the performance of use cases and knowledge sources across your AI agents and channels.
From this tab, you can also jump to the use case suggestions report to quickly create new use cases that aren’t currently covered.
- In the reporting dashboard, use cases are included when they’ve been detected during a conversation or else triggered by a linked reply.
- In the conversation logs, use cases are included only when they’ve been detected during a conversation. Use cases triggered by a linked reply aren’t included.
This tab contains the following reports:
Use case performance
The Use case performance report shows a table of all existing use cases and their respective performance across your AI agents and channels. You can filter this report by AI agent, Channel, Reply type, Use case, Language, and Label.
This table includes the following columns:
- Use case: The name of the dialogue or procedure.
- AI agent: The AI agent that the dialogue or procedure was created for.
- Channel: The channel that the AI agent is configured for. Possible values include Messaging and Email.
- Reply method: How the reply was triggered. Possible values include Dialogues and Procedures.
- Total conversations: The number of conversations where the use case was detected.
- Automated resolutions: The number of automated resolutions across conversations where the use case was detected.
- Custom resolutions: (Appears only for customers who deployed an AI agent on at least one messaging channel before September 8, 2025.) The percentage of conversations where a custom resolution was applied. For more information, see Custom resolutions tab.
- Escalated conversations: The escalation rate across conversations where the use case was detected.
-
BSAT: The BSAT score across conversations where the use case was
detected.
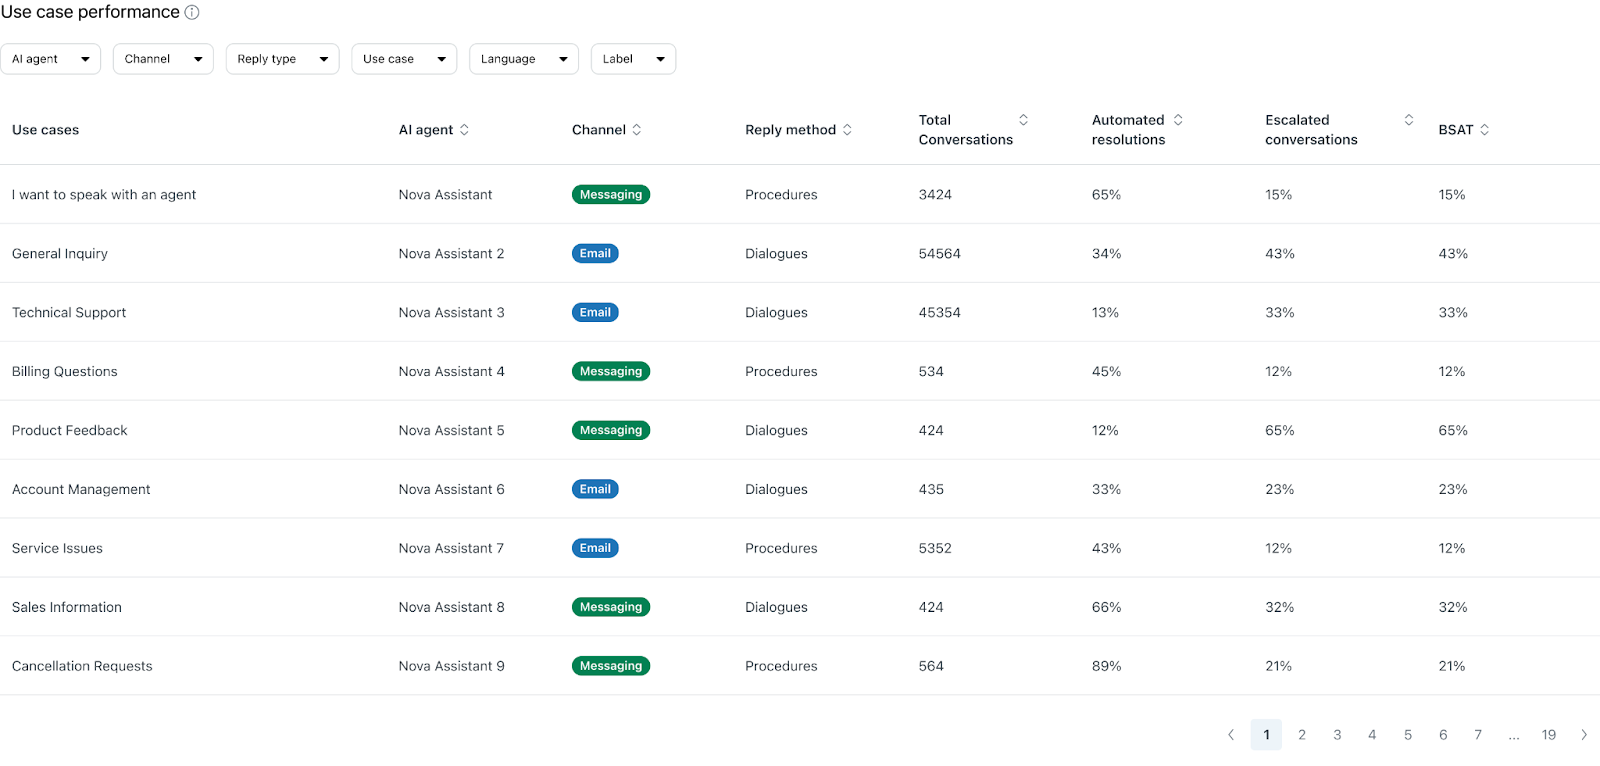
From this table, you can click a use case to view a detailed report about its performance over time. This information helps you understand how a specific use case has contributed to your organization’s overall automation success.
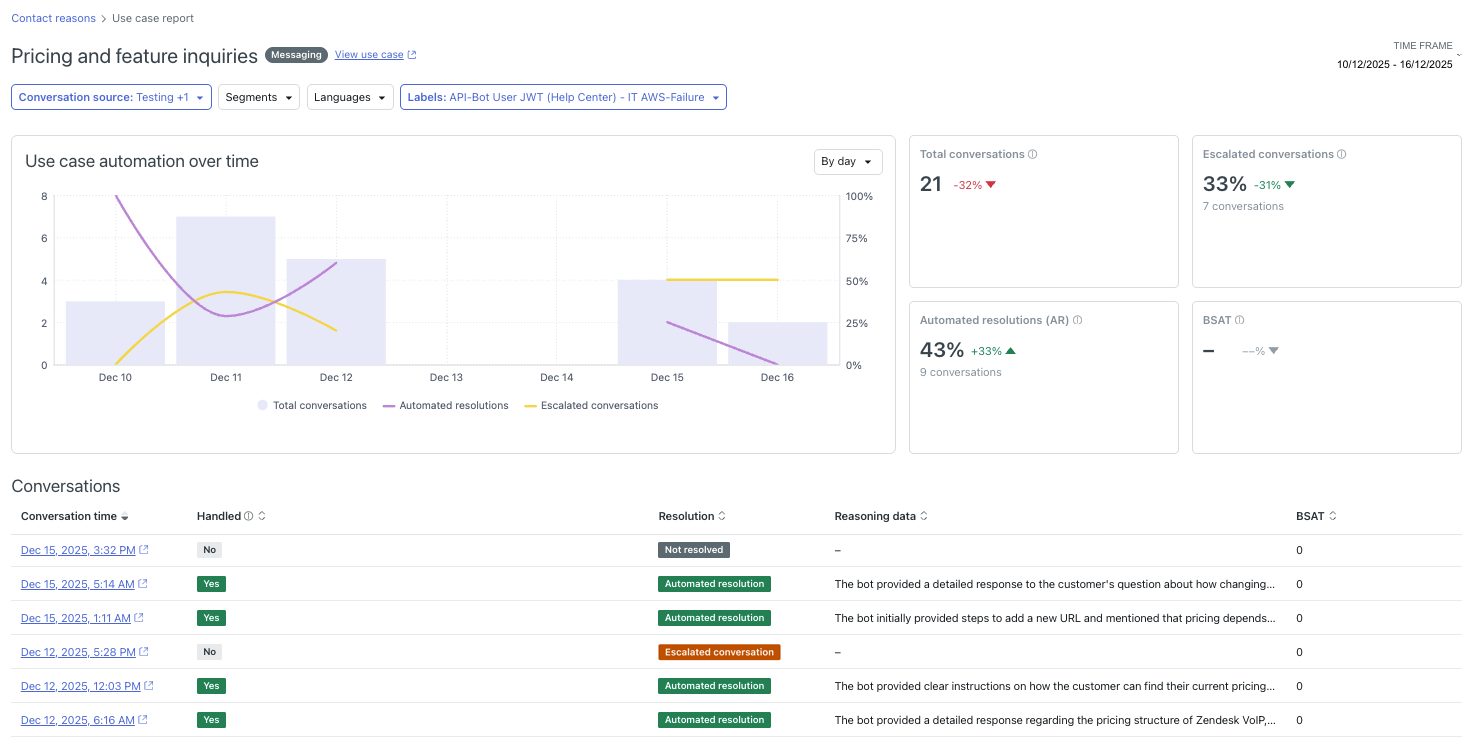
You can filter the use case report by Conversation source, Segment, Language, and Label.
The use case report includes the following information:
- Use case automation over time: A column chart showing the total volume of conversations that triggered this use case over the last week. Overlaid line graphs show the number of those conversations that resulted in either an automated resolution or an escalation.
- Total conversations: Conversations that triggered this use case.
- Escalated conversations: Conversations with this use case that were escalated to a human agent.
- Automated resolutions (AR): Conversations with this use case that resulted in an automated resolution.
- BSAT: Conversations with this use case with a BSAT rating of 4 or 5.
-
Conversations: A list of conversations that correspond to the
filter conditions set in the report, showing the following columns:
- Conversation time: The date and time the conversation started.
- Handled: Whether the conversation was fully handled by the AI agent. This includes messaging conversations with a recognized use case and no escalation attempts, and emails where an AI agent reply was sent.
-
Resolution: One of the following possible resolution
statuses:
- Automated resolution: Evaluated by the LLM and determined to be an automated resolution.
- Not resolved: Evaluated by the LLM but determined not to be an automated resolution, or else not handled.
- Escalated conversation: Escalated to a human agent. Not evaluated by the LLM.
- Reasoning data: The outcome of the LLM evaluation describing why a conversation is considered to be an automated resolution. Reasoning data is shown only for conversations that are considered Handled.
- BSAT: The conversation’s BSAT rating.
The conversations list has a maximum of 500 rows. Only the most relevant first 500 conversations are shown, based on the filters and sort conditions applied. To view additional conversations, use the conversations log.
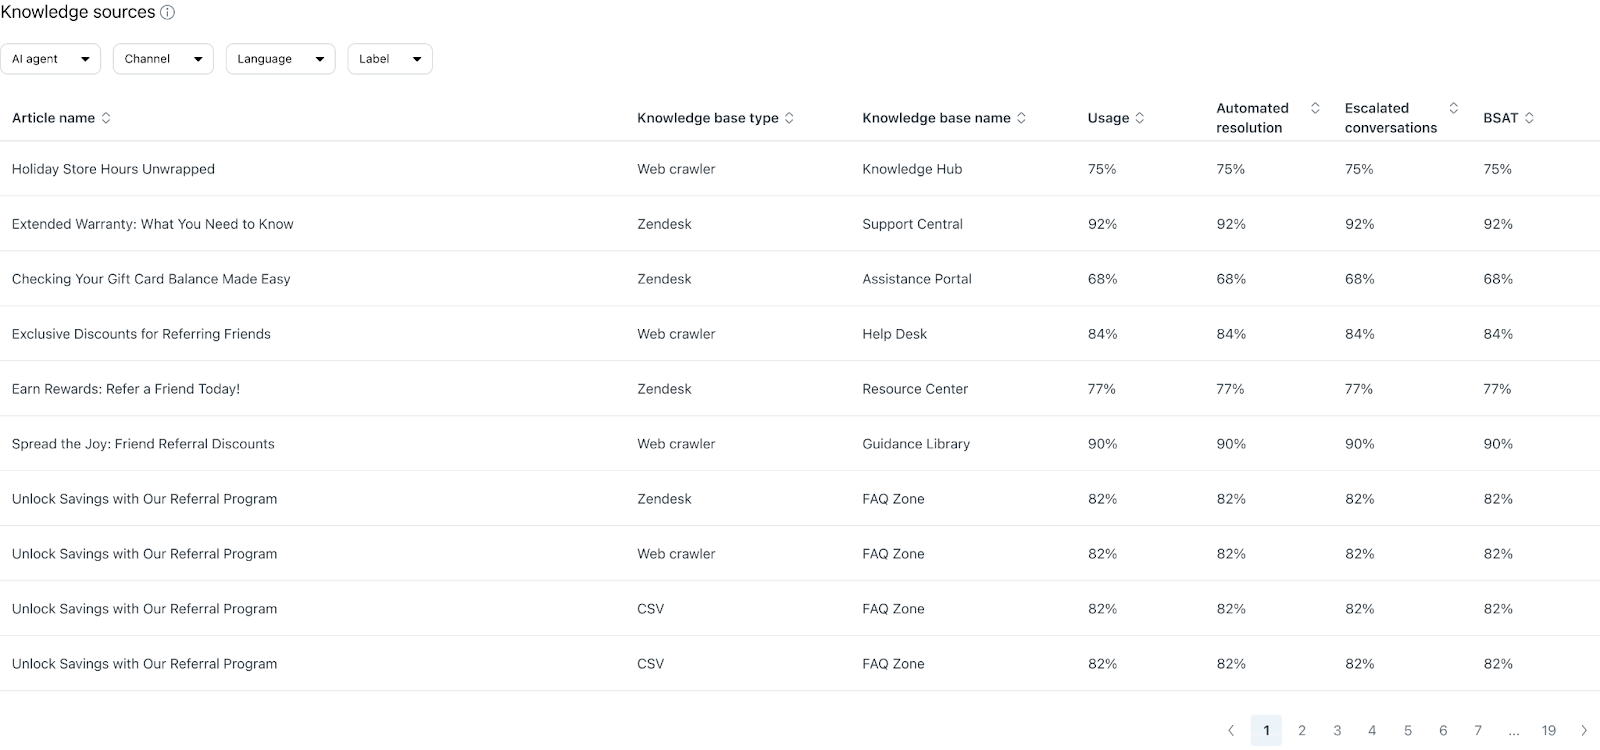
Knowledge sources
The Knowledge sources report shows a table of imported knowledge sources and their respective performance. You can filter this report by AI agent, Channel, Language, and Label.
This table includes the following columns:
- Article name: The title of the article. This will be listed across all article sources included.
- Knowledge base type: The knowledge source of the article. Possible values include Web crawler, Zendesk, and CSV.
- Knowledge base name: The name the knowledge base was given when it was imported.
- Usage: The percentage of conversations where the article was used to generate a reply (out of the total number of conversations where an AI-generated reply was provided).
- Escalated conversations: The percentage of conversations where the article was used to generate a reply and the conversation was later escalated.
- Automated resolutions: The percentage of conversations where the article was used to generate a reply and the conversation counted as an automated resolution.
-
BSAT: The average BSAT score across conversations where the
article was used to generate a response.
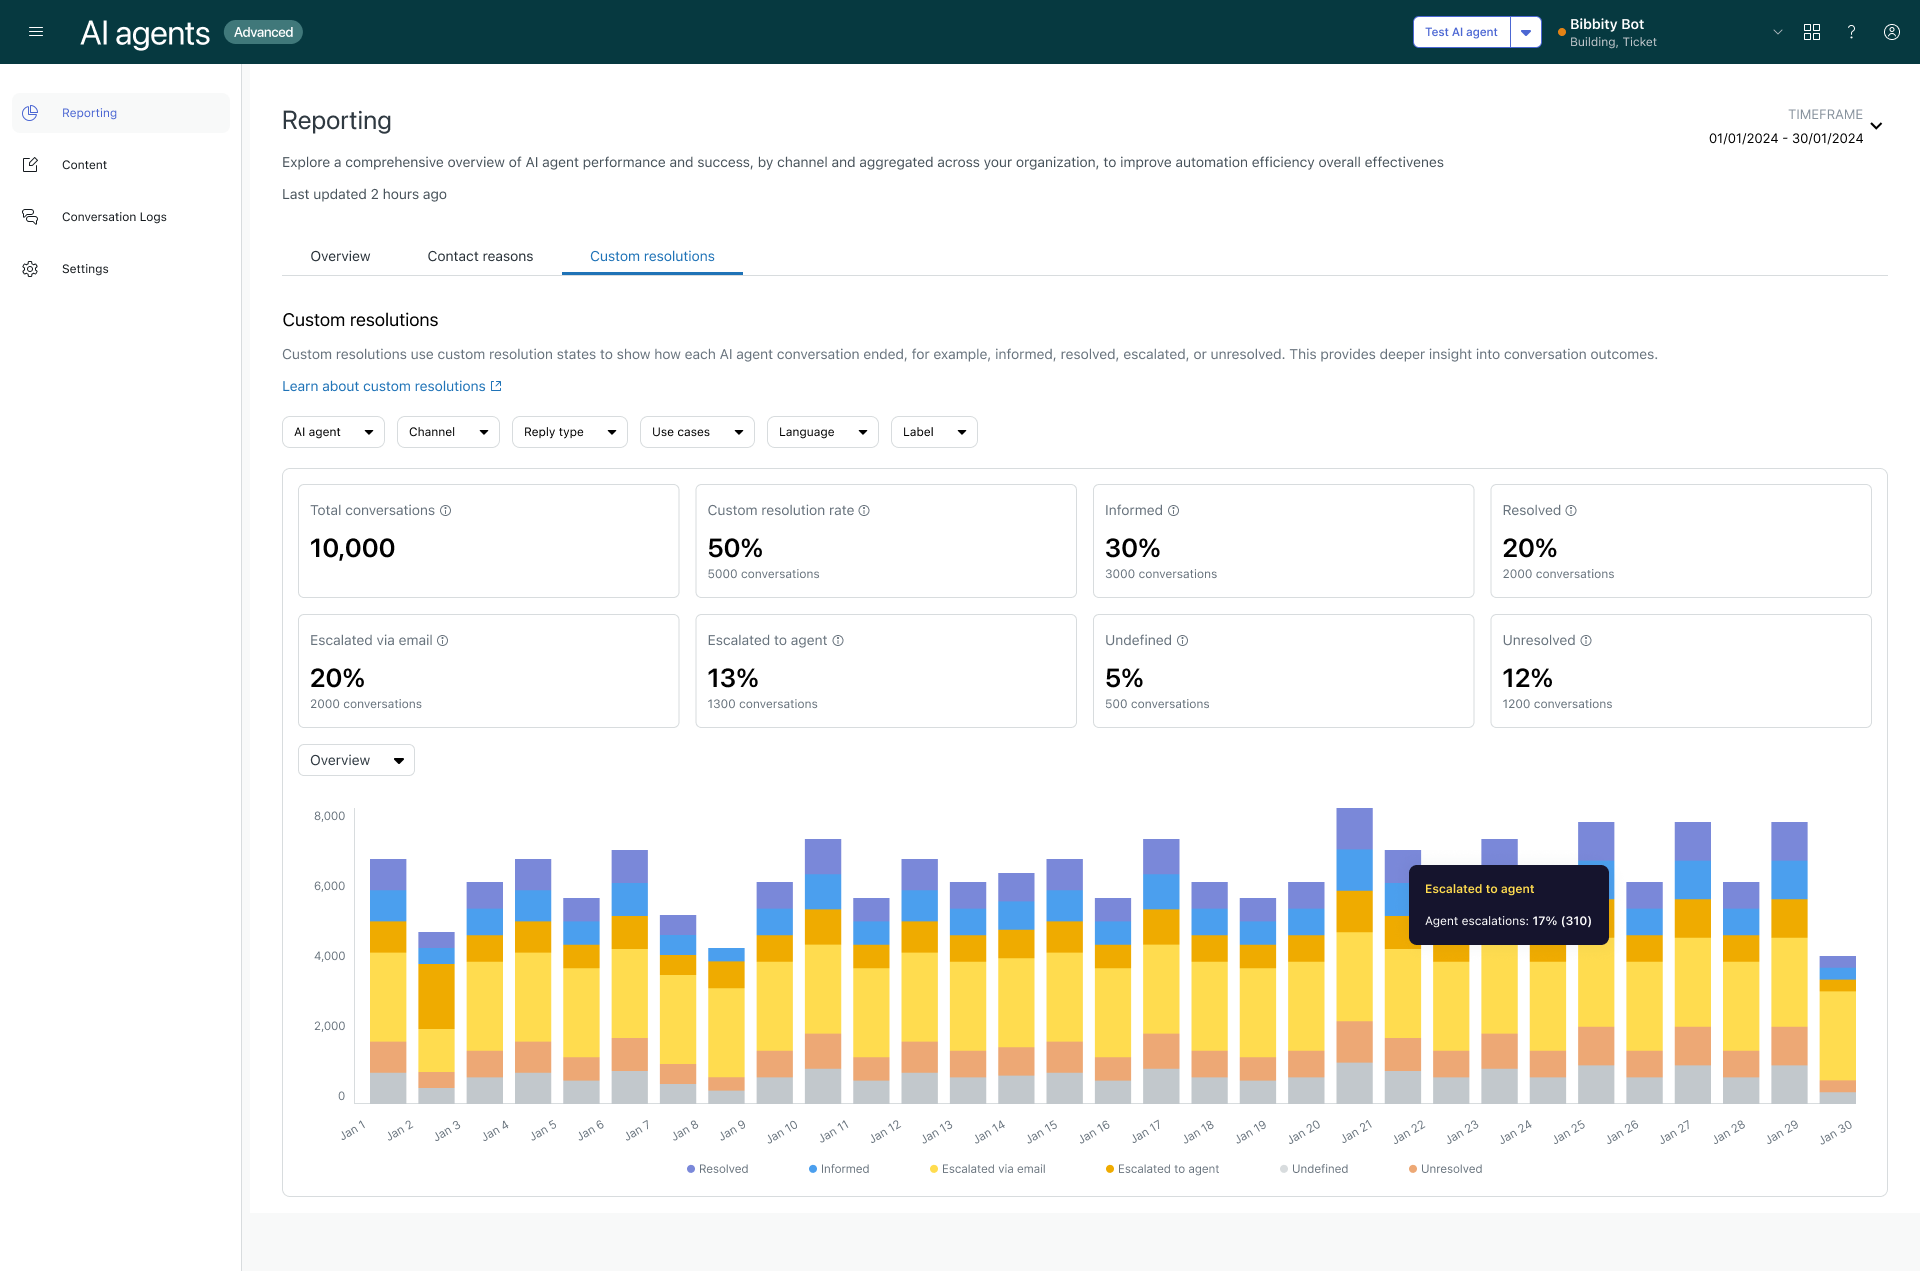
Custom resolutions tab
The Custom resolutions tab shows KPIs of each of the custom resolution states. For each of these KPIs, the results are also graphed over time and you can change the report’s view to group the results by total volume, channel, AI agent, or language.
You can filter the reports on this tab by AI agent, Channel, Reply type, Use case, Language, and Label.
Custom resolution state KPIs
The Custom resolutions tab shows the following custom resolution state metrics:
- Total conversations: The number of conversations with an AI agent.
- Custom resolution rate: The percentage and actual number of AI agent conversations that ended with a custom resolution state.
- Informed: The percentage and actual number of AI agent conversations where the AI agent provided guidance to the customer. For more information, see Using the informed state.
- Resolved: The percentage and actual number of AI agent conversations that ended with a meaningful resolution and no further questions from the customer.
- Escalated via email: The percentage and actual number of AI agent conversations that were converted into an email ticket. This state is automatically set when the conversation flow reaches an Escalation block in a dialogue with the “Send an email” option set.
- Escalated to agent: The percentage and actual number of AI agent conversations that were escalated to a human agent. This state is automatically set when the conversation flow reaches an Escalation block in a dialogue with the “Forward to an agent” or “Custom escalation” option set.
- Undefined: The percentage and actual number of AI agent conversations that ended without a custom resolution state, often due to drop-off or use cases missing a custom resolution state.
-
Unresolved: The percentage and actual number of AI agent
conversations where the issue was not answered or resolved.
Filtering the reports
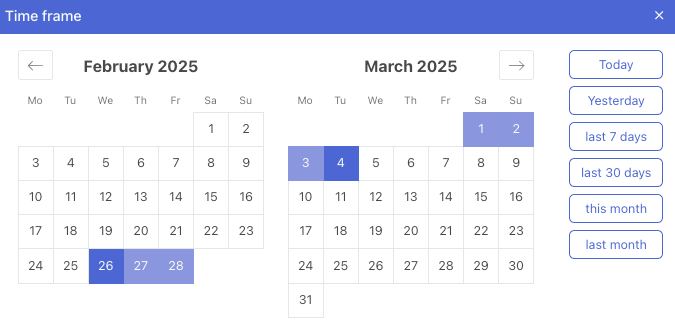
You can filter the dashboard’s reports by time frame or other attributes.
To filter the dashboard by time frame
- In the Reporting dashboard, in the upper-right corner, click Time frame.
- Using one of the following methods, select the dates you want to view
conversations for:
- On the right, select one of the predefined time frames: Today, Yesterday, Last 7 days, Last 30 days, This month, Last month
- Select specific beginning and end dates on the calendar
To filter the dashboard by other attributes
-
In the Reporting
dashboard, click one of the following filters and select its
values as needed depending on the data you want to see:
- AI agent: The AI agent who participated in the conversation.
- Channel: The channel the conversation took place in. Values can be Messaging or Email.
-
Reply type: The type of replies the AI agent can provide.
Possible values include Use case, Knowledge, Hybrid, and Other. (Not
available in the Knowledge sources report.)Note: The Other value includes responses where neither a use case nor a knowledge source was used in the reply, such as small-talk answers or custom instructions.
- Use case: The use case or intent detected during the conversation. (Not available in the Knowledge sources report.)
- Language: The language detected during the conversation.
- Label: The labels applied to the conversation.
- Click Apply.
- Repeat the steps above to apply any additional filters as needed.
Changing a report's view
For the AI agent workload and custom resolutions reports, you can apply different views that change how the results are presented. Different views let you focus on different aspects of the overall data.
To change a report’s view
-
In the Reporting
dashboard, select one of the following tabs:
- For AI agent workload reports: Overview
- For custom resolutions reports: Custom resolutions
- Select one of the metrics.
- Above the visualization on the left side, click the drop-down to select one
of the following report views:
- By channel
- By AI agent
-
By language
- (Optional) Above the visualization on the right side, click Daily, Weekly, Monthly, or Quarterly to change how the report’s results are aggregated.
Exporting report data
You can export report data from the dashboard as a CSV file. This allows you to further manipulate the results or upload them into your business intelligence tool of choice.
To export report data
- In the Reporting dashboard, select the tab that contains the report you want to export.
- (Optional) Apply filters to the tab.
- Click Export CSV.
The Export CSV panel opens.
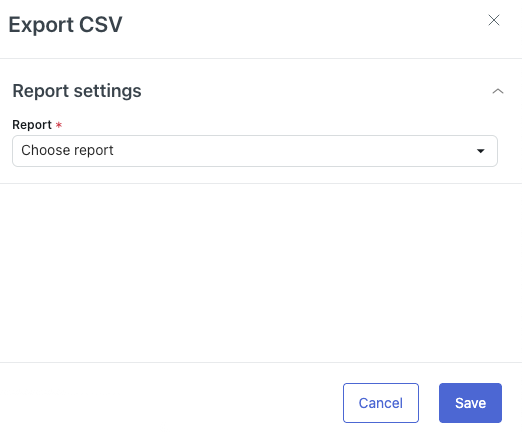
- In Report, select the report you want to export.
The available reports depend on which tab you've selected:
- Overview tab
- Total conversations
- Understood conversations
- Escalated conversations
- Assisted conversations
- Handled conversations
- Automated resolutions
- Rated conversations
- BSAT score
- BSAT score breakdown
- Total conversations vs automation
- All conversation data
- Contact reasons tab
- Use case performance with current filters
- Use case performance without filters
- Knowledge sources with current filters
- Knowledge sources data without filters
- Custom resolutions tab
- Custom resolutions overview (includes data from the chart)
- Custom resolutions (includes data from the KPI cards only)
- Overview tab
- If Break down by is available for your selected report, select one of the following options: By AI agent, By language, By channel
- If Frequency is available for your selected report, select one of the
following options: Daily, Weekly, Monthly,
QuarterlyNote: This option controls the time frame the data is aggregated by in the report export. It doesn't create a recurring export of the selected data.
- Click Save.
Your report is downloaded as a zip file.