The AI agent activity dashboard provides real time visibility into your AI agent activity. You can use this dashboard to monitor active AI agent conversations, review resolution performance, identify escalation patterns, and troubleshoot failures related to actions, integrations, and escalations.
Additionally, the dashboard helps you see which use cases generate the most activity, which knowledge sources support successful resolutions, and where assisted escalations or failed events might point to opportunities for improvement. By using filtering and drill-in insights, you can better understand activity across every channel, and optimize AI agent performance at scale.
This article contains the following topics:
Turning on the AI agent activity real-time monitoring dashboard EAP
You can join the AI agent activity dashboard EAP from Admin Center.
To turn on the EAP
- In Admin Center, click
 Workspaces in the sidebar, then select Analytics.
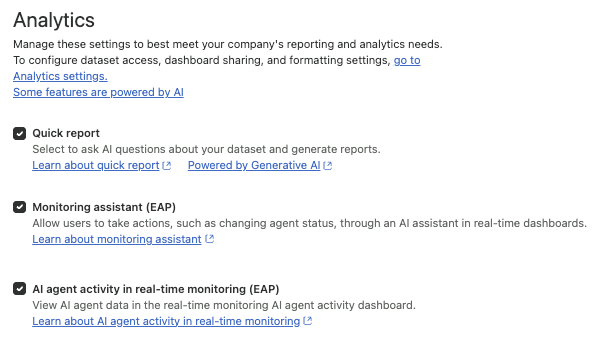
 - On the Analytics page, select AI agent activity in real-time monitoring (EAP).
- Click Save.
Accessing the AI agent activity real-time monitoring dashboard
- Dashboard considerations include:
- Users can see AI agents independent of any role restrictions in the AI agents product.
- Users can see ticket IDs independent of group or brand restrictions.
- Test conversations are not included in the dashboard reports.
To access the AI agent activity dashboard
- In Analytics, click the real-time
monitoring home icon (
 ) in the sidebar.
 - Locate the AI agent activity dashboard and click View.
The AI agent activity dashboard opens.
Understanding the AI agent activity real-time monitoring dashboard reports
The AI agent activity dashboard contains the following tabs:
Activity
The activity tab provides a live view of in-progress AI agent conversations along with historical trends and failure reports. It helps you monitor current volume, spot issues quickly, and understand AI agent performance by channel, segment, and use case.
You can filter this tab by AI agent, channel, segment, use case, language, label, and time - conversation started (historical data).
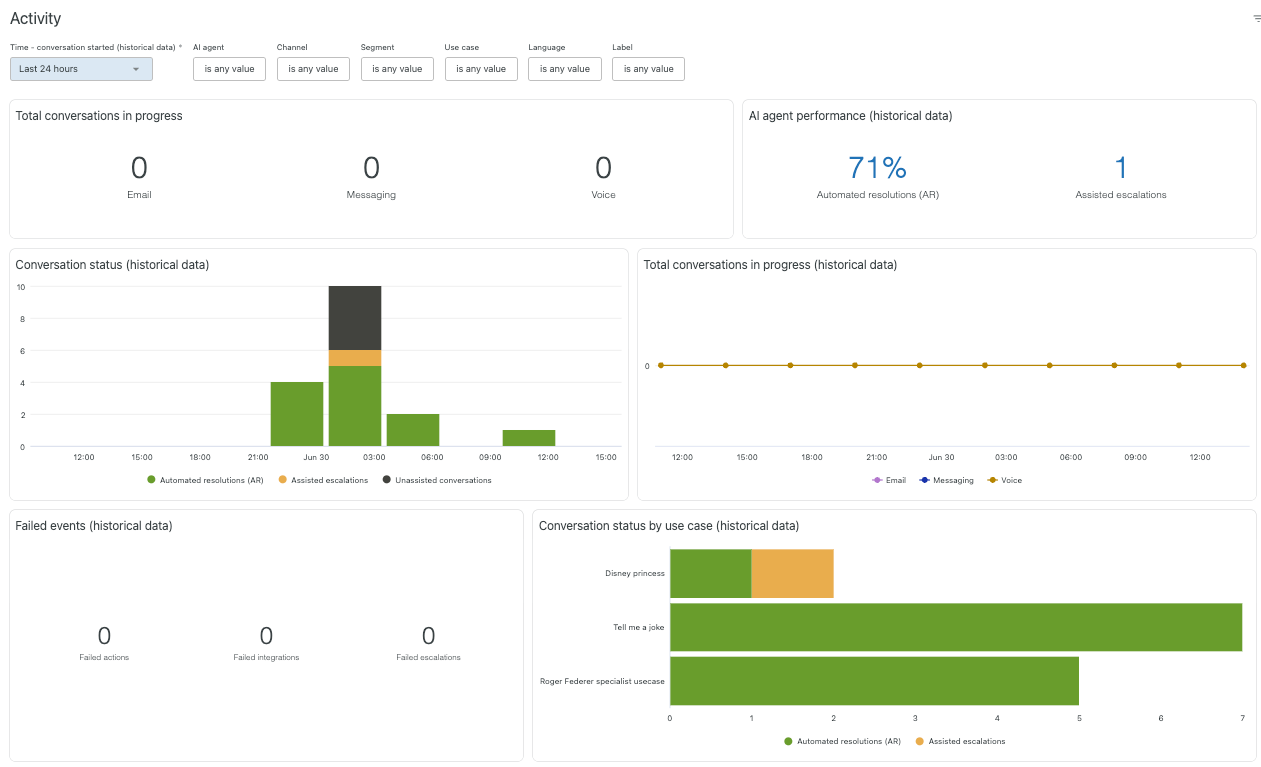
The tab contains the following reports:
Real-time reports
- Total conversations in progress: The number of conversations in progress across email, messaging and voice. You can drill into this report to see more information relating to the conversations, such as ticket ID, AI agent, channel, and more.
Recent history reports
-
AI agent performance: Helps you to understand how often the
AI agent is resolving conversations on its own or handing them off for human
support. The report shows the following information:
- Automated resolutions (AR): The percentage of conversations that included at least one identified use case (other than a system reply) and a provided response, or a successful knowledge answer provided by agentic reasoning or the generative replies/uGPT reply.
- Assisted escalations: The number of conversations that were escalated to a human agent.
-
Conversation status: Displays the distribution of
conversation outcomes over time including:
- Automated resolutions (AR): The number of conversations that included at least one identified use case (other than a system reply) and a provided response, or else a successful knowledge answer provided by agentic reasoning or the generative replies/uGPT reply.
- Assisted escalations: The number of conversations that were escalated to a human agent.
- Unassisted conversations: The number of conversations that triggered only system replies, with the exception of a successful generative replies/uGPT reply. The AI agent performed no automation except for AI agent-level actions that are triggered for all conversations.
- Total conversation in progress: Displays the number of active conversations over time, broken down by channel.
- Failed events: Displays the number of failed events over time, including failed actions, integrations, and escalations.
- Conversation status by use case: Shows an overview across assisted escalations and automated resolutions by use case, helping you compare which use cases are being handled successfully by the AI agent and which ones may require more support.
- Conversations in progress: Shows a table of active conversations in progress. Use this table to further investigate live conversations. This table includes information on ticket ID, AI agent, channel, segment, and more.
Use cases
The use cases performance tab shows a table of all existing use cases and their respective performance across your AI agents and channels.
You can filter this report by AI agent, channel, segment, use case, language, label, and time - conversation started (historical data).
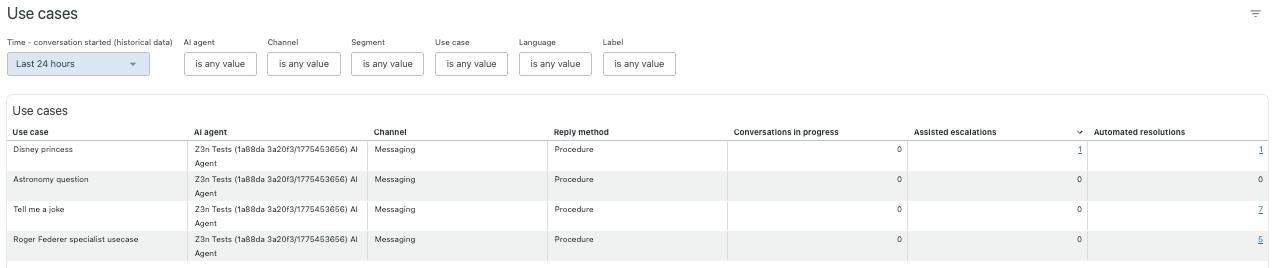
This table includes the following columns:
- Use case: The name of the dialogue or procedure.
- AI agent: The AI agent that the dialogue or procedure was created for.
- Channel: The channel that the AI agent is configured for. Values include email, messaging, and voice.
- Reply method: How the reply was triggered. Values include dialogues and procedures.
- Conversations in progress: The number of conversations in progress where the use case was detected.
- Assisted escalations: The number of conversations that were escalated to a human agent where the use case was detected.
- Automated resolutions: The number of automated resolutions across conversations where the use case was detected.
Knowledge sources
The knowledge sources tab shows a table of imported knowledge sources and their respective performance.
You can filter this report by AI agent, channel, language, and time - conversation started (historical data).

- Article: The title of the article. This will be listed across all article sources included.
- Type: The knowledge source of the article. Possible values include web crawler, Zendesk, and CSV.
- Knowledge source: The name the knowledge source was given when it was imported.
- Conversations in progress: The percentage of conversations where the article was used to generate a reply (out of the total number of conversations where an AI-generated reply was provided).
- Assisted escalations: The number of conversations where the article was used to generate a reply and the conversation was later escalated.
- Automated resolutions: The number of conversations where the article was used to generate a reply and the conversation counted as an automated resolution.
Events
The events tab gives you a historical view of actions, escalations, and integrations triggered by AI agent activity. It helps you monitor success rates, spot failure patterns, and identify the most common causes of integration issues.
You can filter by AI agent, channel, segment, use case, language, label, action, integration, and time - event occurred (historical data).
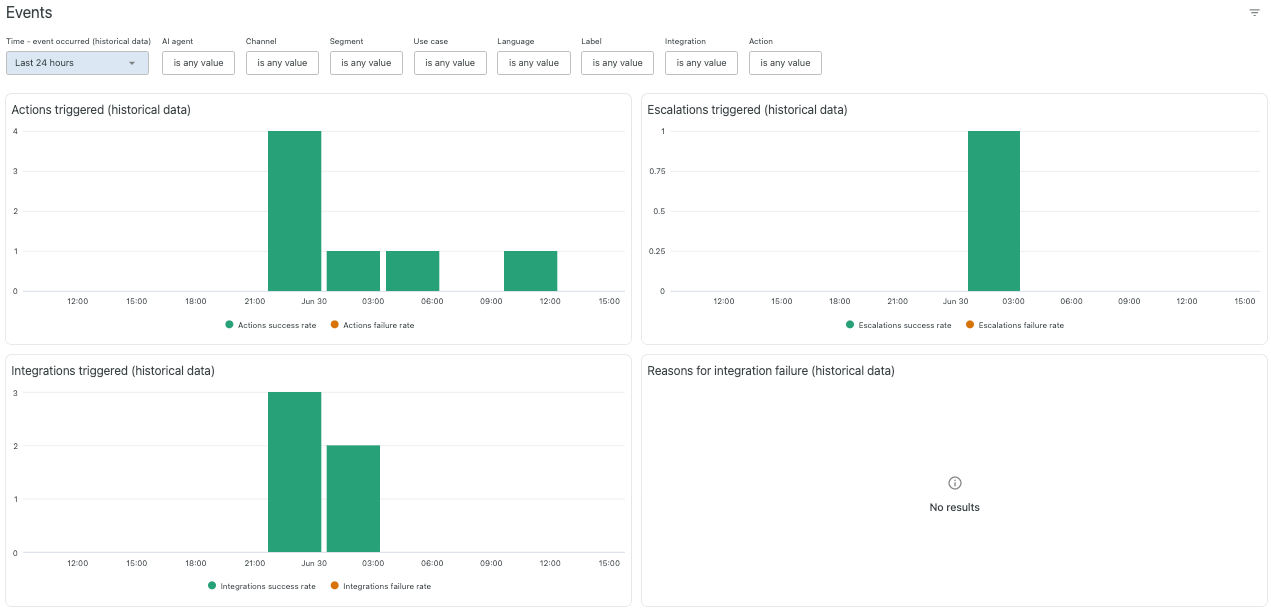
- Actions triggered: Displays the number of actions triggered over time broken down by actions success rate and actions failure rate.
- Escalations triggered: Displays the number of escalations triggered over time broken down by escalations success rate and escalations failure rate.
- Integrations triggered: Displays the number of integrations triggered over time broken down by integrations success rate and integrations failure rate.
- Reasons for integration failure: Displays the most common integration failure reasons.
Current limitations
- When you first activate the EAP, only the last seven days of historical data is available. As you use the EAP, this will build up to 30 days of data.
- Messaging conversations won't be included in reports if AI agent tickets are turned off.
- The report filters only show use cases, segments, labels, and language that have already been used in conversations.