Verified AI summary ◀▼
View your API usage to monitor API traffic and avoid rate limit issues. The API usage dashboard tracks requests, identifies potential breaches, and sends notifications when nearing limits. Optimize API calls by reducing unnecessary requests and consider purchasing the High Volume API add-on for increased limits. Stay informed with detailed insights and take proactive measures to maintain efficient API operations.
You can monitor the API usage in your account and increase your API usage limits if needed. It’s important to monitor your API usage to prevent being rate limited. You must be a Zendesk Support admin to view the API usage pages in Admin Center.
About the default limits for API usage
The following Ticketing and Help Center API rate limits apply to your Zendesk Suite and Support plans. In general, the rate limits for the Help Center API are the same as for the Support ticketing system API, but requests to the Help Center API don’t count against the rate limit of the Support API, and conversely. Rate limits also depend on the endpoints used, CPU time, and so on. See Rate limits.
| Plan | Requests per minute |
|---|---|
| Team | 200 |
| Growth | 400 |
| Professional | 400 |
| Enterprise | 700 |
| High Volume API add-on | 2500 |
Enterprise Plus plans include the High Volume API add-on.
Monitoring API usage against your rate limit
To help you monitor API usage on your account, Zendesk provides an API usage summary. You can use this summary to view your current usage and compare the activity with the API against your rate limit.
To track API usage
- In Admin Center, click
 Home in the sidebar.
A summary of your API usage appears on the Admin Center home page.

The summary shows your API usage (over the last 7 days) as compared with your API rate limits. If you are over your limit, you’ll see a warning symbol (!) in the summary.
- To view more details about your API usage, click View details.
You can also follow these instructions to view API usage details:
- In Admin Center, click
 Account in the sidebar, then select Usage > API.
A detailed dashboard appears that shows API usage.
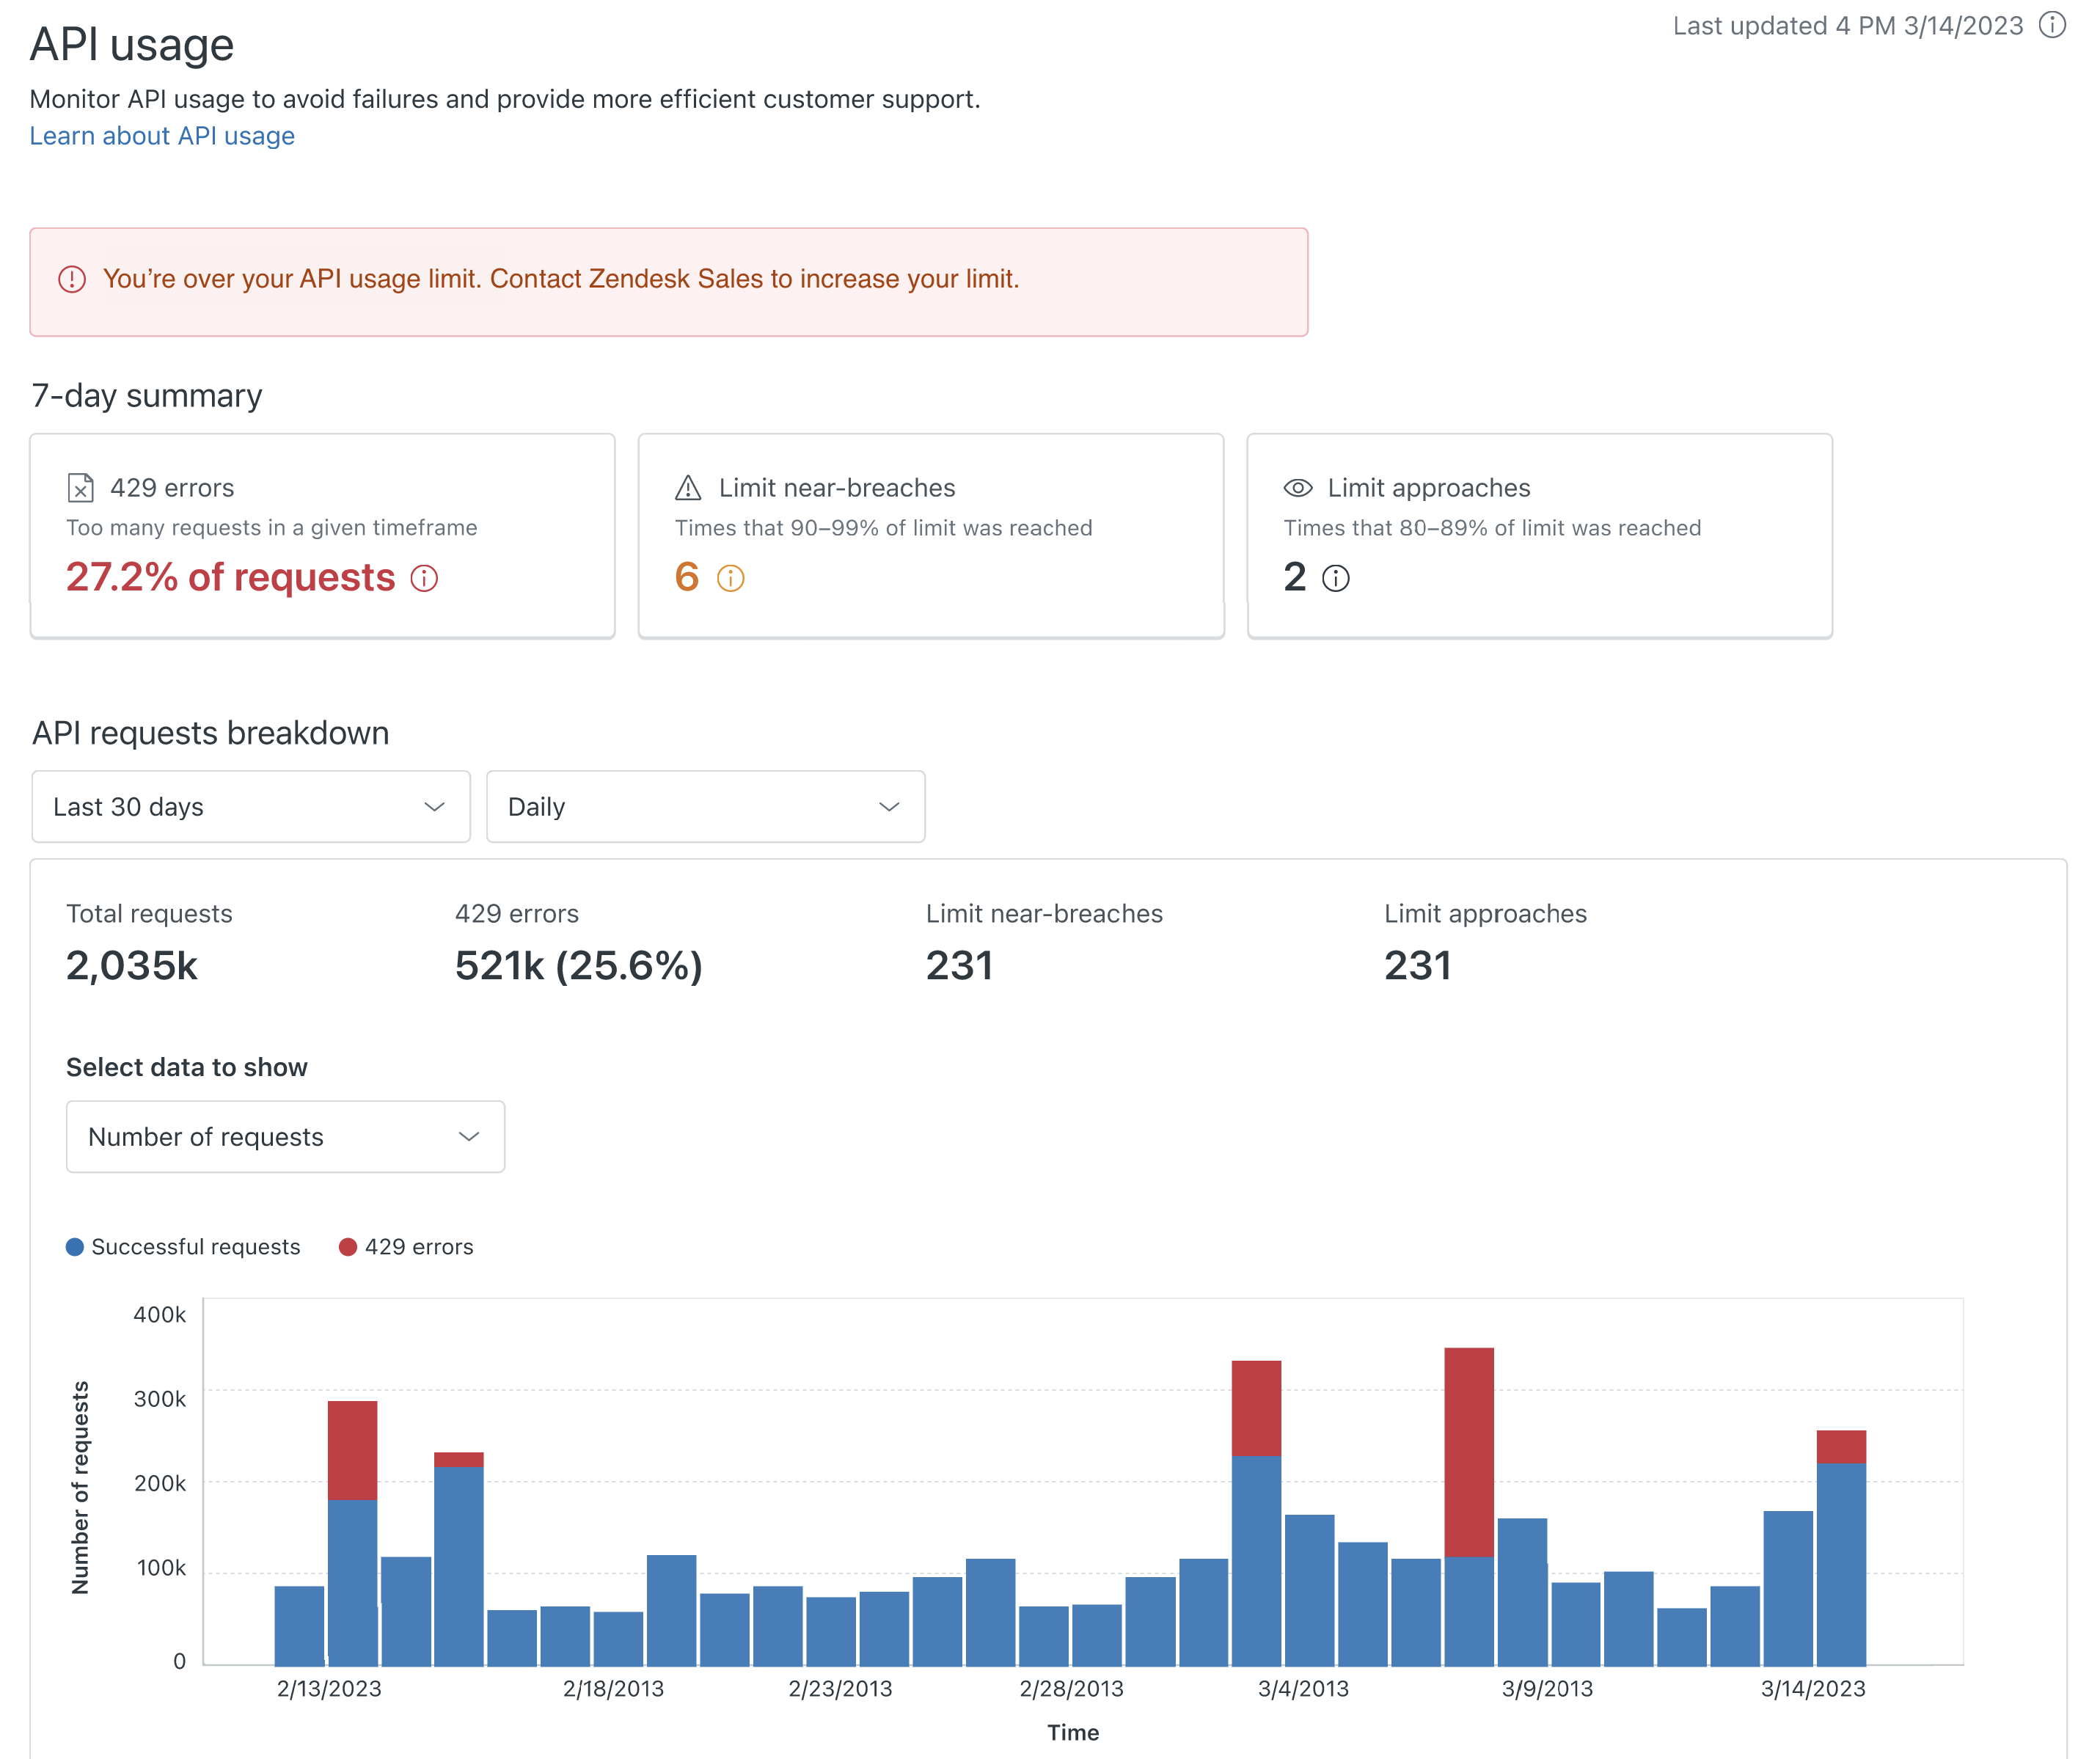
The dashboard shows an API usage summary supplemented by a time-based usage chart and tables. See About the API usage dashboard below for details
- In Admin Center, click
About the API usage dashboard
The dashboard covers API requests over time, while the tables provide a breakdown of total requests by callers and endpoints. The content is refreshed daily, but it can take up to 72 hours for your current usage to be reflected in the dashboard.
7-day summary
The 7-day summary cards include the following information:
- 429 errors: The API rate limit violations (HTTP 429 responses) during the last seven days, expressed as a percentage of the total number of requests during that period.
- Limit near-breaches: The number of times API calls measured between 90 and 99% of the plan limit during the last seven days.
- Limit approaches: The number of times API calls measured between 80 and 89% of the plan limit during the last seven days.
The Limit near-breaches and the Limit approaches cards enable admins to take proactive action against 429 errors.
API requests breakdown
This dashboard shows the total number of API requests, 429 errors, Limit near-breaches, and Limit approaches that occurred during the timeframe specified.
The clients are identified by the authentication credentials used. The name (or identity) shown in the table depends on the credential type.
- Public (Marketplace) app: The table shows the app name.
- Access token from a custom (private) OAuth client: The table shows the Zendesk admin user associated with the token (the user who generated it).
- Basic authentication with an API token: The table shows the Zendesk user whose credentials were used.
The dashboard includes drill-down options for time, caller, and product.
The following requests are excluded from activity:
- Requests using session authentication, such as requests by Zendesk apps or client-side requests from JavaScript code in help center.
- Anonymous requests requiring no authentication, except for the Requests API if enabled.
Timeframe and granularity
You can use the drop-down menus to show the chart by time window and granularity. Granularity options depend on the time window you select.
| Time window | Granularity options | Notes |
|---|---|---|
| 1 day | Hourly | 24 hours with hourly intervals |
| 7 days | Hourly, Daily | 7 days with hourly, or daily intervals |
| 30 days | Daily, Weekly, Monthly | 30 days with daily, weekly, or monthly intervals |
| 90 days | Daily, Weekly, Monthly | 90 days with daily, weekly, or monthly intervals |
| Custom range | Varies depending on range | Maximum range is 90 days |
Summary
The dashboard summary shows the total number of API requests, 429 errors, Limit near-breaches, and Limit approaches for the timeframe specified.
Chart
The bar chart shows the number of API requests over time, based on the timeframe and granularity you specified. You can set the chart to show API usage data for the Number of requests or for the Peak rate (requests per minute).
- Successful requests are shown in blue and 429 errors are shown in red.
- The gray line shows the API rate limit (requests per minute) for your account.
- You can hover your mouse over each data point to get more information.
The horizontal time scale is set to your local time, with the right-most mark the most recent. Peak rate shows the highest number of requests per minute within the time interval. Number of requests is the average number of requests per minute within the time interval.
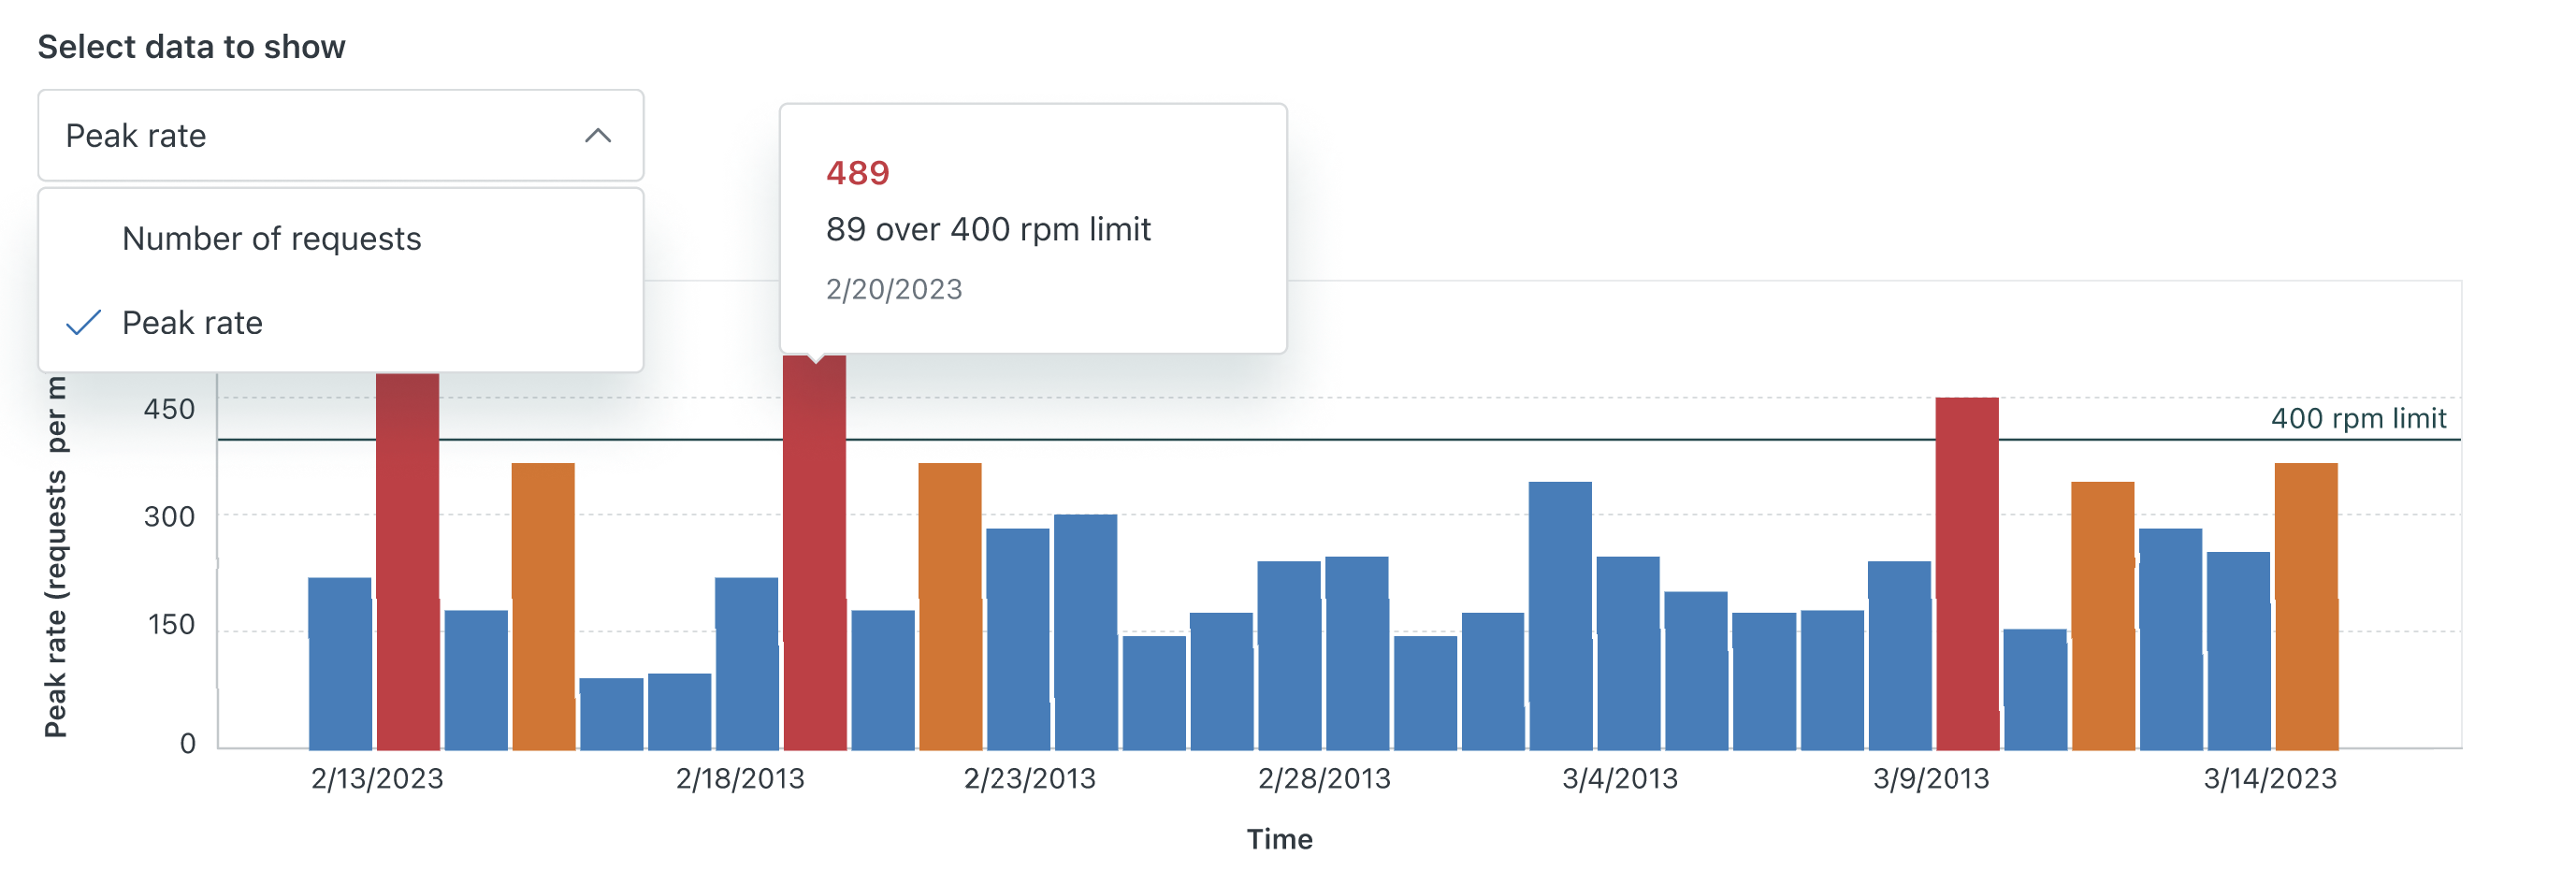
The chart scales based on the amount of activity, which can hide the rate limit line. With enough activity in the example, a horizontal line representing the rate limit would appear at the rate limit for your plan.
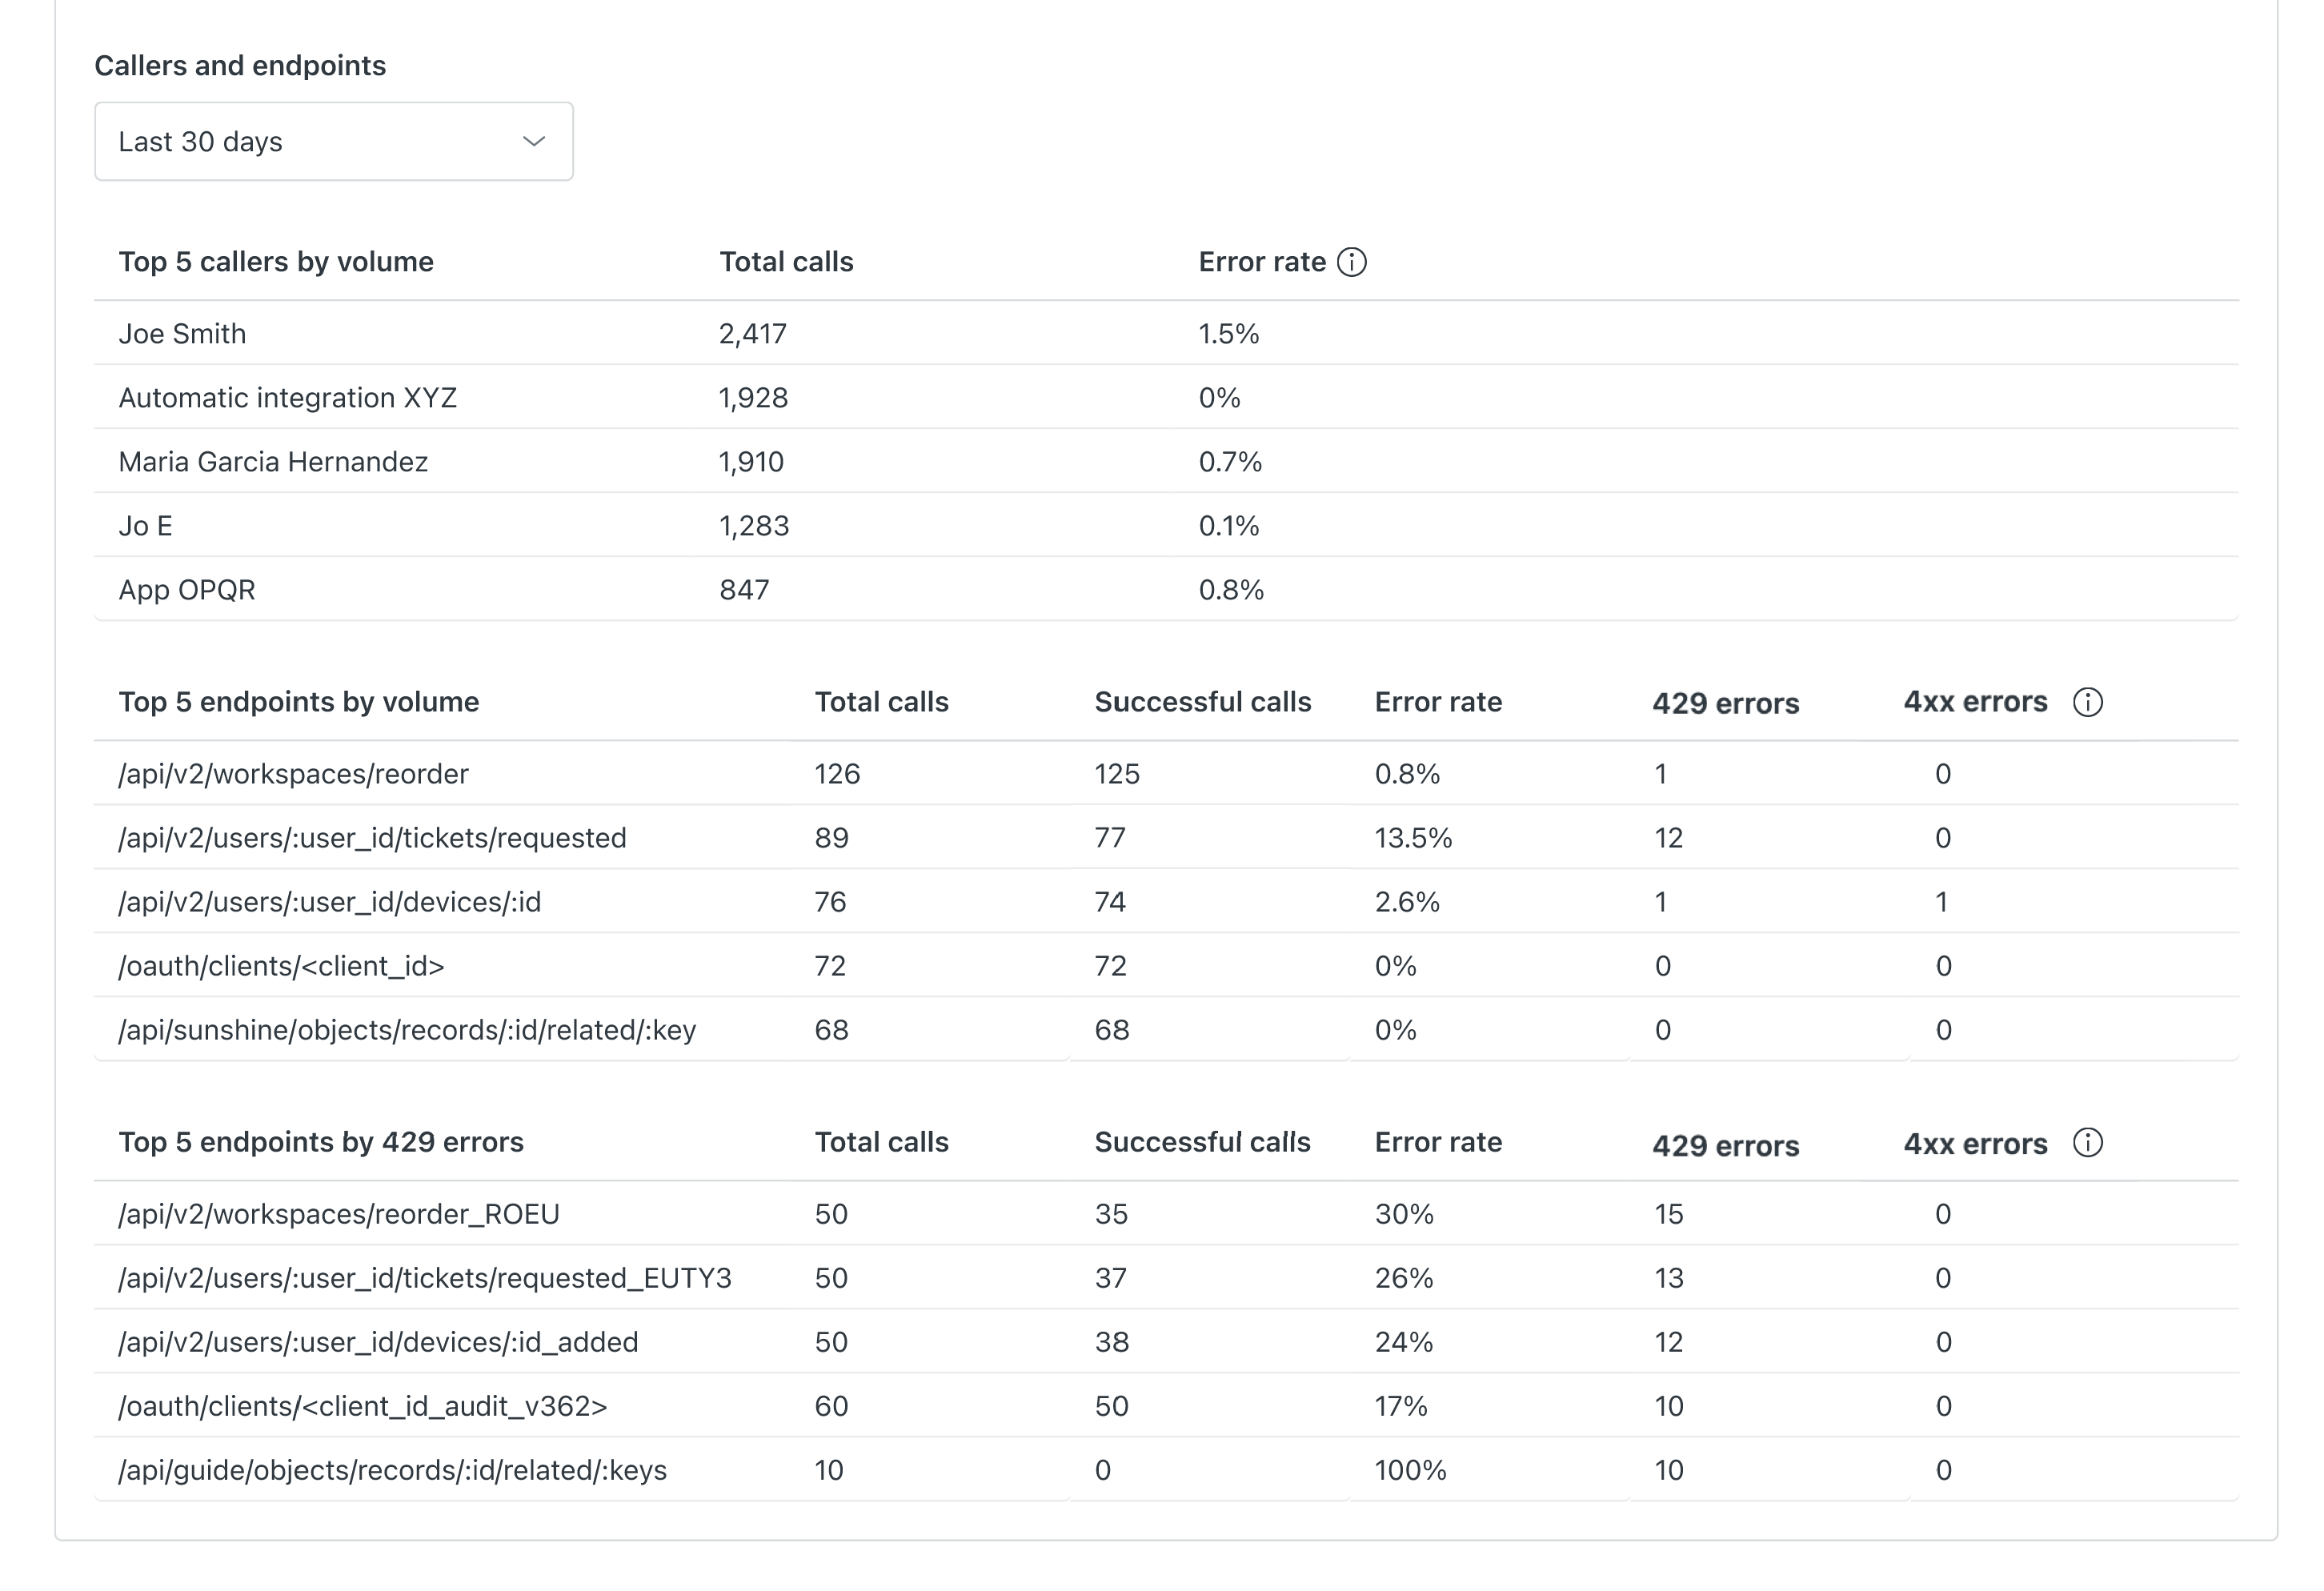
Tables
The tables below the chart show the following information:
- Top five callers with the highest number of API requests
- Top five most frequently called endpoints, based on total calls
- Top five most frequently called endpoints, based on a count of 429 errors
Callers are identified by the authentication credentials used. Depending on the credential type, the caller is shown as an app name, or Zendesk user name. For more information, see API requests breakdown.
API usage notifications
When you’re approaching your API usage limit, you’ll see in-product warning or error messages. These messages appear on the Admin Center home page and on the API usage page.
When you’re approaching your API usage limit, you’ll see an in-product warning message first. See example below. The default warning threshold amount is 80% of the plan limit.

If you go near or over your rate limit, you’ll receive an in-product critical threshold message. See example below. The critical threshold amount is 90% of the plan limit.

Reducing API usage
If you are approaching your rate limit, make sure you make only the requests that you need. Here are areas to explore for reducing the number of requests:
- Optimize your code to eliminate any unnecessary API calls.
- Cache frequently-used data.
- Sideload related data.
- Use bulk and batch endpoints.
For more information, see Best practices for avoiding rate limiting.
If you still have rate limit issues, you may be able to increase your API rate limit by purchasing the High-volume API add-on. See Increasing your API rate limit in this article.
Increasing your API rate limit
If you are nearing your API rate limit or if you’re expecting a steep increase in API activity, you may be able to purchase an add-on to increase the API usage limits for your account. If you want to purchase the High Volume API add-on, contact your account representative or Zendesk Sales to increase your API rate limit. Also, customers with eligible sales-assisted and self-service accounts can buy the add-on directly from their Subscription page. See Buying the High Volume API add-on. You must be the account owner or a billing admin to purchase the add-on.
The High Volume API add-on increases the number of permitted API calls to a higher volume of 2,500 requests per minute. This add-on is already included with Suite Enterprise Plus.
The High Volume API add-on increases a qualifying plan's limit to 2500 requests per minute to the Ticketing and Help Center APIs. It doesn't add an additional 2500 requests to the overall plan's limit.
Buying the High Volume API add-on
If you have an eligible sales-assisted or self-service account, you can buy the High Volume API add-on directly from the Subscription page in your account.
To buy the High Volume API add-on
-
In Admin Center, click
Account in the sidebar, then select Billing > Subscription.
A summary of your current plan appears.
- Click Manage.
If you don't see a Manage button on the Subscription page, then you don't have permission to make changes. If there are additional products you can buy, you’ll see a More products tab.
- Click More products.
A list of products you can add to your account appears, including the High Volume API add-on. The High Volume API add-on is listed only if your account is eligible to purchase the add-on from the shopping cart.

To learn more about the add-on, click Find out more.

- Click Add to subscription.
Your subscription summary is updated to reflect the purchase price.
- Click Update subscription to complete your purchase.
Tracking ticketing API activity against your rate limit (Legacy)
In addition to the API usage summary, you can also track Ticketing API activity in the Apps and integrations section of the Admin Center.
To track ticketing API activity
-
In Admin Center, click
 Apps and integrations in the sidebar, then select APIs > API
analytics.
Apps and integrations in the sidebar, then select APIs > API
analytics.The API analytics page appears.
 The page shows Ticketing API activity in the past 24 hours. The table provides a breakdown of total requests by client, while the graph measures the following metrics for requesrs over time:
- Peak requests: The highest number of requests in a single minute in the hour.
- Average request/min: The average number of requests per minute during the hour.
- Rate limit: The API rate limit configured for your account.