Verified AI summary ◀▼
Real-time monitoring dashboards enhance your analytics by focusing on use cases, offering immediate decision-making insights, and tracking trends up to seven days. Access three dashboards: Incoming Tickets for queue backlog, Ticket Progress for in-progress tasks, and Agent Productivity for performance across channels. Utilize multi-filtering and drill-in capabilities to gain a comprehensive view of your support operations.
Real-time monitoring dashboards build on the capabilities of the analytics dashboards you already use in Zendesk to add the following capabilities:
- Dashboards are based on use cases rather than channels to more accurately reflect common service workflows and agents' day-to-day tasks.
- Real-time reports provide the necessary context to make immediate decisions.
- Recent historical data is available for many reports to help you identify trends up to seven days in the past.
There are three dashboards, each with extensive multi-filtering and drill-in capabilities across all components on the dashboard.
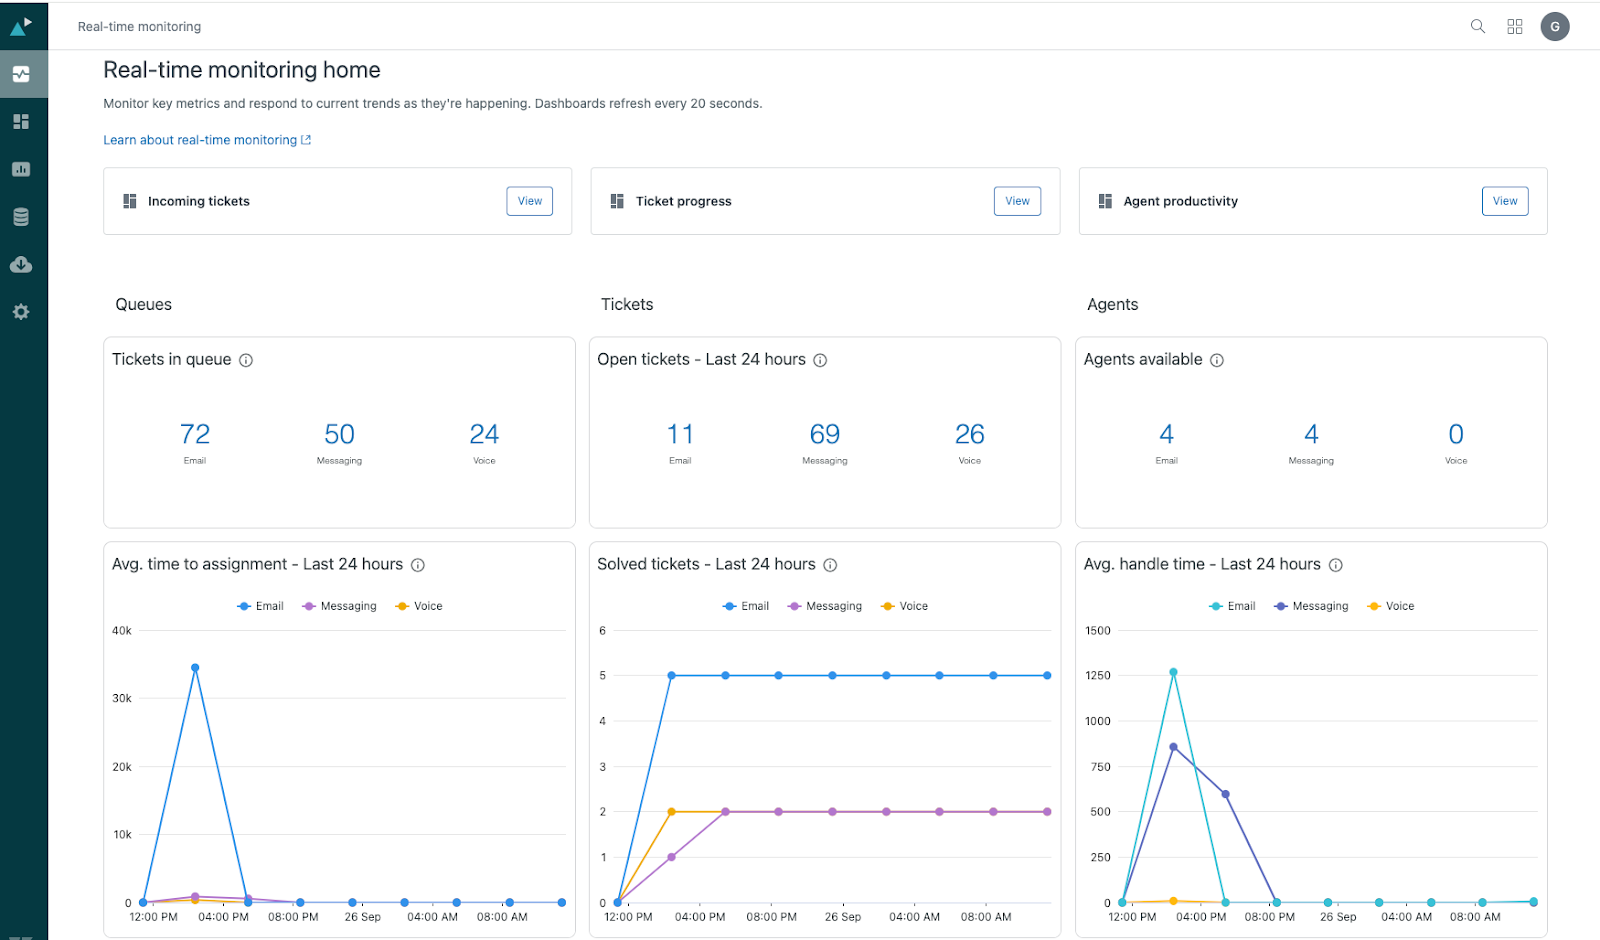
- Incoming tickets: Comprehensive reporting on your queue backlog with detailed drill-in (requires omnichannel routing).
- Ticket progress: Details about in-progress and recently completed tasks in your agent backlog.
- Agent productivity: An overview of how your agents and groups of agents are performing across channels.
These reports can be found on the Real-time monitoring home page available from Analytics in the Zendesk product tray.
The three dashboards feature multi-filtering and drill-in capabilities across all components on the dashboard.
You can read more about the real-time monitoring dashboards in the following articles: